The Trap Play MT5
- 指标
- Carl Gustav Johan Ekstrom
- 版本: 1.20
- 更新: 20 四月 2024
- 激活: 20
EA included, download here <---
Scalping strategy here <---
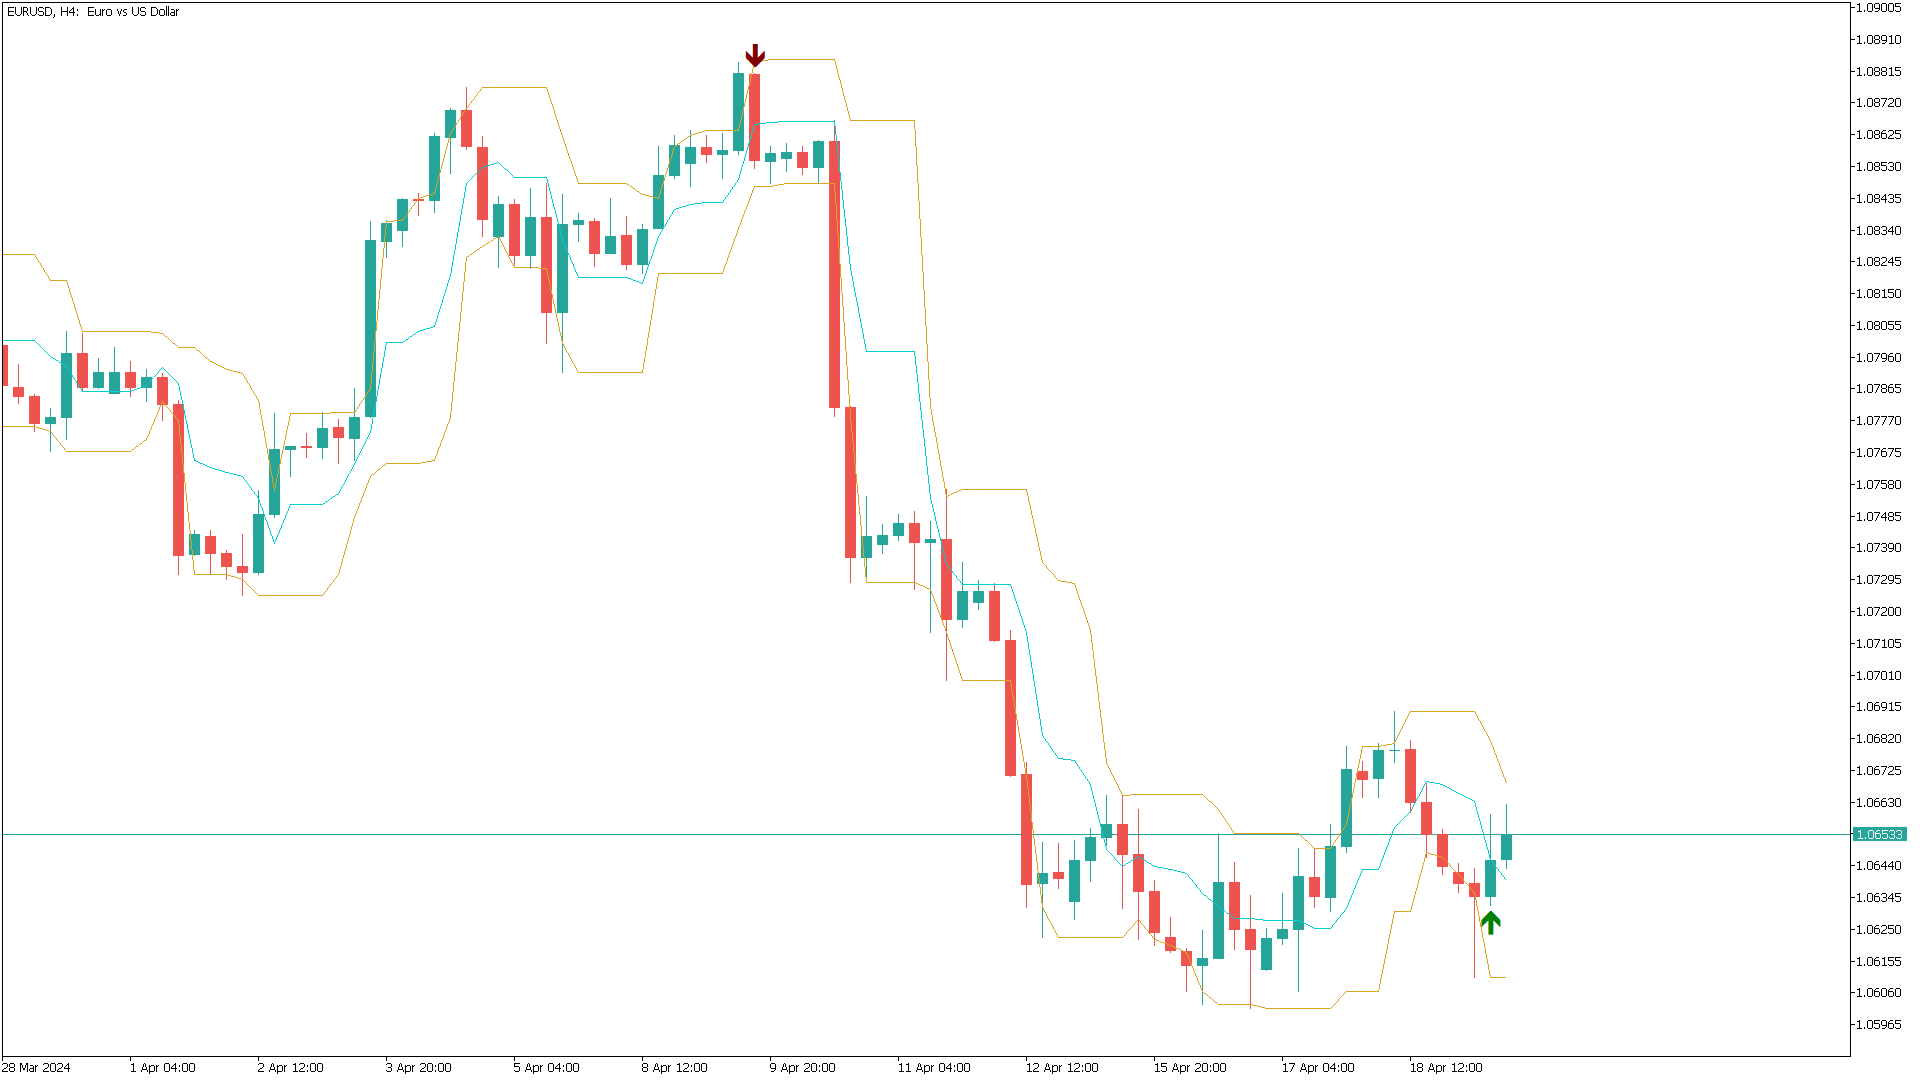
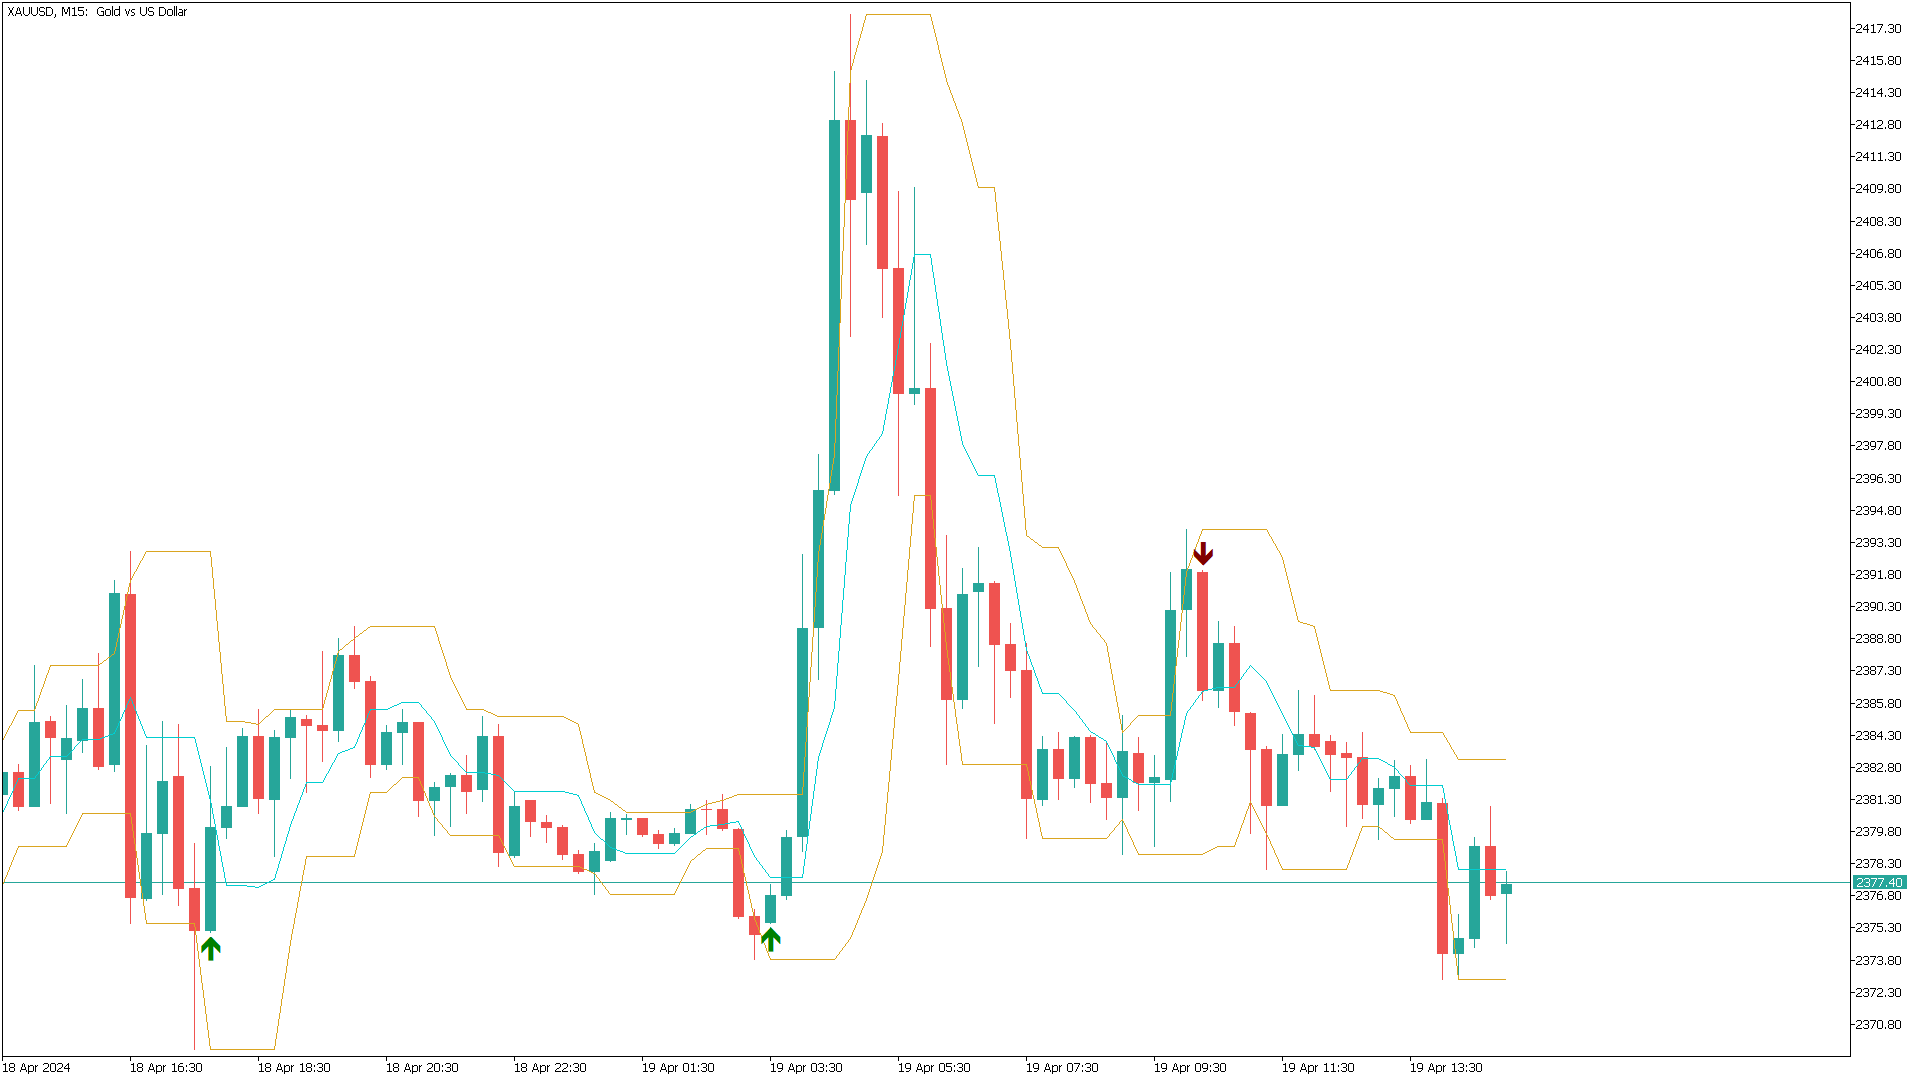
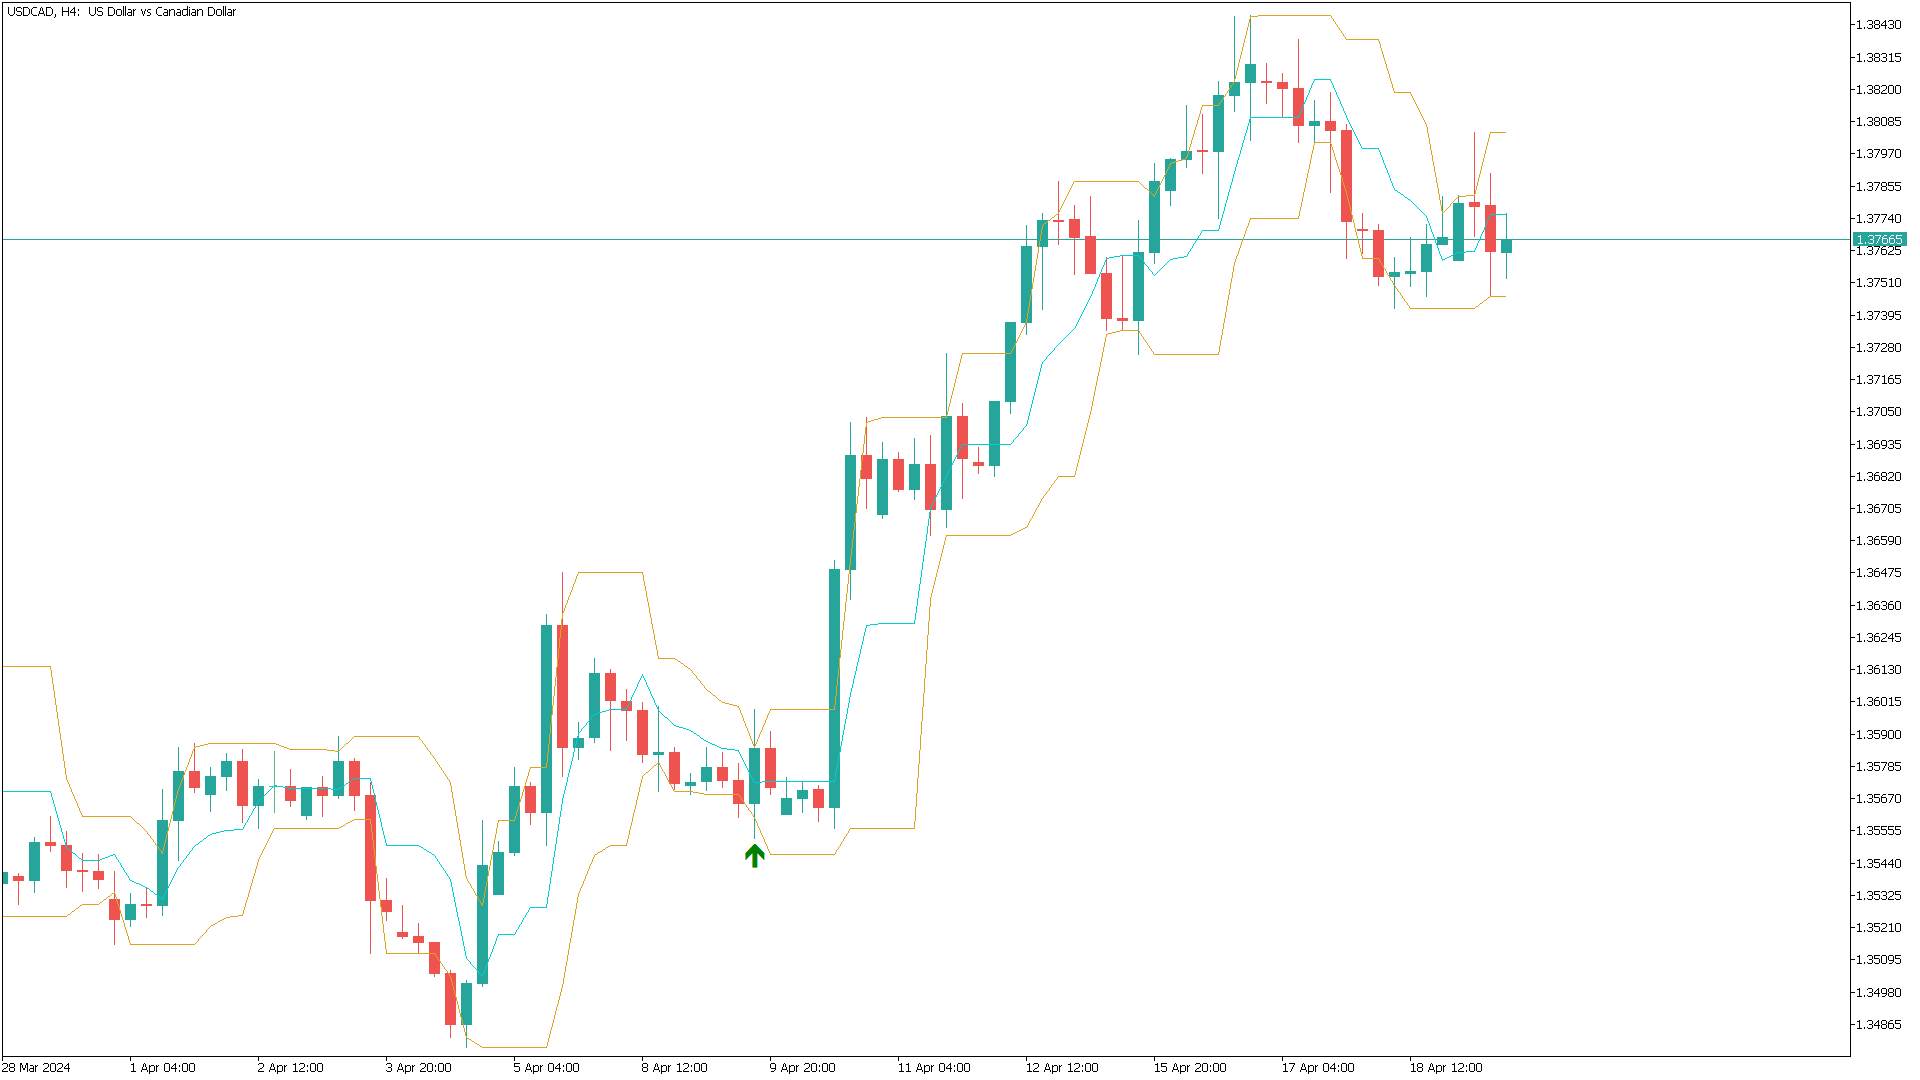
Trap Play refers to a market situation where price initially makes a new high or low, luring traders into believing a strong trend is forming. However, the price quickly reverses and invalidates the breakout, trapping those traders who entered positions based on the initial move. This sudden reversal often results in a rapid exit of positions, leading to significant price movement in the opposite direction. Trap plays can occur in various financial markets and timeframes and are characterized by their ability to catch traders off guard and create significant market volatility.
The Donchian Channel serves as a powerful tool for identifying Trap Plays and consists of three lines:
-
Upper/Lower Channel Line: These lines track the highest and lowest prices observed over a specified period. They are instrumental in recognizing potential breakout-levels where Trap Plays may unfold.
-
Middle Channel Line: This line represents the average value between the upper and lower channel lines. It acts as a reference point for traders to assess the overall trend prevailing in the market. When the price remains above the middle line, it indicates an uptrend, while a price below the middle line suggests a downtrend.
The choice of period to calculate the upper and lower channel lines varies based on the trader's preferences and the timeframe under analysis. While the commonly used period ranges from 5 to 20 periods, traders have the flexibility to adjust it according to their specific trading strategies and the characteristics of the market being examined.
Parameters
- Period: 5
- Sound Alert: On/Off (triggers sound alert on new signal)
- Sound File Name: alert.wav
- Mobile Push Notification: True/False
- Send Email Notification: True/False
- Pop-Up Alert: True/False