Pro Trader mt4
- 指标
- Natasha Diedericks
- 版本: 1.1
- 更新: 15 二月 2023
- 激活: 15
This indicator takes input from the RSI and a trend filter, and presents the output in a separate indicator window as a histogram.
Great for scalping.
Settings:
No need to set up the indicator.
Features Alerts.
How to use:
Simply attach to any chart
Zoom chart in to get a better view of the histo color.
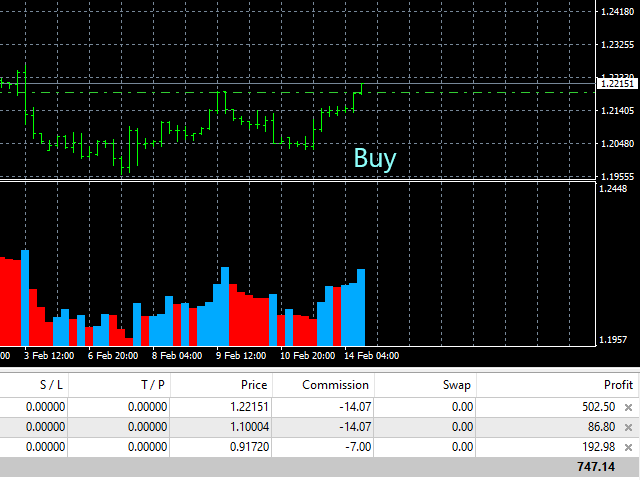
Buy:
Blue histo color on multiple timeframes. (e.g,. M30-H1-H4)
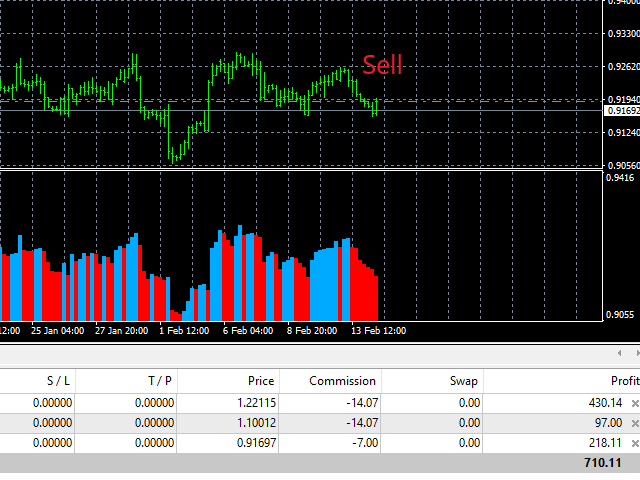
Sell:
Red histo color across on multiple timeframes.Or backtest and use as you see fit for your strategy.
Best results on Major Pairs, but can also be used on other pairs.
Important to note:
-
Please do not use this indicator haphazardly. Make sure it compliments your strategy.
-
Don't risk money you cannot afford to lose.
-
You use this indicator at your own risk. Please apply money management wisely.
-
Always test your strategy on a demo account before using a new indicator on a live account.