UR PulseScalp MT5
- 指标
- Krzysztof Jan Debski
- 版本: 1.10
- 更新: 21 五月 2024
- 激活: 5
UR PulseScalp MT5
一個經過校準的交易指標,適用於在快節奏市場中尋求終極優勢的剝頭皮交易者
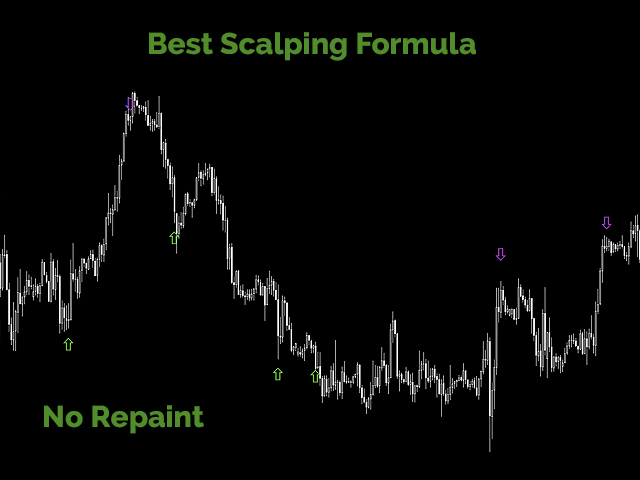
UR PulseScalp MT5 是一種尖端的交易解決方案,適用於在快節奏市場中尋求終極優勢的剝頭皮交易者。 這一創新指標建立在經過科學校準的公式之上,該公式融合了波動率、資金流量和相對強度的力量,以創建高度準確和可靠的信號。
使用 UR PulseScalp MT5 的優勢:
舒適的互動面板
在 M5 和 H1 上高度準確
為初學者推薦的 EURUSD 貨幣對
沒有設置
適應各種資產
不會趕上每一波浪潮——這就是它的美妙之處。 它會分析最佳條目,即使它必須等待它。
有一個特殊的電報聊天,您可以在其中了解最新的工具更新,如果您覺得缺少什麼,也可以發送請求!
為什麼選擇 UR PulseScalp MT5?
無論您是經驗豐富的剝頭皮交易者還是新手,“UR PulseScalp”都是在金融市場的波濤洶湧中航行的理想伴侶。
UR PulseScalp MT5 是基於多年的交易以及一路上風險管理的最佳解決方案精心打造的。 它在視覺上也令人愉悅且易於使用。 在硬數據和統計分析的支持下,您將有能力進行快速、明智的交易。 這種精密設計的工具為您提供了解市場狀況的實時窗口,使您能夠迅速果斷地採取行動,抓住出現的每一個機會。
如何使用 UR PulseScalp MT5?
啟動指標
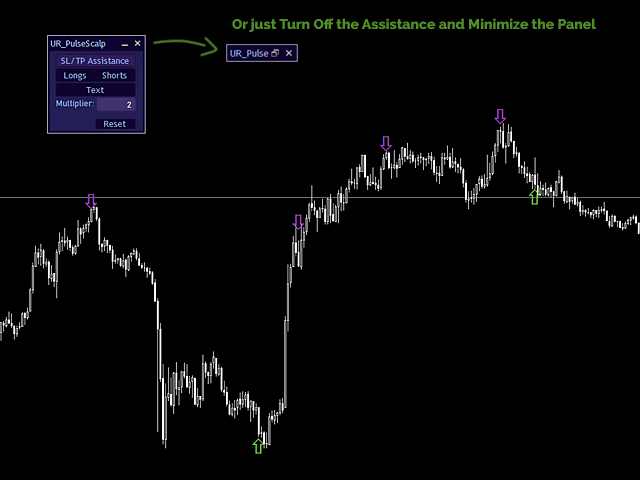
您無需在指標設置中進行任何設置 - 一切都在交互面板中設置
根據提供的信號採取行動 - 向上或
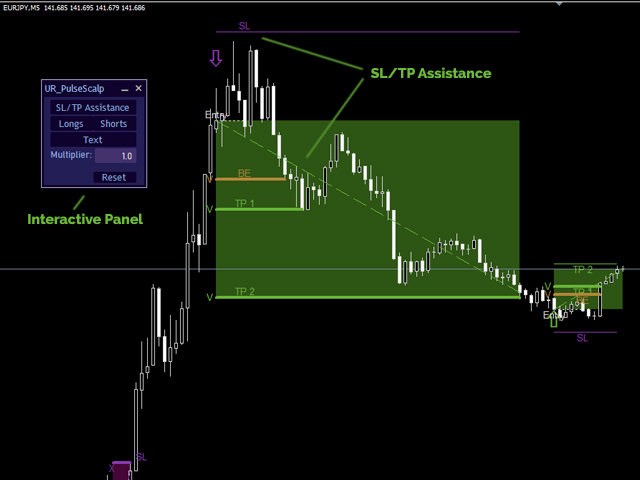
顯示 SL/TP 幫助以幫助您設置 SL 和 TP 級別 - 如果需要
設置 SL/TP 輔助,以便它顯示您需要的任何內容或您的交易方向
展示
兩側箭頭:它們表示以給定方向進入的時刻
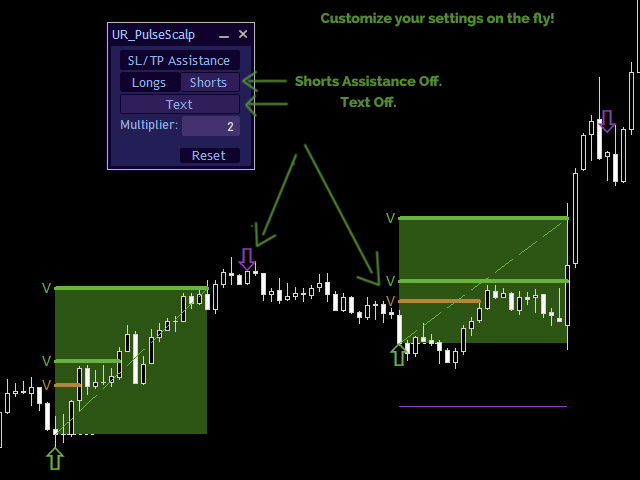
浮動面板:用於設置圖表指標的交互式面板
SL/TP 輔助:設置開/關建議的 SL 和 TP 級別
長褲/短褲:設置長褲和短褲的開/關輔助
文本:設置打開/關閉止損/止盈輔助周圍的文本
乘數:輔助的乘數 - 影響止損和止盈水平
重置:重新初始化指標,以防它在視覺上中斷