• 概述
  • 评论
  • 评论 (1)

Hidden Gap Zone Box

MetaTrader indicator that detects WRBs (Wide Range Bodies/Bars) and Hidden Gaps.

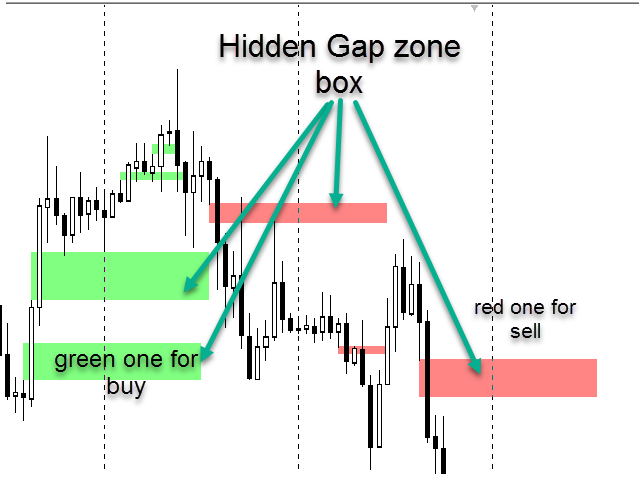
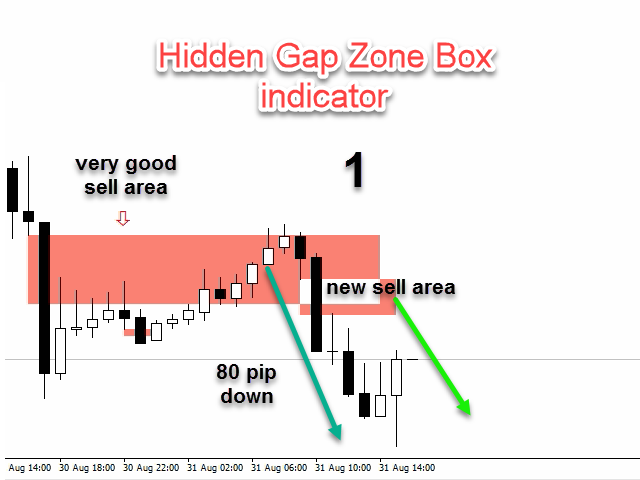
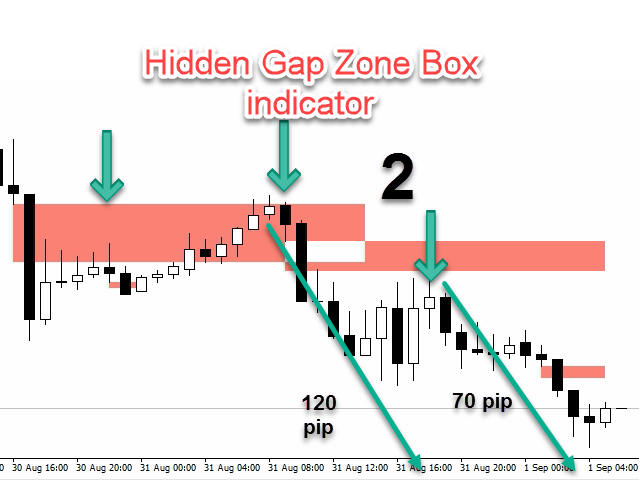
WRB Hidden Gap MetaTrader indicator detects WRB and marks it. WRB can be either a Wide Range Bar (a very large bar) or a Wide Range Body (a candlestick that has a very long body). WRB alone do not provide much information so the indicator uses WRB to detect Hidden Gaps. The indicator also displays filled and unfilled Hidden Gaps in a different way, making it easier to view the market situation at a glance

This indicator doesn't generate trading signals. This indicator provides information about price action that can be used to assist traders with exit and entry signals from other strategies. WRB bars can be meaningless. However, WRB can only show Hidden Gaps. Hidden Gaps can be viewed as support/resistance zones or pivots. Hidden Gaps could also be considered the weekly price gaps.
ــــــــــــــــــــــــــــــــــــــــــــــــــــــــــــــــــــــــــــــــــــــــــــــــــــــــــــــــــــــــــــــــــــــــــــــــــــــــــــــــــــــــــــــــــــــــــــــــــــــــــــــــــــــــــــــــــــــــــــــــــــــــــــــــــــــــــــــــــــــــــــــــــــــــــــــــــــــــــــــــــــــــــــــــ

Input parameters

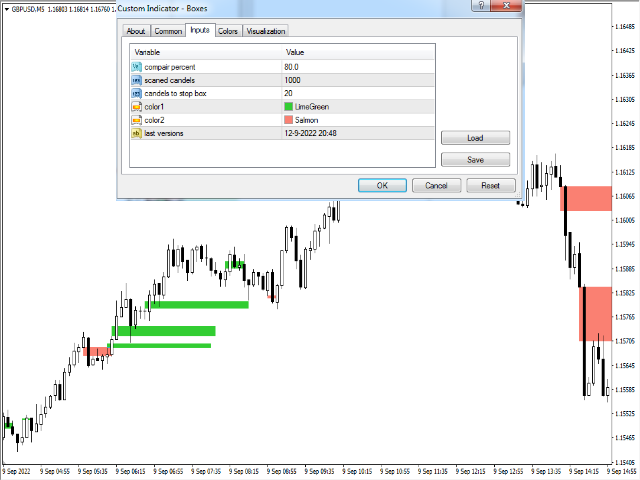
  • COMPARE PERCENT - IT'S A Wide Range Bodies Comparing by last 3 BAR.
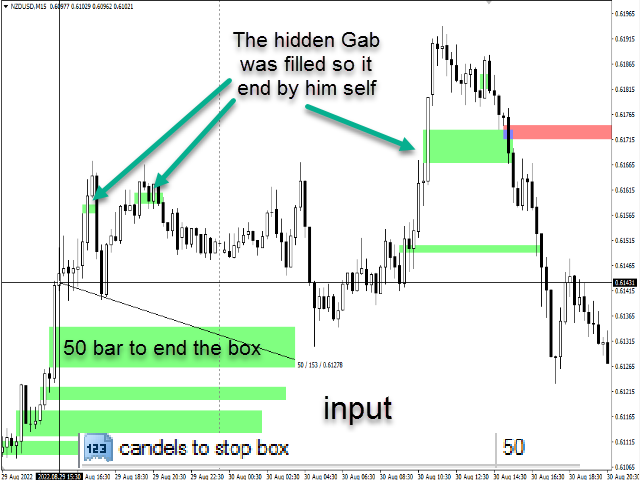
  • shift candles - How many bars will the Hidden Gap appear on chart.
  • candles to stop box - How many bars to stop the  Hidden Gap zone box .
  • color 1 --  Hidden Gap Color for bullish candles.
  • color 2 -- Hidden Gap Color for bearish candles.


Our Scalping strategy 

https://c.mql5.com/1/244/6t5s7e.gif

推荐产品
Adr alert multi pair
Vladimiro Lazzaretti
Indicator is able to alert by pop and acoustic alarm the achievement of the average price range of the last periods so as to be able to set our operation. It allows different percentage variables reached and periods of variation according to the parameters entered. Apply your reverse strategies to achieving that threshold so you get higher success rates. Indispensabile per le strategie reverse intraday.
An indicator of patterns #45 and #46 (Three Falling Peaks and Three Rising Valleys) from Encyclopedia of Chart Patterns by Thomas N. Bulkowski. Parameters: Alerts - show alert when an arrow appears   Push - send a push notification when an arrow appears (requires configuration in the terminal) PeriodBars - indicator period K - an additional parameter that influences the accuracy of pattern shape recognition. The smaller the value is, the smoother the row of peaks/valleys should be, so fewer patt
hint: my basic indicators are used like that KingLevel combind with KingSequence will provides basic insights of the price action of the markets and KingSequenceSgn is just for the convienent for watching. And plus with Forex Trading mentor subsccription I will assist you to win the market at first later if it's great will be upgraded to King Forex trading mentor. Slide 1: Title Slide Title: Unveiling Market Rhythms with Advanced Price Momentum Analysis Subtitle: A Revolutionary Trading Ind
MaxiFinishTrend 2
Stsiapan Kreidzich
4.77 (31)
125 美元。 今天折扣! 智能交易系统 - 17 項指標 - 全部合而為一。所有時間範圍、貨幣、加密貨幣、金屬...所有 MT4 以及任何螢幕和範本都會自動配置。初學者將簡單地根據信號進行交易。獨特的彈性演算法的參數在設定中是開放的,交易者的成功率就是他設定的結果。  想法1:如果觸發了“止盈”或“止損”,或者您平倉了,該指標很快就會在相同方向上發出新信號- 當趨勢在回滾後繼續時,或在相反方向上- 如果趨勢改變。除了「買進/賣出」之外,在極值點也給予「獲利」訊號。這種策略會增加結果 - 當您獲得最大利潤並進行更多交易時。可用的「訊號優化器」和訊號過濾器:「Filter_Stoch_M15」(僅隨機 M15 方向的訊號)、「Filter_Stoch_H1」以及指示風險交易的「TrendLine_Gray_when_risk」。      思路二:可以准确选择交易时刻。 随机指标线 M1、M5、M15、M30、H1、H4 在一个窗口中同步。 它们的反转(进入点)和每分钟的走势都可以在一张图表上看到所有时间范围。      想法 3:一个紧凑的货币活动扫描仪,它会自动将带有新信号的图表切
Percentage
Luis Alberto Atuncar Sanchez
Daily Percentage and Current Candle Would you like to know how much an asset has risen or fallen in a day or in the last candle? Do you want a numerical reference for the strength and direction of price movement? Then, the Daily Percentage and Current Candle indicator is the tool you need. The Daily Percentage and Current Candle indicator shows you the percentage increase or decrease of an asset in the current day or in the last candle, depending on the timeframe you choose. The indicator allows
FREE
Candle Inside
Yuriy Vins
5 (1)
Candle Inside indicator - draws Japanese candlesticks of a higher timeframe on the chart. Now, after loading the indicator, it is possible to see what is happening inside each candle. In addition to the standard buttons for selecting the timeframe in the MT-4 terminal, additional buttons are added, when clicked, an older period is selected to display Japanese candles or zones. For example, if you select the standard period M1 and the period of the indicator M5, then the chart will display minute
Pokilopers
Andrey Kozak
Pokilopers - the finished trading system is presented as an indicator for the Metatrader4 platform. When added to a chart, Pokilopers automatically analyzes the situation on the market, determines the direction of the trend, resistance points, the price movement channel and other market factors that affect the current and future price movements. After that, Pokilopers automatically determines the most effective point for opening a trade and gives the trader a signal in the form of an arrow. Afte
ToolBox 360 is the swiss knife of all indicators. It is full packed with useful tools to help you with your trading. It can be used to find best entry and exit points and help you to decide if you should open a trade or not. It shows market trends, candlestick formations outside / inside bars and you can sett time based allerts. Main features: Time based Fibonacci lines Choose a start and end time and the indicator shows you Fibonacci lines within the selected time range including range high
Pips Average Range
Francesco Petralla
1 (1)
This indicator compares the pips of the current day with the average of pips made in the previous three days. The "Percentage today range" is red if today's figure is less than the range of the previous three days, but turns green when the percentage exceeds 100%. When the range exceeds 100% there are good trading opportunities because we are in the presence of increased volatility of the past three days. Best use with Banks Day Levels indicator. Parameters settings corner (indicator display p
Oscillator helps determine the direction of the market Shows the direction of the price movement and is painted in the appropriate color. Allows you to conduct trend and counter trend trading It works on all timeframes, on any currency pairs, metals and cryptocurrency Can be used when working with binary options Distinctive features Does not redraw; Simple and clear settings; It works on all timeframes and on all symbols; Suitable for trading currencies, metals, options and cryptocurrency (Bitco
FREE
GoldTrend MT4
Sopany Zemmy
5 (1)
GoldTrend MT4 - is  a leading indicator for Gold on MetaTrader 4 - In Update version has been added new ability on USD pairs     ( AUDUSD, EURUSD, GBPUSD, NZDUSD, USDCAD, USDCHF, USDJPY ) - very easy to use , even for beginners - Stoploss and Take Profit provided - no repaint, no redraw and no lagging  When you decide to enter the global market ,  then there is a technical skill you absolutely must have, - which is all about trends . Why - GoldTrend is different from others : Not onl
配备胜率计算系统的指标 【指标特点】 该指标可以让您通过信号标志直观、清晰地确认正常的技术分析。 此外,它还具有自动胜率确定系统,可以检查当前参数是否合适,并避免在胜率较低时发出信号。 这减少了不必要的入场,并允许您仅在胜率较高时进行交易。 【重要说明】 ・不可重新涂装。 可使用从 1 分钟到每周的图表。 ・无货币限制。 适用于所有货币对。 ・计算胜率的能力。 ・仅当达到预定胜率或更高时才会产生信号。 ・优化减轻负载! 适合长期操作和9种货币对同时使用。 ・作为众所周知的指标,它允许在跟踪信号的同时进行学习。 ・调试器已支持并验证调试以解决任何问题。 【价格范围标志说明】 PRICE RANGE是显示价格范围的指标,即价格的上限和下限。 它由 Evesense 开发,根据某些价格变动提供指示“何时出售”和“何时购买”的箭头符号。 它以简单而有效的方式根据历史数据计算“平均值”,非常适合 1 分钟和 5 分钟图表。 它也是一种多功能工具,能够处理突然的市场变化和意外的新闻。 【指标亮点】 ・在波动和快速变化的市场条件下表现强劲。 ・不适合持续波动的市场。 【入场信号
Gold Buster M1 System - 是 XAUUSD 货币对 M1 图表的专业交易系统。但是,尽管该系统最初是专门为交易黄金而开发的,但该系统也可以与其他一些货币对一起使用。购买后,我会给你一个除了XAUUSD之外,可以和系统一起使用的交易对列表,这将扩大你使用这个系统的可能性 系统中的所有指标都不会重复! 该系统是一组三个指标。它是一个趋势指标、箭头指标和成交量指标,直观地显示了市场的强弱。 购买后,您可以立即下载趋势指标。我将免费为您提供剩余的两个指标,因为它们是整个系统的一部分。我还将为您提供一个模板,您可以使用该模板在图表上加载指标。此外,我将教你如何使用我的系统进行交易并分享我的建议。还有丰厚的红利等着你! 购买后请务必立即写信给我!
DSZ Smart ATR
Dariusz Szewczyk
5 (3)
DSZ Smart ATR indicator displays the current and future values of the True Range . Indicator analyzes volatility statistically and create Average True Range distribution over day. Unique future is that time frame of indicator can be set freely from main window allowing to have different perspective. Bars are red if values are below average and green when above. Benefits Gives true value of ATR filtered from data from non regular trading time. Indicates significant candles when they exceed expe
Black series MT4
Dmitriy Kashevich
1 (1)
Black series MT4 - The indicator is designed for trading on binary options with Timeframe M1-M5-M15 Multicurrency (Works on cryptocurrency and currency pairs) The signal appears when the candle opens Up to 90% correct signals There is no signal redrawing at all Can be used with other indicators. Good for scalping! In Settings there is: -Indicator working methods -I Allert Arrow color Red signal down Blue signal up Also watch the video how the indicator works and signals
The Navigator Trend is an interesting indicator very easy to use. Apply this indicator on the chart to navigate very quickly through all the symbols and timeframes listed in inputs. In addition it includes a trend condition that will alert you with a color about the direction and the market trend. Use it in confluent way to get very good operating ideas. You can customize both the graphic colors and the list of symbols to display. A quick and easy tool that it will help to analyse the charts. In
**MT4的突破盒指标 - 发掘高效的交易机会** 亲爱的交易者们,您好, 我们非常高兴向您介绍突破盒指标版本2.0 - 这是由KPRO创建的强大而准确的交易工具。这是一个宝贵的资产,可帮助您捕捉外汇市场中的交易机会,优化您的利润并同时降低风险。 **主要特点:** 1. **高效的突破交易:** 突破盒指标专门设计用于识别图表上关键的突破点。这使您能够捕捉强劲的价格波动并抓住最佳的交易机会。 2. **不重绘信号:** 该指标的一个独特特点是其不重绘信号能力。这确保您可以依赖指标提供的买入和卖出信号,为您的交易决策创造可信的基础。 3. **多时间框架(MTF)和集成EMA:** 通过多时间框架的能力,您可以利用来自不同时间框架的信息做出更明智的交易决策。该指标还集成了EMA线,帮助您高效地识别市场趋势。 4. **灵活的设置:** 突破盒指标提供了可定制的参数,以匹配您的交易风格和策略。您可以调整突破时间周期、偏移、颜色等等因素。 5. **警报和通知:** 该指标通过MT4平台支持警报和通知功能,确保您不会错过任何重要的交易机会。 **使用方
Fibo Panda is an indicator that can help you predict the end of daily trends. If the daily price has reached the END L4 or END H4, means the Daily volume is enough. If the daily price has reached the Highest or Lowest, means the price has reached the highest or lowest level. Price must touch the End Hi or End Low Level to complete the price movement of each timeframe. A conclusion can be made whether to buy or sell. If the price is in the High Guard and Low Guard areas it means the price is now
Fibo Reversals
Adeniyi Adedipe
Fibo Reversals is an indicator which has carefully been put together to attempt to indicate a time period in which an ongoing trend is most probably exhausted and a new trend (actually a reversal trend) inadvertently begins. At this, it should be okay for the manual trader to be on the look out for good trading opportunities. Input Settings Father Fibo  – This Input Determines The Highest Price For The Chosen Input Period. Son Fibo  - This Input Determines The Lowest Price For The Chosen Input
Stochastic Alert Manager   Introduction: The Stochastic Alert Manager is a customizable indicator used to send alerts when trading signals occur. It also gives the user an overall idea of the tendency in all timeframes through a panel, to keep an eye on the global market behaviour. It is based on the stochastic crossovers strategy. The Stochastic Alert Manager is not meant to open trades for now. - Simple - Configurable - Respond quickly - Monitor the global behaviour   How is it working? -  It
Asterysc SL & TP Values Info, is an indicator which will allow you to see on the chart in a visual way the potential profit/loss you could have if your trade touches TP or SL. It will also allow you to see the total accumulated TP/SL of all open trades in a very simple way on each chart. You will also be able to quickly visualize the current Drawdown of your account. *The indicator is customizable, so you can change the colors, size and fonts of each section.
Buy Sell Magic
Sergey Bocharov
Trend reversal indicator, no repainting. Clean and light rendering There is no alternative buy-sell signal without taking into account the trend. Noise filtering capability. Works with all pairs. Ideal for beginners and experienced traders It is best used on timeframes above the M30, from the beginning of the London session to America. It should be remembered that there are no indicators that are not wrong. Any strategy requires confirmation of its signals. When building your own system, it
RadarPriceAction
Roman Lipatov
4.33 (6)
This panel is designed for quick visual search for the price action patterns on several instruments simultaneously. It is possible to add and remove instruments. Clicking the signal button allows you to quickly move to the chart with the identified pattern and timeframe. The panel searches for 8 candlestick patterns: PIN-BAR, EXTERNAL BAR, INSIDE BAR, DOJI, LEVEL, HIGH/LOW OF N BAR, FAKEY, ONE-WAY N BAR. Any of the patterns can be disabled by clicking its title. It can also search in history (by
This indicator makes objects(HLine,VLine,etc.) invisible in chosen  timeframes. Objects to be invisible are determined by color. If you delete this indicator from the chart,the vanished  object will be visible again. This indicator is especially useful for trader that utilize a lot of lines. Vanishable Object:HLine,VLine,ChannnelLine,LABEL,TEXT,arrow. *In strategy tester,you can't change timeframe.Use template in order to know full ability of this indicator. *There is a free version. In
Market Dashboard
Christian Opperskalski
Market Dashboard Indicator gives you advanced information’s about your selected Symbols in MarketWatch Daily Price Movements (M1 – D1) RSI Values with Highlight Function for your current Timeframe & H1 & H4 Profit per Symbol and traded lots (buy & sell) EMA 5 – 100 based on selected period Swap Information (which direction is positive) FIBO Info & Tracking (highlighted FIBO Levels close to current price – based on selected period) One Click ChartOpen   Important: Get informed about new Product
Индикатор виртуального эквити, представляемый здесь, может работать по нескольким символам одновременно. Для каждого символа задается направление ( Buy/Sell ) и размер позиции. В настройках также указывается размер предполагаемого депозита, дата открытия и закрытия позиции.   На графике при этом устанавливаются вертикальные линии, обозначающие указываемые в настройках даты.  После установки индикатора на график, можно изменять время открытия и закрытия позиции, передвигая эти линии.   Да
H4 candles on the lower timeframes indicator allows the user to display the four hour timeframe on the lower timeframe chart. The indicator shows the closed H4 candles on the chart. It does not show the last unclosed H4 candle. You can position and color the candles with or without price labels (High/Low/Open/Close of the four hour period) and High/Low lines. It can help to see the bigger picture if you are a day trader or scalper. The most efficient way to use on the M5 and M15 charts, but you
Supply and Demand Monster MT4
Tsog Erdene Borjigon Enkhkhudulmur
Supply and demand zones are at the heart of   supply and demand trading . These zones are areas that show  liquidity at a specific price.  The supply zone is also called the distribution zone, while the demand zone is called the accumulation zone.   Our indicator automatically draw supply and demand zones in Metatrader 5. It give opportunity to understand trading zone and avoiding risk.
Turtle fast movement
Abdallah Moustafa Hamdy Ahm Abdelrazek
This trend following system was designed by   Dennis Gartman   and   Bill Eckhart , and relies on breakouts of historical highs and lows to take and close trades: it is the complete opposite to the "buy low and sell high" approach. This trend following system was taught to a group of average and normal individuals, and almost everyone turned into a profitable trader. The main rule is   "Trade an N-day breakout and take profits when an M-day high or low is breached (N must me above M)" . Exampl
IDNR4 and 7 28 Pairs Radar
Francesco Petralla
5 (1)
This indicator detects IDRN4 and IDNR7 two powerful patterns on 28 pairs on new daily bar. IDNR4 is the acronym for "Inside Day Narrow Range 4" where "Inside Day" is a lower high and higher low than the previous bar and "Narrow Range 4" is a bar with the narrowest range out of the last 4 bars so "Narrow Range 7" out of the last 7 bars. Hence, ID/NR4 and better ID/NR7 are an objective criterion for identifying days of decreased range and volatility. Once we find an ID/NR4 or an ID/NR7 pattern, we
该产品的买家也购买
Advanced Currency Strength28 Indicator
Bernhard Schweigert
4.9 (663)
目前26%的折扣 任何新手或专家交易者的最佳解决方案! 这个指标是一个独特的、高质量的、可负担得起的交易工具,因为我们纳入了一些专有的功能和一个新的公式。只需一个图表,你就可以读出28个外汇对的货币强度!想象一下,你的交易将如何得到改善,因为你的交易是在你的手中进行的。想象一下,你的交易将如何改善,因为你能够准确地确定新趋势或剥头皮机会的触发点? 用户手册:点击这里  https://www.mql5.com/en/blogs/post/697384 这是第一本,原版的! 不要买一个毫无价值的崇拜者的克隆品。 特别的 子窗口中的箭头显示强劲的货币势头GAP将指导你的交易! 当基础货币或报价货币处于超卖/超买区域(外盘斐波那契水平)时,在个人图表的主窗口中出现警告信号。 当货币力量从外围区间回落时,回撤/反转警报。 十字星模式的特别警报 可选择多个时间框架,以快速查看趋势! 货币强度线在所有的时间框架中都非常平稳,当使用较高的时间框架来识别总体趋势,然后使用较短的时间框架来确定精确的入口时,效果非常好。你可以根据自己的意愿选择任何时间框架。每个时间框架都由其自身进
Atomic Analyst
Issam Kassas
5 (3)
首先值得强调的是,该交易指标是非重绘、非延迟的指标,这使其成为手动和机器人交易的理想选择。 用户手册:设置、输入和策略。 Atomic Analyst是一种PA价格行动指标,利用价格的力量和动量来寻找市场上更好的机会。配备了高级过滤器,可帮助去除噪音和假信号,并提高交易潜力。使用多层复杂的指标,Atomic Analyst扫描图表,并将复杂的数学计算转化为任何初学者都能理解并用来做出一致交易决策的简单信号和颜色。 “Atomic Analyst”是专为新手和经验丰富的交易者量身定制的综合交易解决方案。它将高级指标和一流功能融合为一体的交易策略,使其成为所有类型交易者的多功能选择。 日内交易和剥头皮策略:专为快速准确的日内交易和短期交易而设计。 日内和摆动交易策略:可用作追求价格大幅波动的日内和摆动交易者的可靠工具。 多货币和市场:凭借其可靠的精度,在不同的工具和市场上运作。 多个时间框架:可在多个时间框架上使用,性能良好。 稳定性:所有指标均不重绘、不重绘和不滞后,确保可靠的信号。 信号清晰度:提供箭头信号,用于清晰的入场和出场点。 实时警报:通过交易入场、SL和TP警报通知交
TPSpro RFI Levels
Roman Podpora
4.87 (15)
Reversal First Impulse levels (RFI)    INSTRUCTIONS        RUS       -       ENG              R ecommended to use with an indicator   -   TREND PRO -  Version MT5 A key element in trading is zones or levels from which decisions to buy or sell a trading instrument are made. Despite attempts by major players to conceal their presence in the market, they inevitably leave traces. Our task was to learn how to identify these traces and interpret them correctly. Main functions: Displaying active zones
Scalper Inside PRO
Alexey Minkov
4.75 (57)
An exclusive indicator that utilizes an innovative algorithm to swiftly and accurately determine the market trend. The indicator automatically calculates opening, closing, and profit levels, providing detailed trading statistics. With these features, you can choose the most appropriate trading instrument for the current market conditions. Additionally, you can easily integrate your own arrow indicators into Scalper Inside Pro to quickly evaluate their statistics and profitability. Scalper Inside
TrendMaestro
Stefano Frisetti
5 (2)
note: this indicator is for METATRADER4, if you want the version for METATRADER5 this is the link:  https://www.mql5.com/it/market/product/108106 TRENDMAESTRO ver 2.4 TRENDMAESTRO recognizes a new TREND in the bud, he never makes mistakes. The certainty of identifying a new TREND is priceless. DESCRIPTION TRENDMAESTRO identifies a new TREND in the bud, this indicator examines the volatility, volumes and momentum to identify the moment in which there is an explosion of one or more of these data a
Advanced Supply Demand
Bernhard Schweigert
4.92 (311)
现在优惠 33%! 任何新手或专业交易者的最佳解决方案! 该指标是一款独特、高质量、且价格合理的交易工具,因为我们已经整合了许多专有功能和新公式。 依据此更新,您将能够显示双重时间帧区域。 您不仅可以显示一个较高的时间帧,还可以同时显示图表时间帧,加上更高的时间帧:显示嵌套时区。 供需双方所有交易者都会喜欢它。 :) 重要信息披露 高级供需的最大潜力,请访问 https://www.mql5.com/zh/blogs/post/720245   想象您的交易如何得以改善,是因为您能够精准定位入场或目标位吗? 构建于新的底层算法,它可以更轻松地识别出买卖双方之间的潜在失衡。 这是因为它以图形方式展示供需最强劲区域,及其过去的表现(显示旧区域)。 这些功能旨在帮助您更轻松地发现最佳入场区域和价位。 现在您可以针对您的交易品种和时间帧来优化和编辑区域强度! 高级供需指标适用于所有产品和时间帧。 它是一个新的公式,非常新的功能是两个区域强度函数可由用户输入进行调整! 这在交易中是一大优势。 当您学习如何使用专有功能,例如带有价格游离最小 X 因子的区域强度时,您能够判断该区域强劲与否。 供
TPSproTREND PrO
Roman Podpora
4.78 (18)
TPSpro TRENDPRO  - is a trend indicator that automatically analyzes the market and provides information about the trend and each of its changes, as well as giving signals for entering trades without redrawing! The indicator uses each candle, analyzing them separately. referring to different impulses - up or down impulse. Exact entry points into transactions for currencies, crypto, metals, stocks, indices!  -  Version MT5               DETAILED DESCRIPTION                R ecommended to use with
目前八折优惠! 对任何新手或专家交易者来说都是最好的解决方案! 这个仪表板软件适用于28种货币对。它基于我们的两个主要指标(高级货币强度28和高级货币冲动)。它对整个外汇市场提供了一个伟大的概述。它显示高级货币强度值,货币运动速度和28个外汇对在所有(9)时间段的信号。想象一下,当你可以使用图表上的单一指标观察整个市场,以确定趋势和或剥头皮的机会时,你的交易将得到改善 我们已经在这个指标中建立了一些功能,使你更容易识别强势和弱势货币,同时识别和确认潜在的交易。该指标以图形方式显示货币的强势或弱势是增加还是减少,以及它在所有时间段的表现。 增加的新功能是动态市场斐波那契水平,它适应当前的市场条件变化,这是一个已经在我们的高级货币强度28和高级货币冲动指标中使用的成熟的加分项。 在交易时,总是将弱势货币和强势货币配对,这个新指标将帮助你做到这一点。 用户手册:点击这里  https://www.mql5.com/en/blogs/post/708783 特点  显示每个时间段的ACS28和GAP-speed(冲动)的货币强度值。 列:颜色代码以7种颜色
ON Trade Optuma Astro
Abdullah Alrai
5 (4)
当然可以!以下是您提供的文本的中文翻译: 引入 MT4 天文指标:您的终极天体交易伙伴 您准备好将交易体验提升到天文高度了吗?不用再寻找,就在我们的革命性 MT4 天文指标中。这个创新工具超越了传统的交易指标,利用复杂的算法提供无与伦比的天文洞察力和精确计算。 指尖上的宇宙信息: 瞻仰一个详尽的面板,展示了一宝藏般的天文数据。了解行星的地理/太阳心坐标,太阳/地球距离,亮度,伸长度,星座,黄道和赤道坐标,甚至是水平坐标——每个细节都经过精心计算并呈现得美轮美奂。指标生成的垂直线对应于时间值,为您的交易旅程提供了宇宙的视角。 行星线条与关系: 在您的图表上欣赏行星线条的魔力,具有可自定义的比例和角度。通过直观的控制面板轻松切换每个行星线条的可见性。通过连结、六分、四分、三分、对冲和逆行等指标,发现行星关系的艺术。在您选择的时间范围内探索这些宇宙构造,使您能够识别重要的交易机会。 揭示甘恩的智慧: 通过受甘恩启发的平方垂直线揭示潜在的反转时机。这种创新修改将甘恩历经考验的原则带入现实,帮助您提前了解市场的转向和趋势。 月亮引导: 在您的图表上优雅地导航月相,因为新月和满月点缀其间。月亮周期
FX Volume
Daniel Stein
4.6 (35)
通过 mql5 和 Telegram 上 的 " 晨间简报 "获取每日市场更新,包括详细信息和屏幕截图 ! 外汇交易量(FX Volume)是第一个也是唯一一个从经纪商角度真正洞察市场情绪的交易量指标。 直接在您的图表上看到这些信息是真正改变游戏规则和突破性的交易解决方案。 受益于独特的市场数据洞察,如 比率(Ratios )显示货币多头和空头头寸的比率(百分比 比率变化 显示所选时间段内的多头比率及其百分比变化 总交易量 显示货币的总交易量(多头和空头),以手为单位 多头 交易量显示货币所有多头头寸的交易量 空头 交易量显示所有货币空头头寸的交易量 净多头 显示净多头交易量,即所有多头头寸减去所有空头头寸(以手为单位)。 净多头百分比 显示货币净多头交易量的变化 请阅读我们的基本教程 -> "如何使用外汇交易量进行交易 " 获取更多信息,如常见问题、交易技巧和教程视频,请访问我们的 外汇交易量公共信息频道 请 安装并运行 SI Connect 以建立与我们数据中心的持续连接 背景信息 我们都知道,外汇是一个分散的市场。这就是为什么我们必须打破常规思维,开发一个独
The indicator of a Professional Trader is an arrow indicator for predicting the direction of price movement. I have been working on this indicator since 2014. You can use this indicator as your main indicator, use its entry signals, and use it as your only indicator to find entry points. About the product: Recommended TF [H4-D1-W1]   . The indicator predicts the direction of the next candle. Fits a variety of tools; Flexibility in settings for different instruments and intervals through the
Dragon Multi Indicator MT4
Mansour Babasafary
5 (4)
74% discount for the next 10 buyers (original price $605): 1 left Get a 50% bonus by buying (or even renting) any of our products. After buying (or renting), send a message for more information. 3 Indicators in 1 indicator Strategy based on price action Made specifically for the best forex currency pairs Can be used in the best time frame of the market at a very reasonable price This indicator is basically 3 different indicatos . But we have combined these 3 indicators in 1 indicator so th
Quantum Trend Sniper Indicator MT4
Bogdan Ion Puscasu
4.6 (40)
介绍   量子趋势狙击指标 ,突破性的 MQL5 指标,正在改变您识别和交易趋势反转的方式!由拥有超过13年交易经验的资深交易员团队开发,     量子趋势狙击指标   旨在通过其创新的方式以极高的准确度识别趋势反转,将您的交易之旅推向新的高度。 ***购买量子趋势狙击指标,即可免费获得量子突破指标!*** 当量子突破指标识别出趋势反转时,它会向您发出警报和信号箭头,并建议您三个止盈水平。 它既适合新手交易者,也适合专业交易者。 量子 EA 通道:       点击这里 MT5版本:       点击这里 建议: 时间范围:  所有时间范围。为了获得最佳结果,我们建议在 M15、M30 和 H1 时间范围内使用它。 货币对:欧元兑美元、英镑兑美元、澳元兑美元、欧元兑英镑, EURAUD, XAUUSD 账户类型:ECN、Raw 或 Razor,点差极低 经纪时间:任意 经纪商:IC Markets、Pepperstone with Raw 和 Razor 的点差最低 建议止损:50 点 建议止盈水平:20 点、50 点和 1
TakePropips Donchian Trend Pro
Eric John Pajarillaga Aldana
4.82 (17)
TakePropips Donchian Trend Pro   (MT4) 是一款功能强大且有效的工具,可使用 Donchian 通道自动检测趋势方向,并为您提供进场和退场交易信号! 这个多功能指标包括趋势扫描器、交易信号、统计面板、筛选器、交易时段和警报历史仪表板。它旨在为您提供交易信号并节省您分析图表的时间! 您可以在我们的博文中下载用户手册和安装指南:   https   :// www.mql5.com/en/blogs/post/751368 今天立减 50%!价格从 98 美元降到 49 美元! 您可以在 Strategy Tester 上测试该指标(启用可视模式) 视频教程也可在说明下方获得更多详细信息。 如果您有任何问题或需要任何帮助,请与我联系。 TakePropips Donchian Trend Pro 指标适用于所有外汇对、金属、商品、指数和加密货币。 主要特点 交易信号 - 检测多个时间范围内所有货币对的买卖机会。它将为您提供警报并在图表上绘制交易信号,最多 3 个止盈价和一个止损价。 Trend Scanner   - 用于快速扫描和识别跨多个时间
FX Power MT4 NG
Daniel Stein
5 (10)
通过 mql5 和 Telegram 上 的晨间简报获取每日市场更新,包括详细信息和屏幕截图 ! FX Power MT4 NG 是我们长期以来非常受欢迎的货币强度计算器 FX Power 的下一代产品。 这款下一代强度计算器能提供什么?您所喜爱的原版 FX Power 的所有功能 附加功能 黄金/XAU 强度分析 更精确的计算结果 可单独配置的分析周期 可自定义计算限制,以获得更好的性能 为希望查看更多信息的用户提供特殊的多实例设置 无尽的图形设置,可在每个图表中设置您最喜欢的颜色 无数的通知选项,让您再也不会错过任何重要信息 采用 Windows 11 和 macOS 风格的全新圆角设计 神奇的移动指标面板 FX Power 主要功能 所有主要货币的完整强势历史 所有时间框架内的货币强弱历史 所有经纪商和图表的计算结果完全相同 100% 可靠的实时计算 -> 无重绘 可通过下拉列表选择分析时段 通过自定义模式单独配置分析时段 可在一个图表中使用多个实例 可移动 FX Power 显示屏(通过拖放) 适用于高分辨率 QHD、UHD 和 4K 显示器 自动终端配置 针对平板电脑
Quantum Breakout Indicator PRO
Bogdan Ion Puscasu
4.96 (26)
介绍     Quantum Breakout PRO   ,突破性的 MQL5 指标,正在改变您交易突破区域的方式!   Quantum Breakout PRO 由拥有超过 13 年交易经验的经验丰富的交易者团队开发,旨在通过其创新和动态的突破区域策略将您的交易之旅推向新的高度。 量子突破指标将为您提供带有 5 个利润目标区域的突破区域的信号箭头,以及基于突破框的止损建议。 它既适合新手交易者,也适合专业交易者。 量子 EA 通道:       点击这里 MT5版本:   点击这里 重要的!购买后请私信我领取安装手册。 建议: 时间范围:M15 货币对:GBPJPY、EURJPY、USDJPY、NZDUSD、XAUUSD 账户类型:ECN、Raw 或 Razor,点差极低 经纪商时间:GMT +3 经纪商:IC Markets、Pepperstone with Raw 和 Razor 的点差最低 规格: 不重漆! 最多 5 个建议利润目标区域 建议止损水平 可定制的盒子。您可以设置自己的 Box Time Start 和 Box Time E
Wolfe Wave Scanner
Jalitha K Johny
5 (2)
Wolfe Waves scanner - It scans all the Symbols and identify the movement of price and it gives confidence in trade. It automatically plots  fifth wave breaks out of the channel. According to the theory behind the pattern, a line drawn from the point at the beginning of the first wave and passing through the beginning of the fourth wave predicts a target price for the end of the fifth wave. If a trader properly identifies a Wolfe Wave as it forms, the beginning of the fifth wave represents an op
Nasdaq100 Power Indicator
Teboho Edgar Rakotsoane
5 (4)
The NASDAQ 100 Power Indicator serves with TREND and trend reversals indication using automated arrows that indicates buy or sell at that price and has built-in signal provider across all time frames with alerts and provides also the automated support and resistance that can draw technical analysis patterns like double bottom, double top, head and shoulders etc. using closing and open prices, in assistance for if a trader did not see the pattern sooner for their technical analysis. The indicator
XQ Indicator MetaTrader 4
Marzena Maria Szmit
3 (2)
Step into the realm of Forex trading with confidence and precision using XQ, a cutting-edge Forex indicator designed to elevate your trading game to unprecedented heights. Whether you're a seasoned trader or just stepping into the world of currency exchange,   XQ Forex Indicator   empowers you with the insights and signals needed to make informed trading decisions. The signal conditions are a combination of three indicators, and XQ Forex Indicator only display  medium and long-term trends . The
Cycle Sniper
Elmira Memish
4.39 (36)
NEW YEAR SALE PRICE FOR LIMITED TIME!!! Please contact us after your purchase and we will send you the complimentary indicators to complete the system Cycle Sniper is not a holy grail but when you use it in a system which is explained in the videos, you will feel the difference. If you are not willing to focus on the charts designed with Cycle Sniper and other free tools we provide, we recommend not buying this indicator. We recommend watching the videos about the indiactor and system before pu
PZ Turning Points MT4
PZ TRADING SLU
1 (1)
该指标检查不同时期分形的价格结构,以确定市场中可能的反转点,从而为已经具有基本或技术估值模型的仓位交易者提供时机。与它的弟弟 Reversal Fractals不同 ,该指标不会因为所选时期而错过反转,并且会以之字形方式找到反转分形,而忽略那些没有足够动量来引发持续价格波动的反转。 [ 安装指南 | 更新指南 | 故障排除 | 常见问题 | 所有产品 ] 转折点可以开始长期趋势 指示器不重涂 它实现了各种警报 可自定义的颜色和尺寸 该指示符是无功或滞后信号,因为分形是奇数个条形的地层,是中间地带中最高或最低的条形,并且指示符在分形中的所有条形都闭合时绘制。但是,具有预先设定的方向偏差的交易者会发现该指标非常有用,可以提早进入切入点。 该指标既不是下探信号指标,也不是完整的交易系统。请不要这样评价或审查它。 输入参数 最小分形数:分形上的最小条形数。必须为奇数,例如3、5、7、9、11、13,... 最大分形:分形上的最大条形数量。必须为奇数,例如3、5、7、9、11、13 ... 最大历史柱数:指标加载时评估的过去柱数。 颜色:自定义箭头和线条的颜色和大小。 警报:启用
Introduction to Fractal Pattern Scanner Fractal Indicator refers to the technical indicator that makes use of the fractal geometry found in the financial market. Fractal Pattern Scanner is the advanced Fractal Indicator that brings the latest trading technology after the extensive research and development work in the fractal geometry in the financial market. The most important feature in Fractal Pattern Scanner is the ability to measure the turning point probability as well as the trend probabi
CyberZingFx Trend Reversal
Afsal Meerankutty
4.26 (19)
Indicator captures the trend reversals with no-repaint Buy and Sell Arrow signals. CyberZingFx Trend Reversal Indicator - your go-to solution for accurate and reliable trend reversal signals. With its  advanced trading strategy , the indicator offers you Buy and Sell Arrow signals that do not repaint, making it a reliable tool for catching Swing Highs and Swing Lows in any market and any time frame. Indicator works on  any market  and  any time frames . __________________________________________
介绍 ON Trade Waves Patterns Harmonic Elliot Wolfe,这是一款高级指标,旨在使用手动和自动方法检测各种市场模式。以下是它的工作原理: 谐波模式: 该指标可以识别出现在您图表上的谐波模式。这些模式对于练习谐波交易理论的交易者非常重要,正如Scott Carney的书《谐波交易第1卷和第2卷》所描述的那样。无论您是手动绘制它们还是依赖自动检测,ON Trade Waves Patterns都可以胜任。 控制面板: 我们配备了一个用户友好的控制面板,它会保存您的图表和时间帧设置,使您可以轻松切换不同配置。您甚至可以最小化它以最大化图表空间。如果您更喜欢使用其他分析工具,只需单击关闭按钮即可隐藏所有指标数据。 模板保存: 当您自定义设置或添加其他指标,如移动平均线或布林带时,该指标会自动保存您的模板。这意味着您可以随时轻松加载您喜欢的设置。 优化显示: 对于Windows 10用户,我们建议调整您的DPI设置以获得高清设备上的最佳屏幕体验。右键单击MetaTrader图标,选择“兼容性”,然后选择“更改高DPI设置”,将其设置为“系统(增强)”。
Shepherd Harmonic Pattern
Abdullah Alrai
4.68 (59)
这个指标将检测手动和自动方法在图表上绘制的谐波模式。 您可以从此链接查看用户手册: 添加您的评论并联系我们以获得它 有一个免费版本可以在mt4上尝试此产品。 您可以使用它来检测Gartley和Nenstar模式: https://www.mql5.com/en/market/product/30181 您可以从以下链接购买完整的MT4版本: https://www.mql5.com/en/market/product/15212 注意 指标具有控制面板,并将保存每个(图表和时间框架)设置。 您可以将其最小化以在图表上获得更多空间,并且如果您更喜欢使用其他分析工具,则可以按关闭按钮隐藏所有指标数据 当您使用此指标并更改设置,添加诸如移动平均线或布林带之类的指标时,此指标将自动保存您的模板编辑,并且您可以随时加载它们。 如果您使用的是Windows 10,请右键单击MetaTrader图标>兼容性>更改高DPI设置>系统(增强)以获得最佳屏幕设置(应在高清设备中完成)。 指标只是谐波交易理论的解释,用于检测图表上的谐波模式。 如果您想学习它,可以搜索Scott Carney的书,名为“Ha
All in One Trade
Alexey Minkov
4.48 (27)
The All-in-One Trade Indicator (AOTI) determines daily targets for EURUSD, EURJPY, GBPUSD, USDCHF, EURGBP, EURCAD, EURAUD, AUDJPY, GBPAUD, GBPCAD, GBPCHF, GBPJPY, AUDUSD, and USDJPY. All other modules work with any trading instruments. The indicator includes various features, such as Double Channel trend direction, Price channel, MA Bands, Fibo levels, Climax Bar detection, and others. The AOTI indicator is based on several trading strategies, and created to simplify market analysis. All-in-One
WARNING!! THIS SWORD IS TOO SHARP!    ONLY 10 COPIES LEFT FOR THE NEXT PRICE TO BE 8,000$ FOR UNLIMITED PLAN. Dear traders I am very glad once again to introduce to you my other tool called "Forex Sword Indicator". In short this tool is meant to give you an edge over the market that you have been waiting for  so long. Now, here it is. It is a very very simple tool but yet a dangerous sword. I call it a  Holy grail indicator!. I will not talk a lot about this tool. Just let the tool speak by itse
GOLD Impulse with Alert
Bernhard Schweigert
4.56 (9)
这个指标是我们2个产品 Advanced Currency IMPULSE with ALERT  +   Currency Strength Exotics 的一个超级组合。 它适用于所有时间框架,并以图形方式显示8种主要货币和一种符号的强势或弱势冲动! 该指标专门用于显示任何符号的货币强度加速,如黄金、异国货币对、商品、指数或期货。这是它的第一个指标,任何符号都可以被添加到第9行,以显示黄金、白银、石油、DAX、US30、MXN、TRY、CNH等的真实货币强度加速(冲动或速度)。 建立在新的基础算法上,它使识别和确认潜在的交易更加容易。这是因为它以图形方式显示了一种货币的强势或弱势是否正在加速,并测量了这种加速的速度--把它想象成你汽车中的速度表。当你加速时,事情显然会发生得更快,这在外汇市场上也是一样的,即如果你配对的货币正在向相反的方向加速,你就会发现一个潜在的有利可图的交易。 动态市场斐波那契28水平被用作警报触发器,将适应市场活动。如果冲动击中黄色触发线,你将收到警报。然后你就知道作为一个交易员应该做什么。货币对和方向已经给出。只需点击警报按钮,就可以
Full STO
Roman Smoroda
完整的 STO 指标(包括三个 STO 指标的所有版本:高级版、黄金版、白银版) - STABLE TRADE OPTION 专为自动二元期权交易而设计。 请仔细阅读!!!!! 重要事项 在一个终端中创建两个不同到期时间的模板,一个为 18:01、18:02,到期时间为 1 至 15 分钟的模板,另一个为 22:00,到期时间为 10 至 20 分钟的模板。 胜率:过去 5 年为 71 资金管理:存款的 0.3 此版本的指标仅用于莫斯科时间 18:01、18:02、22:00 的交易,白银和黄金的到期时间为 1 至 15 分钟,高级版本的到期时间为 10 至 20 分钟。信号出现在蜡烛内部并立即打开交易,如果您使用连接器,则在蜡烛内部打开一个标记。 该指标配置齐全,您无需自行更改。安装并交易 请勿在未经任何检查和测试的情况下购买该指标,我花了两年多时间在真实账户上检查所有版本的sto并查看结果。经过多年测试,我们选择了最佳参数。 应用算法 1. 将指标安装到信号顾问中,信号顾问会自动向经纪商平台发送信号。 - mt2trading.
PZ Swing Trading
PZ TRADING SLU
5 (4)
Swing Trading 是第一个旨在检测趋势方向的波动和可能的反转波动的指标。它使用在交易文献中广泛描述的基准摆动交易方法。该指标研究多个价格和时间向量,以追踪总体趋势方向,并检测市场超卖或超买并准备好进行修正的情况。 [ 安装指南 | 更新指南 | 故障排除 | 常见问题 | 所有产品 ] 市场波动的利润不会被窃取 指示器始终显示趋势方向 彩色价格带代表机会基准 彩色虚线表示可能的反转波动 该指标分析其自身的质量和性能 它实现了一个多时间仪表板 可定制的趋势和波动周期 它实现了电子邮件/声音/推送警报 指示器为非重涂或重涂 什么是摇摆交易 摇摆交易是一种尝试在一天到一周内从证券中获得收益的交易方式,尽管某些交易最终可以保持更长的寿命。摇摆交易者使用技术分析来买入弱点和卖出力量,并有耐心等待这些机会的发生,因为在发生一波抛售浪潮之后购买证券而不是陷入抛售更有意义。 机会基准 关于历史数据的大量研究证明,适合于波动交易的市场倾向于在基线价格带上下交易,基线价格带由图表显示,使用平均真实区间计算得出。波动交易者使用基线,该策略是购买常态和卖出躁狂,或做空常态并掩盖沮丧。
作者的更多信息
The "Pyramids trend line" is a trading and a Filtering tool too, it is based on a combination of important indicators in one tool. We programmed a dashboard that helps you know the current direction for each time frame, to avoid wasting time searching for it. We also put a percentage of the trend to know its current strength (using all time frames). The advantages of this indicator: It is easy to know the trend in all time frame. It is easy to know the strength of the trend. It gives you th
King Kong
David Ayad
This indicator works periodically and continuously depends on the numbers only and some complex mathematical equations, will give you more than wonderful areas for sell and buy and middle line, which is for us the first goal and the second goal it’s other area . This indicator is easy to deal with and does not repaint itself that it is constant from the beginning of opening the market if it is daily, weekly or monthly This indicator gives you a very small stop loss for multiple and large Target
筛选:
无评论
回复评论