• 概述
  • 评论 (3)
  • 评论 (1)

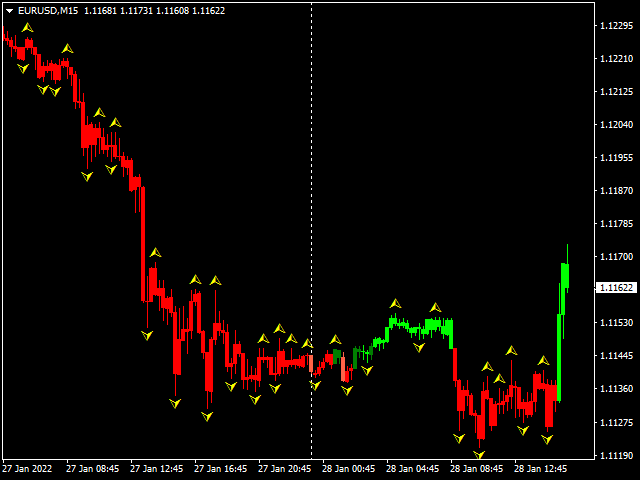
Trend direction colored

This indicator helps you to build position and profit when market turns in your favor. You will build your full position by trading many small position. If there is green colored candle on the chart, you could add long position. If there is red colored candle on the chart, you could add short position. I personally spread my full size position in to 5-10 small position. I use small target of 2-5 pips on eurusd pair.


推荐产品
I Permanent
Vladimir Gorbachev
Universal adaptable indicator. It determines the estimated trading range for the current day based on the available history a real data, and displays the area of the probable price rollback on the chart. All this thanks to the built-in algorithm that automatically adapts to any behavior models of the market quotes. With the parameters adjusted, the indicator shows its effectiveness on most of the currency pairs, that have a rollback from the reached extremums during the current or the next tradi
This indicator will display current logined mt4 account's orders information of current symbol chart. It also allow import some formated data: 1) MQL5 Signals History CSV file (*.csv) 2) MT4 Account History Statement file (*.htm -> *.txt) *[Next Version] Allow Import data form 'HF HistoryExporter (*.csv)' Sample Data of MQL5 Signals History File Time;Type;Volume;Symbol;Price;S/L;T/P;Time;Price;Commission;Swap;Profit;Comment 2023.12.20 23:00:02;Buy Limit;0.06;EURUSD;1.08994;1.06024;1.09464;2
A   rocket   (from   Italian :   rocchetto ,   lit. 'bobbin/spool') [nb 1] [1]   is a   projectile   that   spacecraft ,   aircraft   or other   vehicles   use to obtain   thrust   from a   rocket engine . Rocket engine exhaust is formed entirely from   propellant   carried within the rocket. [2]   Rocket engines work by   action and reaction   and push rockets forward simply by expelling their exhaust in the opposite direction at high speed, and can therefore work in the   vacuum   of space. In
Top Gun Oscillators
Safwan Rushdi Khalil Arekat
5 (3)
Note : New in 1.6: the indicator now exports the trade signal (but not displayed). Go long with light blue. Go short with red. Exit otherwise. Signal to be imported to your EA using iCustom. This indicator provides Best of the Best linear filter momentum oscillators that I am aware of (Low Pass Differentiators, LPD's) . All of them are  recent developments by this developer, or other researchers. The oscillator line is the first buffer of the indicator, and can be called  in other indicators or
FREE
MT4 外汇指标 HTF MACD 振荡器 HTF 意味着 - 更高的时间范围 MACD指标本身是趋势交易最流行的指标之一 该指标非常适合具有价格行为条目或与其他指标结合使用的多时间框架交易系统 HTF MACD 指标允许您将较高时间范围的 MACD 附加到您当前的图表 --> 这是专业的交易方法 指示器内置移动和 PC 警报 ............................................................................................................ // 这里提供更多优秀的 EA 交易和指标: https://www.mql5.com/en/users/def1380/seller // 也欢迎您加入盈利、稳定、可靠的信号 https://www.mql5.com/en/signals/1887493 这是仅在该 MQL5 网站上提供的原创产品。
PM Redefine
Samuel Akinbowale
PM Redefine : Is Simply, Simple, Straight and Direct in opening orders and closing of orders; PM Redefine : Can be run in all type of instrument.{Forex, Commodity ,Stock, or Cryptocurrencies}. PM Redefine : Can be run in all type of TimeFrame,{M1,M5,M15,M30 , H60, H240, D, W, M}. PM Redefine : can be used for scalping and day trading. Input Parameters typeFrom_0_to_9: type in between 0 and 9 ; upper_levelAlert: if line cross this predefine level up , Arrow Buy show if : showArrow =true: lo
Ejike Currency Basket compiles and analyses foreign exchange currency strength and volatility dynamics for the 8 major currencies. Its data are formulated from market prices and volatility. ECB visually cross-references its own reports to generate high probability trade pairs, the build-up to which is interactive that the trader can easily assume the role of Analyst. Its 28-pair real time monitoring involves a constant comparison of its current to past data. On adjusting a parameter, it will cha
Breakeven line calculator MT4
Wafa Mohammed Omar Abou Alwafa
This indicator shows the breakeven line level for the total number of open positions of the current symbol with P/L value and total volume. This indicator is helpful to decide the exit level when using a trading grid strategy. The style of the breakeven line is customizable to choose the color, line shape and font size of the positions description. Send mobile notification when crossing a positive P/L target
FREE
Symbol Cost Info MT4
Opeyemi Fuad Anokwu
Introducing the   “Symbol Cost Info MT4”   indicator – your ultimate tool for staying ahead in the forex market! This innovative indicator is designed to empower traders with real-time cost information, directly on their charts. Here’s why every trader needs the “Symbol Cost Info MT4” in their arsenal: Real-Time Spread Monitoring : Keep a close eye on the spread for any currency pair, ensuring you enter the market at the most cost-effective times. Pip Value at Your Fingertips : Instantly know t
FREE
DeMarker Speed m
DMITRII GRIDASOV
MT4 外汇指标“DeMarker Speed” 该指标的计算基于物理学方程。 DeMarker Speed 是 DeMarker 本身的一阶导数 DeMarker 振荡曲线表示指标计算期间相对于之前高点和低点的当前价格位置 当标准 DeMarker 振荡器处于超卖/超买区域时(如图所示),DeMarker Speed 适合剥头皮入场 DeMarker 速度指示器显示 DeMarker 本身改变方向的速度 - 它非常敏感 如果 DeMarker Speed 指标的值 < 0:速度为负值; 如果 DeMarker Speed 指示器的值 > 0:速度为正值 指示器内置移动和 PC 警报 // 这里提供更多优秀的 EA 交易和指标: https://www.mql5.com/en/users/def1380/seller // 也欢迎您加入盈利、稳定、可靠的信号 https://www.mql5.com/en/signals/1887493 它是仅在该 MQL5 网站上提供的原创产品。
Volumes Message
Dmitriy Moshnin
Indicator of tick volumes equipped with notification system and the ability to monitor sudden and significant changes in the prices of bars relative to the specified coefficient - Change Factor - to the average value of volumes for a certain period of time (Period Signal) and the bar of the previous trading session. The color of the indicator's histogram characterizes the changes in volume of a bar: 1- relative to the previous session; 2 - relative to the signal line. According to the notificati
Cool volumes
Yerzhan Satov
箭头指示器"冷量"是基于mt4上的滴答量。 指标本身跟踪在一段时间内买入或卖出的数量(时间框架选择)。 当卖家或买家的交易量出现异常过剩时,它会发出卖出或买入的信号。 在较低的窗口中绘制彩色直方图,其中绿色显示了当时买家的主导地位,这意味着在这个价格范围内可能立即逆转增加。 相反,红色表示卖方的优势,这意味着潜在的立即向下逆转。 此外,为了方便视觉感知,箭头已直接添加到主图表窗口。 为了方便用户,外部变量包含信号频率及其在历史记录(HistoryBars)上的编号的设置变量。 但不建议将值设置为1000以上。 更多的这将减慢您的终端的性能。 同样在"===<<箭头设置>>>==="部分中,您可以自己设置任何箭头和直方图参数。 直方图的厚度,箭头与蜡烛的距离,箭头代码及其颜色。 或者您可以完全禁用主图表窗口上的箭头。 箭头和信号根本不画。 即使在更改时间框架和更新终端之后。 但有必要在固定直方图和箭头后进入交易! 祝大家好运!!!
History Exporter can help to export your orders history from MT4 account. After that you can use another data analysis tools to get what you want.  File format is .csv file, the content such as below OrderID,Symbol,Type,Lots,OpenTime,OpenPrice,StopLoss,TakeProfit,CloseTime,ClosePrice,Commission,Swap,MagicNo,Comment,ProfitUSD,ProfitPips,NetProfit,Duration,(Days),(HH:MM:SS), 21520206,EURCHF,buy,0.05,2020.03.10 08:06:15,1.06304,0.00000,0.00000,2020.03.11 13:37:38,1.06015,-0.60,-0.05,28282888,RedRab
FREE
History Pattern Search
Yevhenii Levchenko
该指标建立当前报价,可以与历史报价进行比较,并在此基础上进行价格走势预测。指示器有一个文本字段,用于快速导航到所需日期。 选项: 符号 - 选择指标将显示的符号; SymbolPeriod - 选择指标从中获取数据的时段; IndicatorColor - 指示器颜色; HorisontalShift - 由指标绘制的报价移动指定的柱数; Inverse - true 反转引号,false - 原始视图; ChartVerticalShiftStep - 图表垂直移动(键盘上的向上/向下箭头); 接下来是文本字段的设置,您可以在其中输入日期,您可以通过按“回车”立即跳转到该日期。 接下来是文本字段的设置,您可以在其中输入日期,您可以通过按“回车”立即跳转到该日期。
Boom and Crash Spike Detector 指标是根据主要用于检测价格中的 Boom 和 Crash 的高级策略进行编码的。 植入了复杂的算法来检测价格中高概率的繁荣和崩溃。 它会在潜在的繁荣或崩溃阶段发出警报: 繁荣阶段:当价格上涨过快时。 崩溃阶段:当价格下跌过快时。 限时优惠:该指标仅适用于 30美元和终身。 主要特征 向手机发送推送通知 在计算机或笔记本电脑上弹出并发出警报 显示非重绘箭头(向上箭头表示潜在繁荣,向下箭头表示潜在崩溃) 与所有对一起工作。 推荐 时间范围:H1 和 H4 推荐货币对:处于趋势阶段的货币对。 接触 如果您有任何问题或需要帮助,请通过私信联系我。 作者 SAYADI ACHREF,金融科技软件工程师和 Finansya 创始人。
Description A colored multicurrency/multisymbol oscillator of the market mood. The oscillator is designed for detecting the continuation or change of the market mood prior to its occurrence. An excellent example is the screenshots that show all the features of the oscillator. The oscillator may be used with any broker, irrespective of the name of the financial instrument since it is necessary to manually enter the name as an input parameter. If you enter a non-existent or incorrect name of a fin
VR Grid
Vladimir Pastushak
4.57 (7)
VR 网格指示器 设计 用于创建具有用户定义设置的图形网格。与 标准网格 不同,VR 网格用于构建 圆形关卡 。根据用户的选择,轮次级别之间的步长可以是任意的。此外,与其他指标和实用程序不同,即使时间段发生变化或终端重新启动,VR Grid 也能保持网格的位置 。 设置、设置文件、演示版本、说明、问题解决,可以从以下位置获取 [博客] 您可以在以下位置阅读或撰写评论 [关联] 版本为 [MetaTrader 5] 垂直级别 基于实际时间间隔并 忽略缺失 或不存在的周期。因此,级别之间的步长严格对应于用户选择的值。 使用 VR 网格指标时,交易者 可以更改任何级别的垂直线和水平线的样式 、颜色和粗细。这使您可以控制金融工具的 回合水平 。 整数位是 以两个或多个零结尾 的价格(例如:1.23500、5.65900、1923.200)。人们相信,这样的水平 经常充当 作为支撑或阻力的强点。 Horizontal line settings Horizontal line step Horizontal line color Horizontal line style Horizon
FREE
MT4 外汇指标“主要趋势直方图” 主要趋势直方图指标旨在捕捉真正的巨大趋势 指标有 2 种颜色:深粉色代表看跌趋势,春季绿色代表看涨趋势(颜色可以更改) 它可以检测开始阶段的趋势 - 比任何标准移动平均线交叉更有效 主要趋势柱状图可以与任何其他交易方法结合使用:价格行为、VSA、其他指标 指示器内置移动和 PC 警报 ............................................................................................................. // 这里提供更多优秀的 EA 交易和指标: https://www.mql5.com/en/users/def1380/seller // 也欢迎您加入盈利、稳定、可靠的信号 https://www.mql5.com/en/signals/1887493 它是仅在该 MQL5 网站上提供的原创产品。
The indicator analyzes the change in the minimum and maximum prices of the previous bars fixing the entrance of the big players. If the change (delta) increases, a signal is displayed on the graph in the form of an arrow. At the same time, virtual trade on history is carried out. In case of a repeat of the signal, the positions are increased (refilling). Thus the lot of positions can differ. The results of virtual trading in the form of losses / losses, profitability, drawdown and transaction li
MT4 外汇指标 HTF DeMarker 该指标是技术交易者用来寻找入场点和出场点的有用工具。 HTF 的意思是 - 更高的时间范围。 DeMarker 振荡线表示相对于之前高点和低点的当前价格位置 DeMarker 提供其他振荡器中最有效的常规发散信号 超买区是 DeMarker 高于 0.7 时,超卖区是 DeMarker 低于 0.3 时 指示器内置移动和 PC 警报 该指标非常适合具有价格行为条目或与其他指标结合的多时间框架交易系统。 HTF DeMarker 指标允许您将较高时间范围的 DeMarker 附加到您当前的图表 --> 这是专业的交易方法 // 这里提供更多优秀的 EA 交易和指标: https://www.mql5.com/en/users/def1380/seller // 也欢迎您加入盈利、稳定、可靠的信号 https://www.mql5.com/en/signals/1887493 它是仅在该 MQL5 网站上提供的原创产品。
Zig Zag 123
Stephen Reynolds
Zig Zag 123 tells us when a reversal or continuation is more likely by looking at the shift in supply and demand. When this happens a signature pattern appears known as 123 (also known ABC) will often break out in direction of higher low or lower high. Stop loss and take profit levels have been added. There is a panel that shows the overall performance of your trades for if you was to use these stop loss and take profit levels.  We get alerted if a pattern 123 appears and also if the price
TBP All in One
Dmitry Fedoseev
5 (2)
All patterns from Encyclopedia of Chart Patterns by Thomas N. Bulkowski in one indicator. It draws an up or down arrow whenever a pattern is identified. Patterns are selected in the drop-down list of the Pattern variable (located at the beginning of the properties window). The indicator has numerous external parameters, some of them apply to all patterns, while others are selective. To see more information on the parameters used for the selected pattern, enable the ShowHelp variable (located at
SQ Swing Fibo Marker
Bartlomiej Gorski
4.5 (2)
Swing Fibo Marker is adaptive advanced indicator that automatically detects price swings. After swing detection, it draws five profit targets, entry level and stop loss level. Levels are calculated base on price swing size, according to Fibonacci levels specified as entry points. When price touch the level indicator create alerts. List of supported alert types: Popup alerts Email alerts Push notification On screen output Suggested timeframe to trade: H1 or higher. The higher timeframe is used to
Range Multi Alligators provides Range Channel High Low Information and the market trend indicated by the blue-red Histogram in the middle of range channel. The range channel lines is useful to define stoploss and take profit. This is trend follower indicator based on the Multi Alligators. Attach it on the chart and change one or all setting then all lines will move synchronously with the current one. Parameters Period : the number of bars used for the indicator calculations. Default: 120 used
Mongol indicator
Sumiyabazar Buyanjargal
It's a variation of mid of HH and LL since it compares the higher of HH or LL against a period and twice the number of bars back to avoid whipsaws. I used to display this against lines on a chart, but made a histogram out of it and it looks interesting. It looks good at gauging trend strength and general turns (see image below). The name of the indicator is BAM, which is an acronym for "Below and Above Mid". Ways to use it: 1. To see general trend on longer TFs (more than 60 ba
The Multicurrency Trend Detector ( MTD ) indicator allows you to immediately and on one chart on a selected time interval (extending from a zero bar to a bar set in the settings by the value horizon) determine the presence, direction and strength of trends in all major currencies, as well as assess the reliability of these trends.               This is achieved by calculating indices (non-relative purchasing power) of eight major currencies, namely: AUD, CAD, CHF, EUR, GBP, JPY, NZ
Trend Divergence Finder – индикатор, позволяющий выявлять дивергенции цены и графика выбранного индикатора. С помощью Trend Divergence Finder вы сможете подобрать тот индикатор, который наиболее эффективен для Вас, и использовать его с наглядным отображением на графике. В индикатор включены 9 базовых индикаторов : 1.        RSI 2.        MACD 3.        MOMENTUM 4.        RVI 5.        STOCHASTIC 6.        CCI 7.        Standard Deviation 8.        Derivative 9.        William Blau Присутст
This is an expert advisor that will trail stop loss of orders selected from the list displayed on the chart. To make it run, add the expert to an empty chart (please set it on a chart that is not in use for analysis or other trading purposes, you can minimize it when setting a new order trail timed stop loss is not required). Set the number of pips to trail and the number of minutes to wait for the next stop loss review at the inputs tab in the Expert Properties window. From the list displayed o
Quick n Dirty Frequency Response
Safwan Rushdi Khalil Arekat
This indicator does not process the price chart data and does not provide trading signals. Instead, it is  an application to compute and display the frequency response of many conventional indicators. Moving averages like the SMA, LWMA and EMA, and  oscillators like the MACD, CCI, Awsome Osc, all have the form of digital filters. Electronic engineers use a special method to characterise the performance of these filters by studying their frequency response. Two important quantities of the frequ
FREE
A technical indicator that displays information about the trading volume in the form of a histogram of distribution by price levels. It is used as an independent indicator that helps to evaluate the current objective situation of the instrument, as well as in the format of integration with other methods of analysis, to confirm or filter when making trading decisions. Key Features: Interactive profile update, real-time work Five modes of histogram calculation The possibility of separating the vo
该产品的买家也购买
Gann Made Easy
Oleg Rodin
4.93 (70)
Gann Made Easy 是一个专业且易于使用的外汇交易系统,它基于使用先生理论的最佳交易原则。 W.D.江恩。该指标提供准确的买入和卖出信号,包括止损和获利水平。您甚至可以使用推送通知在旅途中进行交易。 购买后请联系我!我将免费与您分享我的交易技巧和丰厚的红利指标! 您可能已经多次听说过江恩交易方法。通常 Gann 的理论不仅对于新手交易者而且对于那些已经有一定交易经验的人来说都是非常复杂的东西。这是因为江恩的交易方法在理论上并不那么容易应用。我花了几年时间来完善这些知识,并将最好的原则应用到我的外汇指标中。 该指标非常易于应用。您所需要的只是将其附加到您的图表并遵循简单的交易建议。该指标不断进行市场分析工作并寻找交易机会。当它检测到一个好的入口点时,它会为您提供一个箭头信号。该指标还显示止损和获利水平。 换句话说,当您像先生一样进行交易时,该指标会为您提供最佳江恩建议。江恩亲自告诉你此时此刻该做什么。但最好的部分是您不需要了解任何有关江恩交易原则的知识,因为该指标会为您完成整个市场分析工作。
Atomic Analyst
Issam Kassas
5 (3)
首先值得强调的是,该交易指标是非重绘、非延迟的指标,这使其成为手动和机器人交易的理想选择。 用户手册:设置、输入和策略。 Atomic Analyst是一种PA价格行动指标,利用价格的力量和动量来寻找市场上更好的机会。配备了高级过滤器,可帮助去除噪音和假信号,并提高交易潜力。使用多层复杂的指标,Atomic Analyst扫描图表,并将复杂的数学计算转化为任何初学者都能理解并用来做出一致交易决策的简单信号和颜色。 “Atomic Analyst”是专为新手和经验丰富的交易者量身定制的综合交易解决方案。它将高级指标和一流功能融合为一体的交易策略,使其成为所有类型交易者的多功能选择。 日内交易和剥头皮策略:专为快速准确的日内交易和短期交易而设计。 日内和摆动交易策略:可用作追求价格大幅波动的日内和摆动交易者的可靠工具。 多货币和市场:凭借其可靠的精度,在不同的工具和市场上运作。 多个时间框架:可在多个时间框架上使用,性能良好。 稳定性:所有指标均不重绘、不重绘和不滞后,确保可靠的信号。 信号清晰度:提供箭头信号,用于清晰的入场和出场点。 实时警报:通过交易入场、SL和TP警报通知交
Scalper Inside PRO
Alexey Minkov
4.75 (57)
An exclusive indicator that utilizes an innovative algorithm to swiftly and accurately determine the market trend. The indicator automatically calculates opening, closing, and profit levels, providing detailed trading statistics. With these features, you can choose the most appropriate trading instrument for the current market conditions. Additionally, you can easily integrate your own arrow indicators into Scalper Inside Pro to quickly evaluate their statistics and profitability. Scalper Inside
Advanced Currency Strength28 Indicator
Bernhard Schweigert
4.9 (663)
目前26%的折扣 任何新手或专家交易者的最佳解决方案! 这个指标是一个独特的、高质量的、可负担得起的交易工具,因为我们纳入了一些专有的功能和一个新的公式。只需一个图表,你就可以读出28个外汇对的货币强度!想象一下,你的交易将如何得到改善,因为你的交易是在你的手中进行的。想象一下,你的交易将如何改善,因为你能够准确地确定新趋势或剥头皮机会的触发点? 用户手册:点击这里  https://www.mql5.com/en/blogs/post/697384 这是第一本,原版的! 不要买一个毫无价值的崇拜者的克隆品。 特别的 子窗口中的箭头显示强劲的货币势头GAP将指导你的交易! 当基础货币或报价货币处于超卖/超买区域(外盘斐波那契水平)时,在个人图表的主窗口中出现警告信号。 当货币力量从外围区间回落时,回撤/反转警报。 十字星模式的特别警报 可选择多个时间框架,以快速查看趋势! 货币强度线在所有的时间框架中都非常平稳,当使用较高的时间框架来识别总体趋势,然后使用较短的时间框架来确定精确的入口时,效果非常好。你可以根据自己的意愿选择任何时间框架。每个时间框架都由其自身进
TPSpro RFI Levels
Roman Podpora
4.8 (15)
Reversal First Impulse levels (RFI)    INSTRUCTIONS        RUS       -       ENG              R ecommended to use with an indicator   -   TREND PRO -  Version MT5 A key element in trading is zones or levels from which decisions to buy or sell a trading instrument are made. Despite attempts by major players to conceal their presence in the market, they inevitably leave traces. Our task was to learn how to identify these traces and interpret them correctly. Main functions: Displaying active zones
FX Volume
Daniel Stein
4.6 (35)
通过 mql5 和 Telegram 上 的 " 晨间简报 "获取每日市场更新,包括详细信息和屏幕截图 ! 外汇交易量(FX Volume)是第一个也是唯一一个从经纪商角度真正洞察市场情绪的交易量指标。 直接在您的图表上看到这些信息是真正改变游戏规则和突破性的交易解决方案。 受益于独特的市场数据洞察,如 比率(Ratios )显示货币多头和空头头寸的比率(百分比 比率变化 显示所选时间段内的多头比率及其百分比变化 总交易量 显示货币的总交易量(多头和空头),以手为单位 多头 交易量显示货币所有多头头寸的交易量 空头 交易量显示所有货币空头头寸的交易量 净多头 显示净多头交易量,即所有多头头寸减去所有空头头寸(以手为单位)。 净多头百分比 显示货币净多头交易量的变化 请阅读我们的基本教程 -> "如何使用外汇交易量进行交易 " 获取更多信息,如常见问题、交易技巧和教程视频,请访问我们的 外汇交易量公共信息频道 请 安装并运行 SI Connect 以建立与我们数据中心的持续连接 背景信息 我们都知道,外汇是一个分散的市场。这就是为什么我们必须打破常规思维,开发一个独
Trend Punch
Mohamed Hassan
5 (8)
Manual guide:   Click here WEEKEND PROMO of  $79!  -- Next price is  $149 .  This indicator is unstoppable when combined with our other indicator called  Support & Resistance . After purchase, send us a message and you will get it   for  FREE as a BONUS! I like to use Trend Punch on XAUUSD on the M1 timeframe!  Introducing Trend Punch , the revolutionary forex trend indicator that will transform the way you trade! Trend Punch is uniquely designed to provide precise buy and sell arr
TPSproTREND PrO
Roman Podpora
4.78 (18)
TPSpro TRENDPRO  - is a trend indicator that automatically analyzes the market and provides information about the trend and each of its changes, as well as giving signals for entering trades without redrawing! The indicator uses each candle, analyzing them separately. referring to different impulses - up or down impulse. Exact entry points into transactions for currencies, crypto, metals, stocks, indices!  -  Version MT5               DETAILED DESCRIPTION                R ecommended to use with
FX Power MT4 NG
Daniel Stein
5 (10)
通过 mql5 和 Telegram 上 的晨间简报获取每日市场更新,包括详细信息和屏幕截图 ! FX Power MT4 NG 是我们长期以来非常受欢迎的货币强度计算器 FX Power 的下一代产品。 这款下一代强度计算器能提供什么?您所喜爱的原版 FX Power 的所有功能 附加功能 黄金/XAU 强度分析 更精确的计算结果 可单独配置的分析周期 可自定义计算限制,以获得更好的性能 为希望查看更多信息的用户提供特殊的多实例设置 无尽的图形设置,可在每个图表中设置您最喜欢的颜色 无数的通知选项,让您再也不会错过任何重要信息 采用 Windows 11 和 macOS 风格的全新圆角设计 神奇的移动指标面板 FX Power 主要功能 所有主要货币的完整强势历史 所有时间框架内的货币强弱历史 所有经纪商和图表的计算结果完全相同 100% 可靠的实时计算 -> 无重绘 可通过下拉列表选择分析时段 通过自定义模式单独配置分析时段 可在一个图表中使用多个实例 可移动 FX Power 显示屏(通过拖放) 适用于高分辨率 QHD、UHD 和 4K 显示器 自动终端配置 针对平板电脑
Gold Stuff
Vasiliy Strukov
4.89 (257)
Gold Stuff 是专为黄金设计的趋势指标,也可用于任何金融工具。 该指标不会重绘,也不会滞后。 推荐时间框架 H1。 在它指标工作全自动专家顾问 EA Gold Stuff。 你可以在我的个人资料中找到它。 重要! 购买后立即与我联系,以获得说明和奖金!   您可以免费收到我们的强力支持和趋势扫描指标的副本,请私信。大部头书! 购买后立即联系我以获得设置和个人奖励!   设置 绘制箭头 - 打开关闭。 在图表上绘制箭头。 警报 - 打开关闭声音警报。 电子邮件通知 - 打开关闭。 电子邮件通知。 Puch-notification - 打开关闭。 推送通知。 接下来,调整色域。 Gold Stuff 是专为黄金设计的趋势指标,也可用于任何金融工具。 该指标不会重绘,也不会滞后。 推荐时间框架 H1。 在它指标工作全自动专家顾问 EA Gold Stuff。 你可以在我的个人资料中找到它。 购买后立即联系我以获得设置和个人奖励!   设置 绘制箭头 - 打开关闭。 在图表上绘制箭头。 警报 - 打开关闭声音警报。 电子邮件通知 - 打开关闭。 电子邮件通
Enigmera
Ivan Stefanov
5 (2)
ENIGMERA:市场核心 https://www.enigmera.com 简介 该指标和交易系统是金融市场的一种非凡方法。ENIGMERA 利用分形周期精确计算支撑位和阻力位。它能显示真实的累积阶段,并给出方向和目标。 该系统无论在趋势中还是在修正中都能发挥作用。 它是如何运行的? ENIGMERA 由三条线组成:支撑/阻力线、目标线和偏离线。与一般市场指标将过去的数据推断为现在和未来的情况不同,该系统能提供当前的完整情况。如果你处于支撑位,这意味着真正的支撑;如果你处于阻力位,这意味着真正的阻力。如果突破某一水平,则表示趋势发生变化。没有重绘。 由于市场在不断变化,ENIGMERA 不断调整其评估工具,定期修改策略。  这保证了每种情况都能得到全面评估。这一市场指标的独特性显而易见,其能力不言而喻。  ENIGMERA 为金融分析师和咨询师提供服务,他们需要可靠的见解与客户分享,也为投资者提供服务,他们需要最精确和最可靠的保证。 该系统能够达到最佳精度,使交易者能够自信、清晰地评估他们的选择。 ENIGMERA 将 20 年的交易专长和知识整合到一个综合软件
Break and Retest
Mohamed Hassan
4.33 (12)
New update to V.4 where  Break & Retest automatically draws the take profit & stop loss levels and you also have more signals per day! ‍You can visually backtest Break & Retest to see how it behaved in the past!     Manual guide:   Click here $60 for a very limited time. Next price is $120   This Indicator only places quality trades when the market is really in your favor with a clear break and retest. Patience is key with this price action strategy! If you want more alert s
Gann Swing Structure
Kirill Borovskii
5 (1)
This indicator is based on the mathematics of the great trader W.D. Ganna. With its help, you can easily find strong levels by analyzing swings to find the optimal entry point. The indicator works on all instruments and all timeframes. The indicator is fully manual and has control buttons. All you need to do is press the NEW button, a segment will appear, which you can place on any movement, swing or even 1 candle that you want to analyze. By placing the segment, press the OK button. A grid (th
目前八折优惠! 对任何新手或专家交易者来说都是最好的解决方案! 这个仪表板软件适用于28种货币对。它基于我们的两个主要指标(高级货币强度28和高级货币冲动)。它对整个外汇市场提供了一个伟大的概述。它显示高级货币强度值,货币运动速度和28个外汇对在所有(9)时间段的信号。想象一下,当你可以使用图表上的单一指标观察整个市场,以确定趋势和或剥头皮的机会时,你的交易将得到改善 我们已经在这个指标中建立了一些功能,使你更容易识别强势和弱势货币,同时识别和确认潜在的交易。该指标以图形方式显示货币的强势或弱势是增加还是减少,以及它在所有时间段的表现。 增加的新功能是动态市场斐波那契水平,它适应当前的市场条件变化,这是一个已经在我们的高级货币强度28和高级货币冲动指标中使用的成熟的加分项。 在交易时,总是将弱势货币和强势货币配对,这个新指标将帮助你做到这一点。 用户手册:点击这里  https://www.mql5.com/en/blogs/post/708783 特点  显示每个时间段的ACS28和GAP-speed(冲动)的货币强度值。 列:颜色代码以7种颜色
首先,值得强调的是,这个交易工具是非重绘、非重画和非滞后的指标,非常适合专业交易。 在线课程,用户手册和演示。 智能价格行动概念指标是一个非常强大的工具,既适用于新手,也适用于经验丰富的交易者。它将超过20个有用的指标合并到一个指标中,结合了高级交易思想,如内圈交易员分析和智能资金概念交易策略。该指标侧重于智能资金概念,提供有关大型机构交易方式的见解,帮助预测它们的动向。 它在流动性分析方面尤其擅长,有助于理解机构的交易方式。它擅长预测市场趋势,并仔细分析价格波动。通过将您的交易与机构策略对齐,您可以更准确地预测市场走向。该指标多才多艺,擅长分析市场结构,识别重要的订单区块,并识别各种模式。 它擅长识别BOS和CHoCH等模式,理解动量的转变,并突出显示供需强劲的关键区域。它还擅长发现强大的不平衡,并分析价格创造更高高点或更低低点的模式。如果您使用斐波那契回撤工具,该指标可以满足您的需求。它还可以识别相等的高点和低点,分析不同的时间框架,并通过仪表板显示数据。 对于使用更高级策略的交易者,该指标提供了工具,如公平价值差指标和优惠和折扣区域的识别。它特别关注高时间框架订单
Advanced Supply Demand
Bernhard Schweigert
4.92 (311)
现在优惠 33%! 任何新手或专业交易者的最佳解决方案! 该指标是一款独特、高质量、且价格合理的交易工具,因为我们已经整合了许多专有功能和新公式。 依据此更新,您将能够显示双重时间帧区域。 您不仅可以显示一个较高的时间帧,还可以同时显示图表时间帧,加上更高的时间帧:显示嵌套时区。 供需双方所有交易者都会喜欢它。 :) 重要信息披露 高级供需的最大潜力,请访问 https://www.mql5.com/zh/blogs/post/720245   想象您的交易如何得以改善,是因为您能够精准定位入场或目标位吗? 构建于新的底层算法,它可以更轻松地识别出买卖双方之间的潜在失衡。 这是因为它以图形方式展示供需最强劲区域,及其过去的表现(显示旧区域)。 这些功能旨在帮助您更轻松地发现最佳入场区域和价位。 现在您可以针对您的交易品种和时间帧来优化和编辑区域强度! 高级供需指标适用于所有产品和时间帧。 它是一个新的公式,非常新的功能是两个区域强度函数可由用户输入进行调整! 这在交易中是一大优势。 当您学习如何使用专有功能,例如带有价格游离最小 X 因子的区域强度时,您能够判断该区域强劲与否。 供
Entry Points Pro
Yury Orlov
4.7 (225)
这是一款 MT4 的趋势指标,可提供准确的入场交易信号,且无重绘或延迟。 它可应用在任何金融资产:外汇、加密货币、贵金属、股票、指数。 最好的结果出现在 M15+ 的时间帧内。 指标的 MT5 版本 重要! 购买后请联系我,以便获取详细指南和奖励。 视频 (6:22) - 一个信号赢取的利润等于指标价格的三倍。 视频 (4:44) - 它如何在测试器中工作,我的提示和技巧。 视频 (1:44) - 有关它如何处理加密货币和指数的几句话。 大多数交易者在 Entry Points Pro 指标的帮助下,在第一个交易周内就改善了他们的交易结果。 Entry Points Pro 指标的益处 入场信号无重绘或延迟 如果信号出现,并得到确认(如果信号所在烛条已收盘),则它不会再消失;不像是重绘指标,它会导致重大的财产损失,因为它们可以在显示信号后再将其删除。 无差错开仓 指标算法可令您找到入场交易(买入或卖出资产)的理想时机,从而提高每位交易者的成功率。 Entry Points Pro 可操作任何资产 它允许您在 MT4 平台上交易任何经纪商提供的加密货币、股票、
PRO Renko System
Oleg Rodin
5 (25)
PRO Renko Arrow Based System for trading renko charts.  准确的信号交易任何外汇工具. 另外,我将免费提供系统的附加模块! PRO Renko系统是RENKO图表上高度准确的交易系统。该系统是通用的。 该交易系统可应用于各种交易工具。 该系统有效地中和了所谓的市场噪音,打开了获得准确反转信号的通道。 该指标易于使用,只有一个参数负责产生信号。 您可以很容易地使算法适应您感兴趣的交易工具和renko酒吧的大小。 我很乐意通过提供任何咨询支持来帮助所有客户有效地使用该指标。 祝您交易成功!购买后,立即写信给我! 我将与您分享我的建议和我的renko发电机。 另外,我将免费提供系统的附加模块!
Market Reversal Alerts
LEE SAMSON
4.21 (121)
成為突破者,隨著價格反轉,市場結構會改變利潤。 訂單突破者指示器可以識別趨勢或價格走勢何時接近枯竭並準備好逆轉。它會提醒您市場結構的變化,通常會在發生逆轉或重大回調時發生。 該指標使用專有計算來確定突破和價格動能。每當在可能的耗盡點附近形成新的高點時,指標就會繪製最後一個生成該高點的順序塊。然後,它將隨價格移動隨價格跟隨定單。然後,當價格轉向相反方向並突破該訂單塊時,它會提醒您,從而創建新的市場結構並開始趨勢或重大回調的可能逆轉。 訂單塊是在創建高/低之前的最後一個相反的彩色蠟燭,並且當價格跌破這些關鍵區域以下時,這表明趨勢可能會發生短期或長期反轉。 特徵 提醒您關鍵耗盡點的市場結構變化 價格接近耗盡水平時自動提取訂單塊 在一個方向繼續移動時,在價格後面跟踪定單,以提醒您最佳的反轉輸入 將顏色更改為純色塊,以顯示何時發生市場結構中斷。 適用於所有交易品種和時間範圍 內置集成的彈出窗口和電子郵件警報 策略和如何與定單破壞者指標進行交易 當斷路器塊發生時,您有兩個選擇。 看左邊!我們正在尋求供應/需求或支撐/阻力位嗎?市場結構轉變(逆轉)通常發生在價格重新測試舊水平或
Advanced Currency IMPULSE with ALERT
Bernhard Schweigert
4.91 (494)
目前31%的折扣!! 对任何新手或专家交易者来说都是最好的解决方案! 这个指标是一个独特的、高质量的、负担得起的交易工具,因为我们已经纳入了一些专有的功能和一个秘密的公式。只需一张图表,它就能给出所有28种货币对的警报。想象一下,你的交易将如何改善,因为你能够准确地确定新趋势或剥头皮机会的触发点 建立在新的基础算法上,它使识别和确认潜在交易变得更加容易。这是因为它以图形方式显示了一种货币的强势或弱势是否正在加速,并测量了这种加速的速度--把它想象成你汽车中的速度表。当你加速时,事情显然会发生得更快,这在外汇市场上也是一样的,即如果你配对的货币正在向相反的方向加速,你就会发现一个潜在的有利可图的交易。 货币动量的垂直线和箭头将指导你的交易! 动态的市场斐波那契23水平被用作警报触发器,将适应市场活动。如果冲动触及黄色触发线,您将在MetaTrader或您的电子邮件或推送警报中收到警报。然后你就知道作为一个交易员应该做什么。货币对和方向已经给出。只要点击警报按钮,就可以切换到该货币对或打开一个新的图表,以便进一步分析。警报级别可以通过用户输入来改变,可以选择3个敏感度级别
Dragon Multi Indicator MT4
Mansour Babasafary
5 (4)
3 Indicators in 1 indicator Strategy based on price action Made specifically for the best forex currency pairs Can be used in the best time frame of the market at a very reasonable price This indicator is basically 3 different indicatos . But we have combined these 3 indicators in 1 indicator so that you can use 3 indicators at the lowest price. All three strategies are based on price action. But based on different trends. Long term, medium term and short term Attributes : No repaintin
TrendDecoder Premium
Christophe Pa Trouillas
5 (5)
确定范围和下一步可能的走势   |  获得早期信号和趋势强度   |  在反转之前获得明确的退出   |  了解价格将测试哪些斐波水平 非重绘、非延迟指标 - 手动和自动交易的理想选择 - 适用于所有资产和所有时间单位 限时优惠 >>   50% OFF 购买后,  请联系我的频道  获取推荐设置 MT5   版本: 点击此处 使用   BladeSCALPER   和   PowerZONES   获取我们的完整方法 它是什么? TrendDECODER 集多种创新于一身,使趋势监测变得简单易行。 投射趋势线(Projective TrendLine)--快速参考即将到来的趋势 实时趋势线(RealTime TrendLine)与投射趋势线(Projective TrendLine)的对比 - 与之前的同方向走势相比,市场是加速还是放缓? 实时趋势线交叉 - 趋势正在偏离轨道 使用 GreyBox - 市场不再是趋势并进入新的过渡序列 使用 DecoderSignals 和 Blue/Orange Clouds - 利用作为动态支撑/阻力的 Blue/Orange
使用我们的自定义MT4指标发现成功外汇交易的秘诀! 您是否曾经想过如何在外汇市场上取得成功,一贯赚取利润,同时降低风险? 这是您一直在寻找的答案! 允许我们介绍我们的专有MT4指标,该指标将彻底改变您的交易方法。 独特的多功能性 我们的指标专为喜欢Renko和Rangebar Candle编队的用户而设计。 我们了解到,这些图表类型受到许多经验丰富的交易者的青睐,这就是为什么我们的指标与它们无缝集成,从而提供无与伦比的市场分析。 清晰的趋势信号 忘记复杂的分析! 我们的指标利用鲜艳的色彩和清晰的点结构来明确指示市场趋势。 红色和蓝色的点毫无疑问地对价格变动的方向留下了疑问,从而可以在您的交易中快速决策。 与HH/HL HL/LL策略对齐 如果您正在寻求一个指标,该指标无缝地与基于HH/HL和HL/LL结构的策略无缝合作,则不需要更多。 我们的工具不仅确定了这些形式,而且还促进了它们在投资过程中的有效利用。 绝对的清晰度和简单性 我们的首要任务是为您提供一种不仅有效而且易于使用的工具。 我们的指标是为了清晰而设计的,使您可以专注于做出投资决策,而不是
M1 Arrow
Oleg Rodin
5 (14)
M1 Arrow - 基于市场的两个基本原则的盘中策略。 该算法基于使用附加过滤器对交易量和价格波动的分析。该指标的智能算法仅在两个市场因素合二为一时才会发出信号。该指标使用较高时间框架的数据计算 M1 图表上某个范围的波浪。为了确认波浪,该指标使用了成交量分析。 从理论上讲,该指标可以与其他时间框架一起使用,但您需要考虑到该指标最初是为在 M1 上交易而开发的这一事实。 该指标是一个现成的交易系统。交易者所需要的只是跟随信号。此外,该指标可以成为您自己的交易系统的基础。交易仅在分钟图表上进行。 尽管指标使用 MTF 原理,但指标算法尽可能稳定。 购买后,一定要写信给我!我将与您分享我的交易设置和建议!祝您交易成功!感谢您的关注!
ICT, SMC, SMART MONEY CONCEPTS, SMART MONEY, Smart Money Concept, Support and Resistance, Trend Analysis, Price Action, Market Structure, Order Blocks, BOS/CHoCH,   Breaker Blocks ,  Momentum Shift,   Supply&Demand Zone/Order Blocks , Strong Imbalance, HH/LL/HL/LH,    Fair Value Gap, FVG,  Premium  &   Discount   Zones, Fibonacci Retracement, OTE, Buy Side Liquidity, Sell Side Liquidity, BSL/SSL Taken, Equal Highs & Lows, MTF Dashboard, Multiple Time Frame, BigBar, HTF OB, HTF Market Structure, 
TrendMaestro
Stefano Frisetti
5 (3)
note: this indicator is for METATRADER4, if you want the version for METATRADER5 this is the link:  https://www.mql5.com/it/market/product/108106 TRENDMAESTRO ver 2.4 TRENDMAESTRO recognizes a new TREND in the bud, he never makes mistakes. The certainty of identifying a new TREND is priceless. DESCRIPTION TRENDMAESTRO identifies a new TREND in the bud, this indicator examines the volatility, volumes and momentum to identify the moment in which there is an explosion of one or more of these data a
PZ Trend Trading
PZ TRADING SLU
4.75 (4)
许多盈利交易者不仅知道如何识别市场趋势,而且也能把握趋势建立后的交易机会。 Pz 趋势交易 指标设计用来在趋势行情中尽可能的赚取利润。 已建立的趋势提供了一揽子交易机会,但大多数趋势交易指标完全忽视了它们,让交易者在趋势行情时完全不知道该如何做!一般趋势指标只通知有关的趋势变化,但根本不足以得到卓越的回报. Pz 趋势交易 指标比一般趋势指标显示多达 20 倍的交易 , 因为它注重所谓的市场时机。它不仅显示当前的市场趋势,也有回调,内柱线的突破和调整。它令您在趋势回调之后介入,安全的柱线内突破金字塔加仓,以及发现潜在的反转,和已知的调整。 趋势改变 一个趋势改变在市场方向变化时发生。趋势变化在图表上用带数字的彩色圆圈显示。蓝色 (1) 信号为上涨开始, 而红色 (1) 信号为下跌开始。趋势变化并非评估当前价格动作的结果, 它意味着交易设置是不定时地。如果您正确使用本指标, 在趋势变化时, 您将将已经入场 (参看下面的调整)。 回调 但凡趋势在运动中,行情上下抖动,盈利者收割利润,且其它参与者入场。趋势回调代表好的买入机会,通常是由主力获利离场导致。如果行情在回调后回归上行, 指
Full Forex Market View Dashboard
Opengates Success International
5 (2)
完整的外汇市场视图仪表板指示器 这是一个自定义指标,旨在让交易者全面了解市场上正在发生的事情。 它使用实时数据访问市场并显示成功交易所需的每一点信息。 安装: 在将此指标附加到您的窗口图表之前,请转到您的 MT4 的市场观察面板并隐藏所有您不需要或交易的货币对,并将其余货币对留在那里。 原因是 FFMV 仪表板将显示出现在 MT4 市场观察中的所有货币对。 它最多可以显示 30 个或更少的货币对。 如果它超过您 MT4 的市场观察中的那个,它会模糊和毁坏 FFMV 仪表盘上的字体和图像! 它不会正确显示。 用法:      单人交易      对于篮子交易(见截图如何)      也可用于多单交易      确认从您自己的交易系统等收到的信号的有效性。 成分:      时间范围:从 M1 到 MN1 当前蜡烛状态(买入/卖出      趋势:币种整体走势      影响:货币变动的幅度/波动性,见下文:      建立:货币正在建立      好:货币越来越严重      高:币值值得关注      强:要考虑方向  
ECM Channel MT4
Paulo Rocha
5 (1)
ECM Elite Channel is a volatility-based indicator, developed with a specific time algorithm, which consists of finding possible corrections in the market. This indicator shows two outer lines, an inner line (retracement line) and an arrow sign, where the channel theory is to help identify overbought and oversold conditions in the market. The market price will generally fall between the boundaries of the channel. If prices touch or move outside the channel, it's a trading opportunity. The
Quantum Trend Sniper Indicator MT4
Bogdan Ion Puscasu
4.6 (40)
介绍   量子趋势狙击指标 ,突破性的 MQL5 指标,正在改变您识别和交易趋势反转的方式!由拥有超过13年交易经验的资深交易员团队开发,     量子趋势狙击指标   旨在通过其创新的方式以极高的准确度识别趋势反转,将您的交易之旅推向新的高度。 ***购买量子趋势狙击指标,即可免费获得量子突破指标!*** 当量子突破指标识别出趋势反转时,它会向您发出警报和信号箭头,并建议您三个止盈水平。 它既适合新手交易者,也适合专业交易者。 量子 EA 通道:       点击这里 MT5版本:       点击这里 建议: 时间范围:  所有时间范围。为了获得最佳结果,我们建议在 M15、M30 和 H1 时间范围内使用它。 货币对:欧元兑美元、英镑兑美元、澳元兑美元、欧元兑英镑, EURAUD, XAUUSD 账户类型:ECN、Raw 或 Razor,点差极低 经纪时间:任意 经纪商:IC Markets、Pepperstone with Raw 和 Razor 的点差最低 建议止损:50 点 建议止盈水平:20 点、50 点和 1
作者的更多信息
Hello all. This indicator helps you  to open a trade, when break out occurred, also you can add to your position and ride it if trend continued. I use it on 1-5 min chart, as you can use short stop loss. Also profit target should be small as well. It is better to enter few small position, so you can book some profit early and ride the rest for bigger gains. Look at the past to have a plan. Enjoy. 
FREE
Break out indicator
Anton Luik
4 (1)
Hello all. This indicator helps you  to open a trade, when break out occurred, also you can add to your position and ride it if trend continued. I use it on 1-5 min chart, as you can use short stop loss. Also profit target should be small as well. It is better to enter few small position, so you can book some profit early and ride the rest for bigger gains. Look at the past to have a plan. Enjoy. 
FREE
This indicator helps you to build position and profit when market turns in your favor. You will build your full position by trading many small position. Once blue arrow appear on the chart, you could add long position. Once red arrow appear on the chart, you could add short position. I personally spread my full size position in to 5-10 small position. I use small target of 2-5 pips on eurusd pair.  
筛选:
John Winsome Munar
3471
John Winsome Munar 2022.06.20 18:04 
 

用户没有留下任何评级信息

Domenico Tarantino
116
Domenico Tarantino 2022.03.02 12:59 
 

用户没有留下任何评级信息

Aravind Kolanupaka
8870
Aravind Kolanupaka 2022.01.29 14:59 
 

用户没有留下任何评级信息

回复评论