Abiroid Slope MA
- 指标
- Abir Pathak
- 版本: 1.2
- 更新: 6 六月 2023
Features:
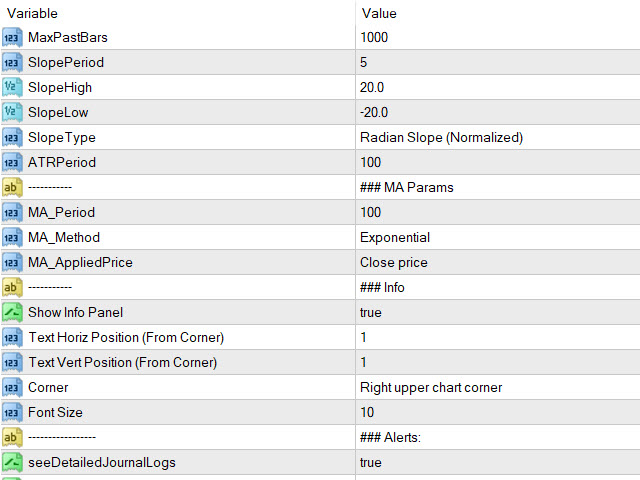
- Moving Average Slope for Max Past Bars
- Slope Period
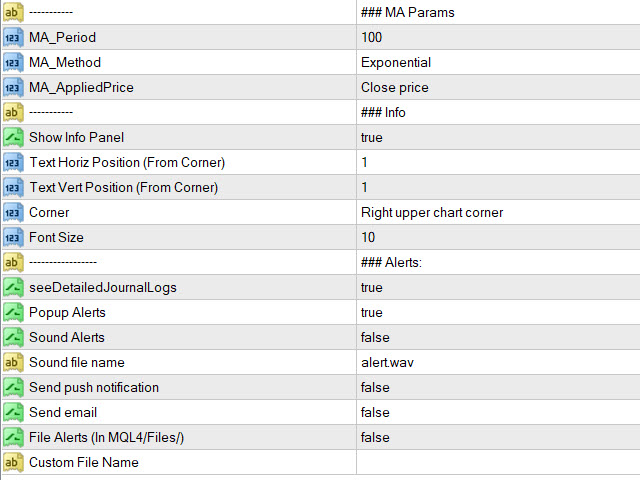
- Slope Thresholds
- Multiple Slope Type options
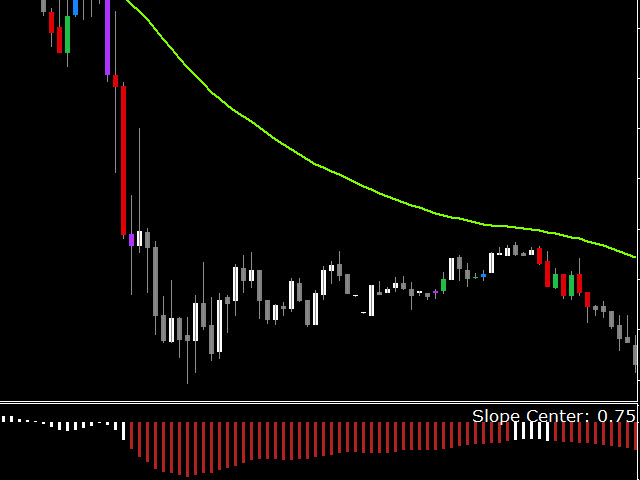
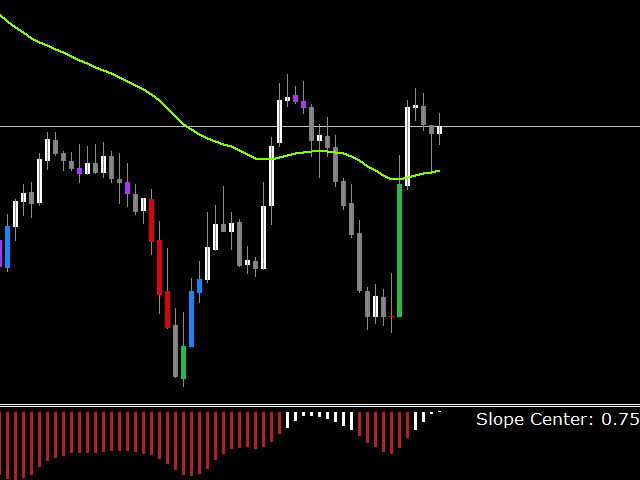
- See slope visually as a histogram
- Info Panel Show/Hide
Slope Calculations and Types:
The slope value is calculated using the Slope Period. Suppose Period is 5, it will check the MA value for bar (x) and bar (x+5).
And find the slope angle between them.
Read detailed description about Slope Types and Settings here:

This is such a good indicator. Thank you