• 概述
  • 评论
  • 评论

Extend Extreme Line

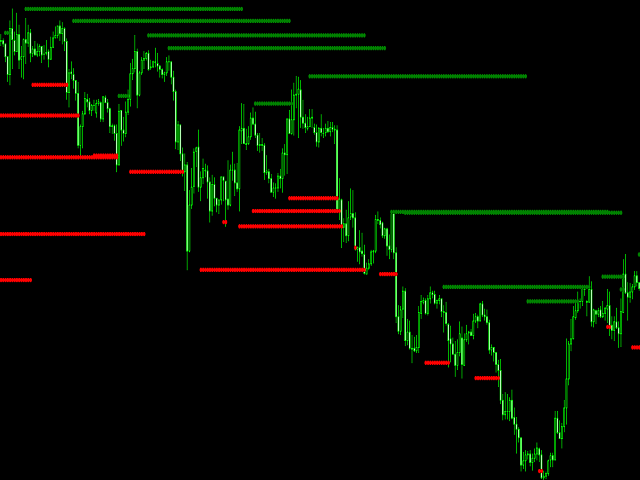
Previous High and Previous Low in the charts usually forms an area of interest for trading on the chart.

Price usually move quickly then stall around these areas.

This indicator identify Bars which are highest or lowest of the surrounding bars and extend a line out to visualize it.

  • Extend line for how many bars: Define how many bars to extend the bars to the right of the extreme bar.
  • Width of Extreme: Define how many bars it should be the highest/lowest to the left and right of the bar
  • Keep line for how many bars after broken: Define how many bars the line should be kept once it has been broken by another high or low


推荐产品
Viking Strategy Signal
E Bahamlong Bagoudjare
This utility will analyze all financial assets for you, it will send you the signals on your chart and on telegram to allow you to receive the signals on your smartphone wherever you go with supporting screenshots, so you ' don't miss opportunities even if you are at work or in a job and you have access to the internet. Fonctionnalities : - Self-analysis of financial activities according to a trend strategy that is 98% effective - Auto sending signals on the chart and on telegram for copy tradin
Advisor for hedging trading or pair trading. A convenient panel allows you to open positions on the necessary trading instruments and lots. Automatically determines the type of trading account - netting or hedging. Advisor can close all its positions upon reaching profit or loss (determined in the settings). A negative value is required to control losses (for example, -100, -500, etc.). If the corresponding fields are 0, the EA will not use this function.   Settings: Close profit (if 0
Market Ticker Pro MT5
John Louis Fernando Diamante
The only Market Ticker on the market! Add a professional novelty to your workspace, with built in mini-charts A scrolling Market Ticker that displays price changes from all symbols in the Market Watch list. Provides an easy snapshot of symbol prices, and keeps scrolling automatically while you trade and analyse the chart. The ticker color (+/- price changes) are based on either the current or completed candle, and the previous candle. Options include: - MTF, eg choose to show price changes o
An indicator of patterns #45 and #46 (Three Falling Peaks and Three Rising Valleys) from Encyclopedia of Chart Patterns by Thomas N. Bulkowski. Parameters: Alerts - show alert when an arrow appears   Push - send a push notification when an arrow appears (requires configuration in the terminal) PeriodBars - indicator period K - an additional parameter that influences the accuracy of pattern shape recognition. The smaller the value is, the smoother the row of peaks/valleys should be, so fewer patt
TrendEdge Indicator Limited-time Special Opportunity: Seize the moment! Be among the first 10 (Purchasing 1/10) to seize this unique opportunity, and not only will you acquire a top-tier trading algorithm but also enjoy an exclusive discount. Don’t delay; this could be your key to trading success with just a few clicks. Grab it now and prepare to elevate your trading experience! Note: This offer is available solely to the first 10 purchasers. Don’t mis out on this one-of-a-kind chance! Descri
Plucking Machine I   Plucking Machine I   is a trend indicator designed specifically for gold and can also be used on any financial instrument. The indicator does not redraw and does not lag. Recommended time frame H1. The current setting is applicable for all time periods. It shows the current direction of the market based on price movements. Corresponding products of indicators:   https://www.mql5.com/zh/market/product/61388?source=Site+Market+Product+Page#description
Demo Version of Strategy Manager Plus ! This Demo is a simply view of the Dashboard with the followings strategy :    - if SMA 6 is upper than SMA 18 --> Blue color    - if SMA 6 is lower than SMA 18 --> Red Color No need of the external GUI, Load configuration is not available, no manual trading is available. Visit  https://www.mql5.com/en/market/product/46420  for full version !
FREE
Exchange Chart Free
Cesar Afif rezende Oaquim
Exchange Chart Free   The ease of observing the market anytime, anywhere Exchange chart is the software for the professional trader to follow what happens in the financial market in real time. Developed by those in the market, it keeps up with the latest research on successful traders who show that the best, the ones who get consistent results use few types of chart configurations, in several different symbols. All market watch passing through your chart Exchange chart makes all the symbol
FREE
Demo version T Trading Simulator   doesn't work in the strategy tester. The Strategy Tester does not support the processing of ChartEvent. It does not support most of the panel's functionality. To test the product, you can download the Demo Version here :  T Trading Simulator DEMO Contact me for any questions or ideas for improvement or in case of a bug found. Hi everyone, Trobotrader here. By T Trading Simulator , You can go back to past then analysis and trade with this simulator to develop t
To The Moon AI mt5
Vladimir Stepanov
5 (3)
EA 使用复杂的人工智能,利用美国时段的高影响力新闻结果来检测市场方向。 该系统将在几秒钟内实时分析大量数据——而不是依赖使用历史数据的过时指标——以新趋势的方向触发买入或卖出交易,直到达到利润目标。 请记住将“WorkMode”设置更改为“mode_Real”以使 EA 正常工作。 EA 交易将连接到新闻网站,因此您必须在工具 > 选项 > EA 交易中勾选“允许 WebRequest”。 添加以下内容:“ https://ec.forexrostools.com ”、“ https://worldtimeserver.com ”,然后按“确定”。 可以在此处查看实时 结果 。 购买后立即联系我以获得个人奖金! 设置和说明 书在这里 EA 将适用于 m1 图表上的所有美元货币对 参数: 工作模式 - mode_Real 控制用户打开的订单 – True/False 最大买入数量 - 交易顾问可以开立的最大买入订单数量。 最大卖出数量 - 交易顾问可以开立的最大卖出订单数量。 评论 - 订单旁边的评论。 批次 - 起始批次。 使用动态批次 - 使用动态批次。 每 0.
- simple Price Action Indicator - NON Lagging ! the Alert shows instantly whats happening - there is a VOLUME-Filter (Candle-Size in points)  to avoid alerts with tiny Candles during a NON-VOLUME-Time plus you have a RANGE-Filter-Option (to make sure you get only the highest/lowest within that RANGE!) - recommended SETUP is: 25-30% Wicksize ( means the %percentage of the whole Candle) bullish or bearish --> can easily be adjusted - user defined - recommended Timeframe: M30 (with some experience
Is your trade at a loss? Does not matter ! You can use this Extra martingale tool.  In the set loss of your trade or your EA's trade , this tool will open another trade at a better price. It can also open multiple trades at different distances and with different lot sizes. Each trade will be assigned a TakeProfit. This tool has a lot of settings. You can set variable lot sizes, variable trade distances, variable TakeProfit sizes, maximum total profit or loss in money. You can also close trades
Aussenstab Markttechnik
Alexander Josef Zeidler
This indicator shows external bars ("Aussenstäbe") in the chart in candle form. The colors of the candles can be set individually. Also different colors for bearish and bullish bars are possible. In addition, the color of the wicks or outlines is also adjustable. Outside bars are mentioned e.g. by Michael Voigt in the book "Das große Buch der Markttechnik". All other candles are inner bars.
Our trade calculator program is an essential tool for any trader looking to make informed decisions and optimize their trades on the popular MetaTrader 4 platform. The program provides traders with real-time market data and advanced analytics, allowing them to easily calculate their position size, risk-to-reward ratio, and potential profits or losses. It also offers customizable settings, allowing traders to tailor the tool to their specific trading style and preferences. With our trade calculat
MP Heatmap for MT5
Pierre Ksachikian
4 (2)
A heatmap is a graphical representation of data in two dimensions, using colors to display different factors. Heatmaps are a helpful visual aid for viewers, enabling the quick dissemination of statistical or data-driven information. The MP Heatmap indicator provides a graphical representation of the relative strengths of major currencies compared to others, organizing data from pairs into color-coded results and producing a clear overview of the entire Forex market. The MP Heatmap indicator dis
FREE
Iai
Yu- Kai Se Naga
5 (1)
居合 -IAI- 最强的Scalping EA登场 日本的居合术针对对手的瞬时动作以人类极限的反应速度进行反击,并以超人的速度斩击。 这款EA能够对人类无法反应的瞬时入场点进行反应,并以超高速进行判断和进场。 交易环境 货币对: EUR/USD 时间周期: M1 产品特点 本EA能够捕捉到Bollinger带的3σ超出的瞬间,并进行逆向交易。 它是一个不受技术分析或基本面数据影响,能够捕捉瞬时噪音的自动交易机器人的最强逻辑。 参数说明 本产品无需复杂的参数设置。 对于使用固定手数的操作者,请指定手数。对于使用复利的操作者,请指定使用超过保证金的百分之多少进行购买。 其他的设置值保持默认,将表现出最佳的性能。 参数名称 默认值 说明 Magic Number. 2353463 运行本EA时指定的Magic Number。 基本上没有更改的必要。 与其他EA同时运行时,请确保Magic Number不重复。 Fixed lots. 0.0 请指定购买的固定手数。 如果使用复利,将此参数设置为0.0。 Percent of lot use to free margin. 20
ABCD Pattern Scanner MT5
Reza Aghajanpour
5 (9)
** All Symbols x All Timeframes scan just by pressing scanner button ** *** Contact me after the purchase to send you instructions and add you in "ABCD scanner group" for sharing or seeing experiences with other users. Introduction This indicator scans AB=CD retracement patterns in all charts. The ABCD is the basic foundation for all harmonic patterns and highly repetitive with a high success rate . The ABCD Scanner indicator is a scanner reversal ABCD pattern that helps you identify when the pr
The   Pairs Cross indicator   is a unique tool for negatively correlated trading instruments, such as EURUSD and USDCHF currency pairs. It is based on a concept called pairs trading (or spread trading). Our indicator compares the strength of two currency pairs that are inversely correlated and quickly tells you when it’s time to buy the first pair and short a second pair, and vice versa. This is a straightforward approach to trading currency pairs that works very well. How to you use the Pair
The utility is designed to display on the chart the margin zones built on the basis of margin requirements for futures of the Chicago Mercantile exchange (CME). These margin zones are good levels of resistance and support, as seen in the screenshots. How to use To trade on margin zones, use the following rules: buy after the day has closed above one of the zones to the next zone; sell after the day has closed below one of the zones to the next zone; after opening a sell trade, place limit sell
Floating peaks oscillator - it the manual trading system. It's based on Stochastik/RSI type of oscillator with dynamic/floating  overbought and oversold levels. When main line is green - market is under bullish pressure, when main line is red - market is under bearish pressure. Buy arrow appears at the floating bottom and sell arrow appears at floating top. Indicator allows to reverse signal types. Main indicator's adjustable inputs : mainTrendPeriod; signalTrendPeriod; smoothedTrendPeriod; tre
MTF MultiMeter5
GRANTLEY LAURENCE CAUSE
Benefits: A new and innovative way of looking across multiple timeframes and multiple indicators on any chart. Provides instant multi-timeframe analysis of any market. i.e. forex currency pairs, cryptocurrency pairs, commodities, etc. It offers precise indications across multiple timeframes of volatility as measured by RSI, ADX and STOCH within one chart. Helps you determine high probability trading setups. See example strategy in comments. Can see bullish/bearish volatility building across mult
BeST Trend Exploiter MT5
Eleni Koulocheri
5 (1)
BeST_Trend Exploiter  is a Metatrader Indicator  based on a smart proprietary algorithm which can detect the market Median Trend while it filters out the noise providing Buy and Sell Signals and also wherever it is applicable it provides us with TP Levels of High Probability. Additionally as it has Built Inside all the necessary features it can be used as a Complete Strategy of very Impressive Results. Essential Advantages of the Indicator Clear and Easily Understandable trading rules. Real
Analise Probabilistica
Valter Cezar Costa
4.71 (7)
I'm sure after a lot of research on the internet, you haven't found any indicator that can help you with forex or binary trading in the latest probability strategy created by famous trader Ronald Cutrim. The strategy is based on a simple count of green and red candles, checking for a numerical imbalance between them over a certain period of time on an investment market chart. If this imbalance is confirmed and is equal to or greater than 16%, according to trader Ronald Cutrim, creator of the pro
FREE
Session Lines
Ian Worthington
This is one of my most important indicators. Did you ever miss the session open/close? I did, which is why I made this indicator. It took a long time to get this right, since depending on your platform and timezone, it can be incorrect. It should be accurate for everyone now. It takes into account Daylight savings for NY and EU timezones, and should just work like magic on your charts.
The  Market Sessions Indicator for MT5 helps you  predict market turnarounds  by detecting major supply and demand areas. These pivot points tend to occur after a new session has started and the previous one is still open. It is also used to gauge how many points or pips the market moves on average during a session. This helps us to place better our take profits and stop losses. The indicator works on all forex pairs, gold, silver, commodities, stocks, indices and any other instrument that your
This indicator is based on the ICCI. If a long pattern is detected, the indicator displays a buy arrow. If a short pattern is detected, the indicator displays a sell arrow. Settings CCI Period - default set to (14) Features Works on all currency pairs and timeframes Draws Arrows on chart Colors Line Color Line Width Line Style Arrow Color This tool can help you analyse the market and indicates market entry.
Percent
Raphael Moretti
The indicator will plot a line on the chart that corresponds to the closing price of the previous day, and based on this, it will plot the percentage levels of change in the price of the asset in question. It can be used on any asset. Period: Determine whether the closing price should be daily, weekly or monthly Minimum percentage: Determine the percentage for the indicator to plot the levels and sub-levels on the chart, eg 0.5 it will plot on the chart a line for every 0.5% variation and the su
Strategy Manager is a  Multi-Time-Frame & Multi-Currency  Dashboard for  Metatrader 4 and 5. Thanks to a free, external graphical user interface, build your own strategy by combining any indicators and loading them into the dashboard to see the result ! In addition, you can precisely  set-up your Auto-trading & Notifications and use indicators for Stop-Loss, partial profit or limit. Filter your automatic trading & notifications with forex calendar and more. Open and Manage your orders directly w
The Asian Session - it is a Secure Automated Software for trade Forex market and indices. This system detects the ranges between the end of the American session and the beginning of the Asian session, operating in favor of the break, thinking that this break prior to the start of the session occurs because within the Asian session there will be an impulse in favor of the break. breaking off. To adapt to the different schedules of the different brokers, you have to set the closing time of the A
Plain
Ahmed Alaaeldin Abdulrahman Ahmed Elherzawi
This is a semi-automatic Expert Advisor that opens trades automatically based on the direction you set using the trade sell / buy on the panel. The magic of this EA is that it recognizes the objects that you draw on the chart by closing the open positions at key levels, it will notify you through the mobile notification, then it will wait for the next direction. It opens orders continuously regardless of the time frame of the chart. So you don't have to stay on a lower time frame. Instead, you c
该产品的买家也购买
Atomic Analyst MT5
Issam Kassas
5 (13)
首先值得强调的是,该交易指标是非重绘、非延迟的指标,这使其成为手动和机器人交易的理想选择。 用户手册:设置、输入和策略。 Atomic Analyst是一种PA价格行动指标,利用价格的力量和动量来寻找市场上更好的机会。配备了高级过滤器,可帮助去除噪音和假信号,并提高交易潜力。使用多层复杂的指标,Atomic Analyst扫描图表,并将复杂的数学计算转化为任何初学者都能理解并用来做出一致交易决策的简单信号和颜色。 “Atomic Analyst”是专为新手和经验丰富的交易者量身定制的综合交易解决方案。它将高级指标和一流功能融合为一体的交易策略,使其成为所有类型交易者的多功能选择。 日内交易和剥头皮策略:专为快速准确的日内交易和短期交易而设计。 日内和摆动交易策略:可用作追求价格大幅波动的日内和摆动交易者的可靠工具。 多货币和市场:凭借其可靠的精度,在不同的工具和市场上运作。 多个时间框架:可在多个时间框架上使用,性能良好。 稳定性:所有指标均不重绘、不重绘和不滞后,确保可靠的信号。 信号清晰度:提供箭头信号,用于清晰的入场和出场点。 实时警报:通过交易入场、SL和TP警报通知交
首先,值得强调的是,这个交易系统是一个非重绘、非重画和非滞后的指标,这使得它非常适合手动和机器人交易。 在线课程,手册和下载预设。 “智能趋势交易系统 MT5”是专为新手和经验丰富的交易者量身定制的综合交易解决方案。它结合了超过 10 个优质指标,具有 7 多个强大的交易策略,使其成为适用于各种市场条件的多功能选择。 趋势跟随策略:提供精确的入场和止损管理,以有效地跟随趋势。 反转策略:识别潜在的趋势反转,使交易者能够利用区域市场的机会。 剃头策略:专为快速准确的日内交易和短期交易而设计。 稳定性:所有指标都不会重绘、不会重画和不会滞后,确保可靠的信号。 定制:支持自定义策略,以满足个人交易偏好。超过 7 种策略和组合可帮助您找到最佳策略。 信号清晰度:提供箭头信号,以指示清晰的入场和退出点。 实时警报:通过交易进出警报使交易者保持了解。 深入分析:提供更高时间框架的趋势分析和实时交易监控。 自适应颜色编码:利用蜡烛颜色编码来显示成交量、趋势和反转蜡烛信号。通过蜡烛颜色分析市场方向。 “智能趋势交易系统 MT5”赋予交易者必要的工具,以便在各种市场条件下做出明智和战略性的交易决策。无论
Dragon Multi Indicator MT5
Mansour Babasafary
5 (2)
74% discount for the next 10 buyers (original price $605): 1 left Get a 50% bonus by buying (or even renting) any of our products. After buying (or renting), send a message for more information. 3 Indicators in 1 indicator Strategy based on price action Made specifically for the best forex currency pairs Can be used in the best time frame of the market at a very reasonable price This indicator is basically 3 different indicatos . But we have combined these 3 indicators in 1 indicator so th
Quantum Trend Sniper
Bogdan Ion Puscasu
5 (39)
介绍   量子趋势狙击指标 ,突破性的 MQL5 指标,正在改变您识别和交易趋势反转的方式!由拥有超过13年交易经验的资深交易员团队开发,     量子趋势狙击指标   旨在通过其创新的方式以极高的准确度识别趋势反转,将您的交易之旅推向新的高度。 ***购买量子趋势狙击指标,即可免费获得量子突破指标!*** 当量子突破指标识别出趋势反转时,它会向您发出警报和信号箭头,并建议您三个止盈水平。 它既适合新手交易者,也适合专业交易者。 量子 EA 通道:       点击这里 MT4版本:       点击这里 建议: 时间范围: 所有时间范围。为了获得最佳结果,我们建议在 M15、M30 和 H1 时间范围内使用它。 货币对:欧元兑美元、英镑兑美元、澳元兑美元、欧元兑英镑、, EURAUD,  XAUUSD 账户类型:ECN、Raw 或 Razor,点差极低 经纪时间:任意 经纪商:IC Markets、Pepperstone with Raw 和 Razor 的点差最低 建议止损:50 点 建议止盈水平:20 点、50 点和
TPSpro RFI Levels MT5
Roman Podpora
5 (9)
A key element in trading is zones or levels from which decisions to buy or sell a trading instrument are made. Despite attempts by major players to conceal their presence in the market, they inevitably leave traces. Our task was to learn how to identify these traces and interpret them correctly. Reversal First Impulse levels (RFI)   -  Version MT4                  INSTRUCTIONS                 RUS                 ENG                         R ecommended to use with an indicator   -  TREND PRO  
首先,值得强调的是,这个交易工具是非重绘、非重画和非滞后的指标,非常适合专业交易。 在线课程,用户手册和演示。 智能价格行动概念指标是一个非常强大的工具,既适用于新手,也适用于经验丰富的交易者。它将超过20个有用的指标合并到一个指标中,结合了高级交易思想,如内圈交易员分析和智能资金概念交易策略。该指标侧重于智能资金概念,提供有关大型机构交易方式的见解,帮助预测它们的动向。 它在流动性分析方面尤其擅长,有助于理解机构的交易方式。它擅长预测市场趋势,并仔细分析价格波动。通过将您的交易与机构策略对齐,您可以更准确地预测市场走向。该指标多才多艺,擅长分析市场结构,识别重要的订单区块,并识别各种模式。 它擅长识别BOS和CHoCH等模式,理解动量的转变,并突出显示供需强劲的关键区域。它还擅长发现强大的不平衡,并分析价格创造更高高点或更低低点的模式。如果您使用斐波那契回撤工具,该指标可以满足您的需求。它还可以识别相等的高点和低点,分析不同的时间框架,并通过仪表板显示数据。 对于使用更高级策略的交易者,该指标提供了工具,如公平价值差指标和优惠和折扣区域的识别。它特别关注高时间框架订单
FX Volume MT5
Daniel Stein
4.94 (17)
通过 mql5 和 Telegram 上 的 " 晨间简报 "获取每日市场更新,包括详细信息和屏幕截图 ! 外汇交易量(FX Volume)是第一个也是唯一一个从经纪商角度真正洞察市场情绪的交易量指标。 直接在您的图表上看到这些信息是真正改变游戏规则和突破性的交易解决方案。 受益于独特的市场数据洞察,如 比率(Ratios )显示货币多头和空头头寸的比率(百分比 比率变化 显示所选时间段内的多头比率及其百分比变化 总交易量 显示货币的总交易量(多头和空头),以手为单位 多头 交易量显示货币所有多头头寸的交易量 空头 交易量显示所有货币空头头寸的交易量 净多头 显示净多头交易量,即所有多头头寸减去所有空头头寸(以手为单位)。 净多头百分比 显示货币净多头交易量的变化 请阅读我们的基本教程 -> "如何使用外汇交易量进行交易 " 获取更多信息,如常见问题、交易技巧和教程视频,请访问我们的 外汇交易量公共信息频道 请 安装并运行 SI Connect 以建立与我们数据中心的持续连接 背景信息 我们都知道,外汇是一个分散的市场。这就是为什么我们必须打破常规思维,开发一个独
Trend Screener Pro MT5
STE S.S.COMPANY
4.87 (62)
使用趋势筛选指标释放趋势交易的力量:由模糊逻辑和多货币系统提供支持的终极趋势交易解决方案! 使用趋势筛选器(由模糊逻辑提供支持的革命性趋势指标)提升您的趋势交易。 它是一个强大的趋势跟踪指标,结合了超过 13 种高级工具和功能以及 3 种交易策略,使其成为使您的 Metatrader 成为趋势分析器的多功能选择。 限时优惠:趋势筛选指标终身仅需 50 美元。 ( 原价 125$ ) (优惠延长) 体验趋势筛选器 100% 无需重新绘制的准确性,确保您的交易决策不受过去价格变化的影响。 释放多时间框架和多货币功能的多功能性,使您能够以无与伦比的信心在外汇、商品、加密货币和指数领域进行交易。 利用 Trend Screener 的综合策略套件增强您的交易: - 趋势跟踪策略和趋势延续策略 :趋势筛选器的趋势跟踪策略提供清晰的趋势延续信号,让您有效捕捉趋势走势并管理风险。 - 反转策略和早期入场点策略 :趋势筛选器的反转策略可检测市场方向的潜在变化,使您能够预测趋势反转并利用疲弱的市场趋势。通过早期入场点,您可以在潜在的趋势变化之前定位自己 获取可观的利润。 - 倒卖策略: 趋势筛选器的倒卖
RelicusRoad Pro MT5
Relicus LLC
4.82 (22)
现在$ 147(更新后增加到$ 499) - 无限帐户(PC或Mac) RelicusRoad 用户手册 + 培训视频 + 访问 Private Discord Group + VIP 身份 一种看待市场的新方式 RelicusRoad 是世界上最强大的外汇、期货、加密货币、股票和指数交易指标,为交易者提供保持盈利所需的所有信息和工具。我们提供技术分析和交易计划,帮助每一位交易者取得成功,从初学者到高级。它是一个关键的交易指标,可以提供足够的信息来预测未来的市场。我们相信一个完整的解决方案,而不是图表上几个没有意义的不同指标。这是一个多合一指标,显示无与伦比且非常准确的信号、箭头 + 价格行为信息。 RelicusRoad 基于强大的人工智能,提供缺失的信息和工具来教育您并使您成为交易专家,成为成功的交易者。 几乎所有技术指标都滞后,这意味着它们只能报告已经发生的事情。因此,他们只确认您过去可以看到的价格已经在哪里。我们相信领先指标可以预测未来价格,而无需重新绘制,也不要过度依赖可能改变并导致重新绘制的滞后指标。如果您根据滞后指标进行交易并建立头寸,您就知道您已
Quantum Heiken Ashi PRO MT5
Bogdan Ion Puscasu
4.5 (8)
Quantum Heiken Ashi PRO 简介 Heiken Ashi 蜡烛旨在提供对市场趋势的清晰洞察,以其过滤噪音和消除虚假信号的能力而闻名。告别令人困惑的价格波动,迎接更流畅、更可靠的图表表示。 Quantum Heiken Ashi PRO 的真正独特之处在于其创新公式,它将传统烛台数据转换为易于阅读的彩色条。红色和绿色条分别优雅地突出了看跌和看涨趋势,让您能够以非凡的精度发现潜在的进入和退出点。 量子 EA 通道:       点击这里 MT4版本:       点击这里 这一卓越的指标具有以下几个关键优势: 增强清晰度:通过平滑价格波动,Heiken Ashi 金条可以更清晰地反映市场趋势,使您更容易识别有利的交易机会。 减少噪音:告别经常导致错误信号的不稳定价格变动。 Quantum Heiken Ashi 指标可过滤噪音,使您能够做出更明智的交易决策 无缝集成:Heiken Ashi 指标专为 MetaTrader 开发,可无缝集成到您的交易平台中。它用户友好、高度可定制,并且与您的其他交易指标和过滤器兼容 无论您是寻求新优势的经验丰富的交易者,
ICT, SMC, SMART MONEY CONCEPTS, SMART MONEY, Smart Money Concept, Support and Resistance, Trend Analysis, Price Action, Market Structure, Order Blocks, BOS/CHoCH,   Breaker Blocks ,  Momentum Shift,   Supply&Demand Zone/Order Blocks , Strong Imbalance,   HH/LL/HL/LH,    Fair Value Gap, FVG,  Premium  &   Discount   Zones, Fibonacci Retracement, OTE, Buy Side Liquidity, Sell Side Liquidity, BSL/SSL Taken, Equal Highs & Lows, MTF Dashboard, Multiple Time Frame, BigBar, HTF OB, HTF Market Structure
Professional Scalping Tool on Deriv Attention! The indicator will be sold in limited quantities!!! The previous 5 copies were sold for $250 The remaining 4 copies will be sold for $350 The next price is $500 Description: This trading indicator is designed for professional traders focused on scalping. Designed with the market in mind, it provides highly accurate spike trading signals. It works on the M1 timeframe and supports the following symbols: Boom 300 Index, Boom 500 Index, Boom 1000 I
AW Trend Predictor MT5
AW Trading Software Limited
4.77 (56)
一个系统中趋势和故障水平的组合。先进的指标算法过滤市场噪音,确定趋势、进入点以及可能的退出水平。指标信号记录在统计模块中,您可以选择最合适的工具,显示信号历史的有效性。该指标计算获利和止损标记。 手册和说明 ->   这里 / MT4 版本 ->   这里 如何使用指标进行交易: 使用趋势预测器进行交易只需三个简单的步骤: 第 1 步 - 开仓 收到买入信号,成功率超过 70% 第 2 步 - 确定止损 通过相反的信号选择中继线 第 3 步 - 定义止盈策略 策略一:达到 TP1 时平仓 策略 2:达到 TP1 时平仓 50%,达到 TP2 时平仓剩余 50% 策略三:在趋势反转时平仓 好处: 从不重绘结果,信号严格位于蜡烛收盘时 它可以在顾问中使用 获利和止损标记 对交易策略或独立策略的重要补充 市场噪音过滤算法 适用于任何工具 统计模块: 为了更好地选择配对,请使用内置的统计计算。 计算交易 - 给出统计数据的信号总数 成功评级 - 达到 TP1 的信号百分比,或反转那些正获利的信号时的百分比 TakeProfit1 Hit - 达到 TP1 的信号百分比 TakeProfit2
IX Power MT5
Daniel Stein
5 (3)
IX Power 终于将 FX Power 的无与伦比的精确性带到了非外汇交易符号中。 它能准确判断您喜爱的指数、股票、商品、ETF 甚至加密货币的短期、中期和长期趋势强度。 您可以 分析 终端提供的 一切 。试试吧,体验一下您在交易时如何把握 时机 。 IX Power 主要功能 100% 精确的非重绘计算结果 - 适用于您终端中的所有交易符号 下拉式选择预配置以及可单独配置的强度分析周期 通过电子邮件、消息和手机通知的无数种通知选项 可访问的 EA 请求缓冲区 可自定义计算限制,以获得更好的性能 为希望查看更多信息的用户提供特殊的多实例设置 无尽的图形设置,让您在每个图表中都能找到最喜欢的颜色 采用 Windows 11 和 macOS 风格的圆角新面板设计 神奇的移动指标面板,可在子窗口和主图表之间无缝移动 适用于高分辨率 QHD、UHD 和 4K 显示器,并针对平板电脑和触摸屏进行了优化 IX Power 参数 最重要的参数不言自明,但我们很快会在另一篇文章中为您提供所有 IX Power 参数的完整说明。 使用别名 "参数可为技术交易符号
FX Power MT5 NG
Daniel Stein
5 (5)
通过 mql5 和 Telegram 上 的晨间简报获取每日市场更新,包括详细信息和屏幕截图 ! FX Power MT5 NG 是我们长期以来非常受欢迎的货币强度计算器 FX Power 的下一代产品。 这款下一代强度计算器能提供什么?您所喜爱的原版 FX Power 的所有功能 附加功能 黄金/XAU 强度分析 更精确的计算结果 可单独配置的分析周期 可自定义计算限制,以获得更好的性能 为希望查看更多信息的用户提供特殊的多实例设置 无尽的图形设置,可在每个图表中设置您最喜欢的颜色 无数的通知选项,让您再也不会错过任何重要信息 采用 Windows 11 和 macOS 风格的全新圆角设计 神奇的移动指标面板 FX Power 主要功能 所有主要货币的完整强势历史 所有时间框架内的货币强弱历史 所有经纪商和图表的计算结果完全相同 100% 可靠的实时计算 -> 无重绘 可通过下拉列表选择分析时段 通过自定义模式单独配置分析时段 可在一个图表中使用多个实例 可移动 FX Power 显示屏(通过拖放) 适用于高分辨率 QHD、UHD 和 4K 显示器 自动终端配置 针对平板电脑
介绍     Quantum Breakout PRO   ,突破性的 MQL5 指标,正在改变您交易突破区域的方式!由拥有超过13年交易经验的资深交易员团队开发,     量子突破 PRO     旨在通过其创新和动态的突破区域策略将您的交易之旅推向新的高度。 量子突破指标将为您提供带有 5 个利润目标区域的突破区域的信号箭头,以及基于突破框的止损建议。 它既适合新手交易者,也适合专业交易者。 量子 EA 通道:       点击这里 重要的!购买后请私信我领取安装手册。 建议: 时间范围:M15 货币对:GBPJPY、EURJPY、USDJPY、NZDUSD、XAUUSD 账户类型:ECN、Raw 或 Razor,点差极低 经纪商时间:GMT +3 经纪商:IC Markets、Pepperstone with Raw 和 Razor 的点差最低 规格: 不重漆! 最多 5 个建议利润目标区域 建议止损水平 可定制的盒子。您可以设置自己的 Box Time Start 和 Box Time End。 接触 如果您有任何疑问或需要帮
成為突破者,隨著價格反轉,市場結構會改變利潤。 訂單突破者指示器可以識別趨勢或價格走勢何時接近枯竭並準備好逆轉。它會提醒您市場結構的變化,通常會在發生逆轉或重大回調時發生。 該指標使用專有計算來確定突破和價格動能。每當在可能的耗盡點附近形成新的高點時,指標就會繪製最後一個生成該高點的順序塊。然後,它將隨價格移動隨價格跟隨定單。然後,當價格轉向相反方向並突破該訂單塊時,它會提醒您,從而創建新的市場結構並開始趨勢或重大回調的可能逆轉。 訂單塊是在創建高/低之前的最後一個相反的彩色蠟燭,並且當價格跌破這些關鍵區域以下時,這表明趨勢可能會發生短期或長期反轉。 特徵 提醒您關鍵耗盡點的市場結構變化 價格接近耗盡水平時自動提取訂單塊 在一個方向繼續移動時,在價格後面跟踪定單,以提醒您最佳的反轉輸入 將顏色更改為純色塊,以顯示何時發生市場結構中斷。 適用於所有交易品種和時間範圍 內置集成的彈出窗口和電子郵件警報 策略和如何與定單破壞者指標進行交易 當斷路器塊發生時,您有兩個選擇。 看左邊!我們正在尋求供應/需求或支撐/阻力位嗎?市場結構轉變(逆轉)通常發生在價格重新測試舊水平或
Introducing the South African Sniper indicator created by a small group of traders with a few years trading trading the financial market profitably . This is a plug and play indicator that provides you with  BUY and SELL (SNIPER ENTRY) signals with TARGET and trail stops. The indicator Works with all MT5 trading instruments. The indicator uses previous  chart data as receipt to speculate on future market moves.
Blahtech Market Profile MT5
Blahtech Limited
5 (8)
Was: $249  Now: $99   Market Profile defines a number of day types that can help the trader to determine market behaviour. A key feature is the Value Area, representing the range of price action where 70% of trading took place. Understanding the Value Area can give traders valuable insight into market direction and establish the higher odds trade. It is an excellent addition to any system you may be using. Inspired by Jim Dalton’s book “Mind Over Markets”, this indicator is designed to suit the
ADR 反轉指標一目了然地顯示當前價格相對於其正常平均每日範圍的交易位置。當價格超過您選擇的平均範圍和高於它的水平時,您將通過彈出窗口、電子郵件或推送獲得即時警報,以便您可以快速跳入回調和反轉。該指標在圖表上在平均每日範圍極值處繪製水平線,並在這些水平之上延伸,這些水平附加了價格超過它們的數學概率。下面的更多細節...... ADR 警報儀表板補充指標並監控所有配對也可在此處獲得: https://www.mql5.com/en/market/product/66316 MT4 版本也可在此處獲得: https://www.mql5.com/en/market/product/62757 大約 60% 的時間價格在其正常的平均每日範圍 (ADR) 內交易並推高這些水平通常是價格急劇波動的指標,通常會出現回調(獲利了結)走勢。您可以通過交易從每日範圍的頂部或底部回落到最近的支撐位或阻力位來利用這些急劇波動。 收集了超過 20 年的歷史數據,以找出主要外匯對和一系列交叉盤的價格超出特定 ADR 水平的平均百分比。該數據表明價格僅在 3% 的時間內超過其 ADR 的 200%,
TrendDecoder Premium MT5
Christophe, Pa Trouillas
5 (2)
确定范围和下一步可能的走势    |     获得早期信号和趋势强度   |     在反转之前获得明确的退出   |     了解价格将测试哪些斐波水平   |  非重绘、非延迟指标 - 手动和自动交易的理想选择 - 适用于所有资产和所有时间单位 推出时为   69 美元 --然后恢复到 >>   149 美元 购买后,  请联系我的频道  获取推荐设置 MT4 版本: 点击此处 使用 BladeSCALPER 和 PowerZONES 获取我们的完整方法 它是什么? TrendDECODER 集多种创新于一身,使趋势监测变得简单易行。 投射趋势线(Projective TrendLine )--快速参考即将到来的趋势 实时趋势线(RealTime TrendLine) 与投射趋势线(Projective TrendLine)的对比 - 与之前的同方向走势相比,市场是加速还是放缓? 实时趋势线交叉 -   趋势正在偏离轨道 使用 GreyBox -   市场不再是趋势并进入新的过渡序列 使用 DecoderSignals 和 Blue/Orange Clouds
Auto Order Block with break of structure based on ICT and Smart Money Concepts Futures Break of Structure ( BoS )             Order block ( OB )            Higher time frame Order block / Point of Interest ( POI )    shown on current chart           Fair value Gap ( FVG ) / Imbalance   ,  MTF      ( Multi Time Frame )    Volume Imbalance     ,  MTF          vIMB Gap’s Equal High / Low’s     ,  MTF             EQH / EQL Liquidity               Current Day High / Low           HOD /
Entry Points Pro for MT5
Yury Orlov
4.55 (159)
这款指标用于 MT5,可提供准确的入场交易信号,且无重绘。 它可应用在任何金融资产:外汇、加密货币、贵金属、股票、指数。 它将提供极其精准的评估,并告诉您何时开仓和平仓的最佳时机。 观看 视频 (6:22),其中包含一个仅处理单一信号的示例,该信号即可值回指标购价! 大多数交易者在 Entry Points Pro 指标的帮助下,在第一个交易周内即改善了他们的交易结果。 订阅我们的 Telegram 群 ! Entry Points Pro 指标的益处。 入场信号无重绘 如果信号出现,并得到确认,则它不会再消失;不像是重绘指标,它会导致重大的财产损失,因为它们可以在显示信号后再将其删除。 无差错开仓 指标算法可令您找到入场交易(买入或卖出资产)的理想时机,从而提高每位交易者的成功率。 Entry Points Pro 可操作任何资产 它允许您在 MT5 平台上交易任何经纪商的加密货币、股票、贵金属、指数、大宗商品和货币。 提供任何方向的信号 Entry Points Pro 指标提供针对任意价格走势的入场交易信号 - 上涨、下跌或横盘(横向)。
Blahtech Supply Demand MT5
Blahtech Limited
4.57 (14)
Was: $299  Now: $99   Supply Demand uses previous price action to identify potential imbalances between buyers and sellers. The key is to identify the better odds zones, not just the untouched ones. Blahtech Supply Demand indicator delivers functionality previously unavailable on any trading platform. This 4-in-1 indicator not only highlights the higher probability zones using a multi-criteria strength engine, but also combines it with multi-timeframe trend analysis, previously confirmed swings
Advanced Supply Demand MT5
Bernhard Schweigert
4.53 (15)
任何新手或专业交易者的最佳解决方案! 该指标是一款独特、高质量、且价格合理的交易工具,因为我们已经整合了许多专有功能和新公式。 依据此更新,您将能够显示双重时间帧区域。 您不仅可以显示一个较高的时间帧,还可以同时显示图表时间帧,加上更高的时间帧:显示嵌套时区。 供需双方所有交易者都会喜欢它。 :) 重要信息披露 高级供需的最大潜力,请访问 https://www.mql5.com/zh/blogs/post/720245   想象您的交易如何得以改善,是因为您能够精准定位入场或目标位吗? 构建于新的底层算法,它可以更轻松地识别出买卖双方之间的潜在失衡。 这是因为它以图形方式展示供需最强劲区域,及其过去的表现(显示旧区域)。 这些功能旨在帮助您更轻松地发现最佳入场区域和价位。 现在您可以针对您的交易品种和时间帧来优化和编辑区域强度! 高级供需指标适用于所有产品和时间帧。 它是一个新的公式,非常新的功能是两个区域强度函数可由用户输入进行调整! 这在交易中是一大优势。 当您学习如何使用专有功能,例如带有价格游离最小 X 因子的区域强度时,您能够判断该区域强劲与否。 供需区域用作警报触发器
首先值得强调的是,这个交易系统是一个不重绘、不重画和不滞后的指标,这使它非常适合专业交易。 在线课程,用户手册和演示。 “智能支撑和阻力交易系统”是专为新手和经验丰富的交易者量身定制的先进指标。它赋予交易者在外汇市场上精确和自信的能力。这个综合系统结合了7+种策略、10个指标和各种交易方法,包括日内交易策略、波段交易策略、支撑和阻力策略、蜡烛图模式策略、VWAP策略、多时间段趋势策略等。它提供箭头信号、入场和出场点、交易警报、更高时间框架的趋势分析、实时交易监控以及见解深刻的趋势和成交量蜡烛染色。通过自动支撑和阻力检测,这是一个多面手的指标,帮助交易者在不同的市场条件下做出明智的决策。 “智能支撑和阻力交易系统”是一个强大的技术分析方法,融合了一套高端和强大的指标和工具。在其核心,这个系统识别关键的支撑和阻力水平,这些水平作为潜在市场反转或延续的关键区域。该系统无缝集成了多时间框架趋势面板,增强了交易者在不同时间框架下评估当前趋势方向的能力。此外,蜡烛图模式检测器扫描价格图表以获取重要的蜡烛图模式,为潜在的市场走势提供宝贵的见解。此外,VWAP(成交量加权平均价格)的加入
Trend Forecaster
Alexey Minkov
5 (3)
The Trend Forecaster indicator utilizes a unique proprietary algorithm to determine entry points for a breakout trading strategy. The indicator identifies price clusters, analyzes price movement near levels, and provides a signal when the price breaks through a level. The Trend Forecaster indicator is suitable for all financial assets, including currencies (Forex), metals, stocks, indices, and cryptocurrencies. You can also adjust the indicator to work on any time frames, although it is recommen
Gartley Hunter Multi
Siarhei Vashchylka
5 (6)
Gartley Hunter Multi - An indicator for searching for harmonic patterns simultaneously on dozens of trading instruments and on all classic timeframes: (m1, m5, m15, m30, H1, H4, D1, Wk, Mn). Manual (Be sure to read before purchasing) | Version for MT4 Advantages 1. Patterns: Gartley, Butterfly, Shark, Crab. Bat, Alternate Bat, Deep Crab, Cypher 2. Simultaneous search for patterns on dozens of trading instruments and on all classic timeframes 3. Search for patterns of all possible sizes. Fr
Wolfe Waves是所有金融市场中自然发生的交易模式,代表着争取均衡价格的斗争。这些模式可以在短期和长期时间内发展,并且是存在的最可靠的预测反转模式之一,通常早于强劲和长期的价格波动。 [ 安装指南 | 更新指南 | 故障排除 | 常见问题 | 所有产品 ] 清除交易信号 极易交易 可自定义的颜色和尺寸 实施绩效统计 显示适当的止损和获利水平 它实现了电子邮件/声音/视觉警报 指示器同时绘制图案和突破箭头,以防止指示器在展开时重新绘制图案。但是,如果输入突破发生多次,则可能会少量重绘(不是很频繁),从而导致指示器重新绘制。该指示器为非底漆。 狼波的定义 沃尔夫波必须具有以下特征。 波浪3-4必须停留在1-2创建的通道内 波浪4在波浪1-2产生的通道内 波动5超出了波动1和3所创建的趋势线 输入参数 幅度-幅度表示替代价格点之间的最小柱线量。要找到大图案,请增加幅度参数。要查找较小的模式,请减小幅度参数。您可以在图表中多次加载指标,以查找不同大小的重叠图案。 突破期-可选的Donchian突破期,用于确认Wolfe Wave。零表示未使用。 最大历史柱线-指标
作者的更多信息
inp_timeframe: Set Timeframe of indicator MA Parameters: (Same as standard moving average indicator) inp_MA_period, inp_MA_shift, inp_MA_method, inp_MA_price: Moving Average Period, Moving Average Shift, Moving Average Method, Moving Average Price Please take note that using a MA_shift of 0 will result in a different result when the indicator is reloaded for higher time frame This indicator only accepts shift>0 This is due to the indicator showing the current time moving average and atr at the c
place a vwap line starting from the line placed on the chart parameters: tick_mode: enable to use ticks instead of bars. this uses a lot more cpu processing power prefix: prefix to add for line created by indicator line_color: set the color of the line created line_style: set the line style of the line created applied_price: set the price of bar to use of the bar std_dev_ratio: set the multiplier for the std dev channel
筛选:
无评论
回复评论