Standard Deviation Channel Dashboard for MT5
- 指标
- Taras Slobodyanik
- 版本: 2.40
- 更新: 14 三月 2024
- 激活: 10
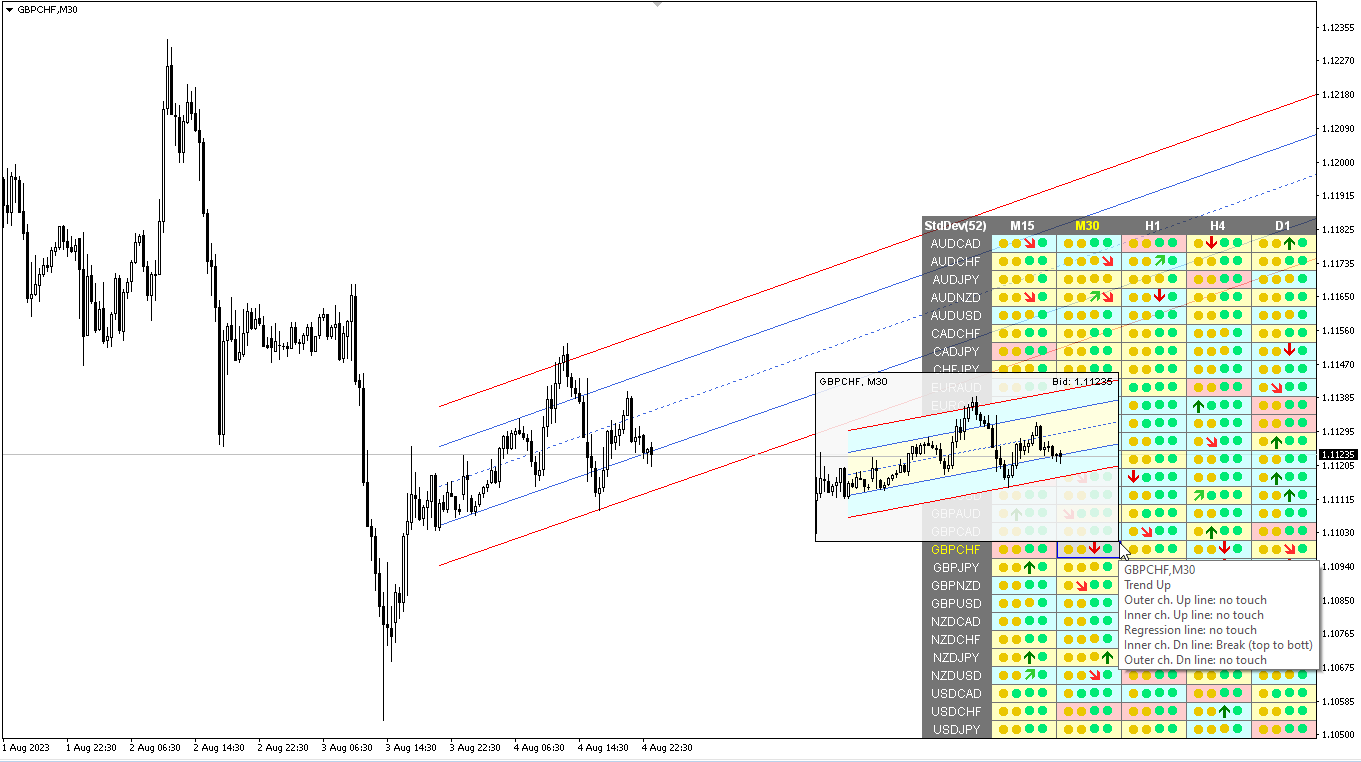
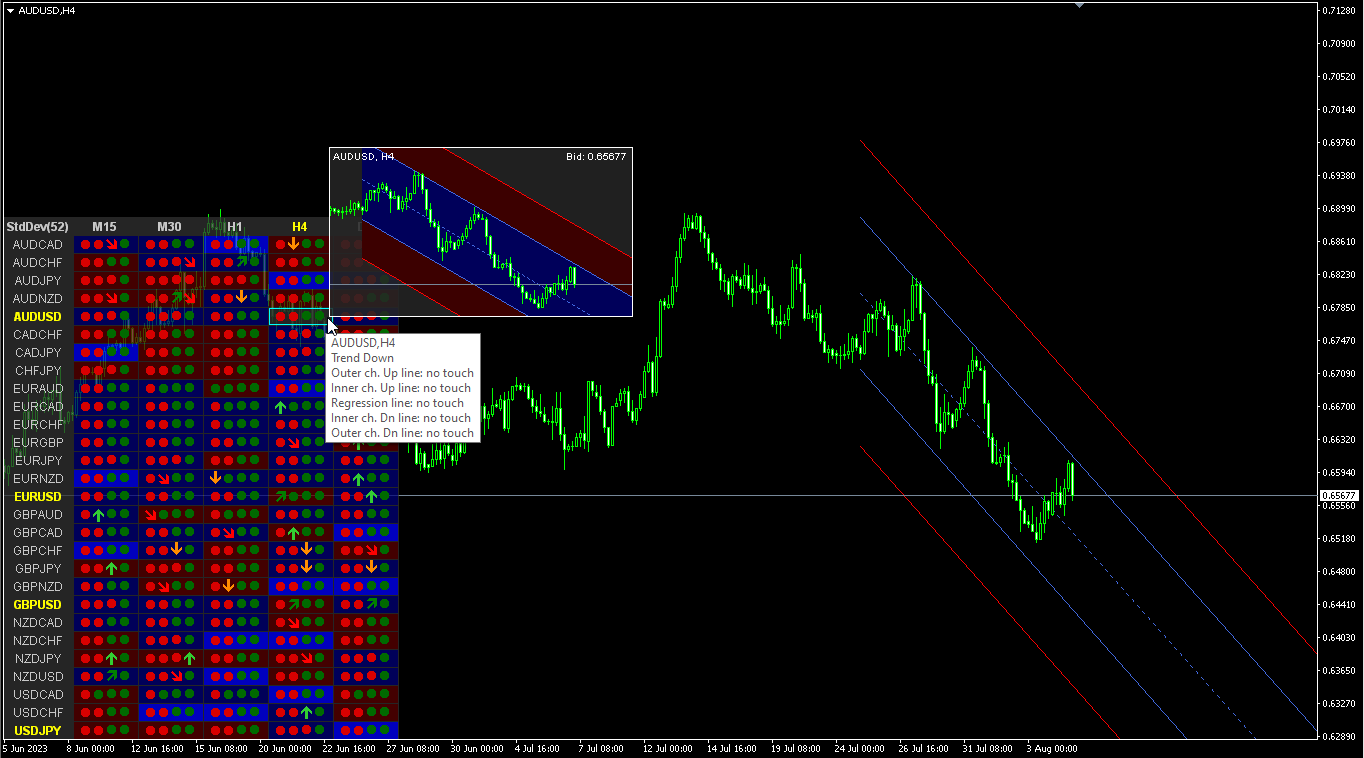
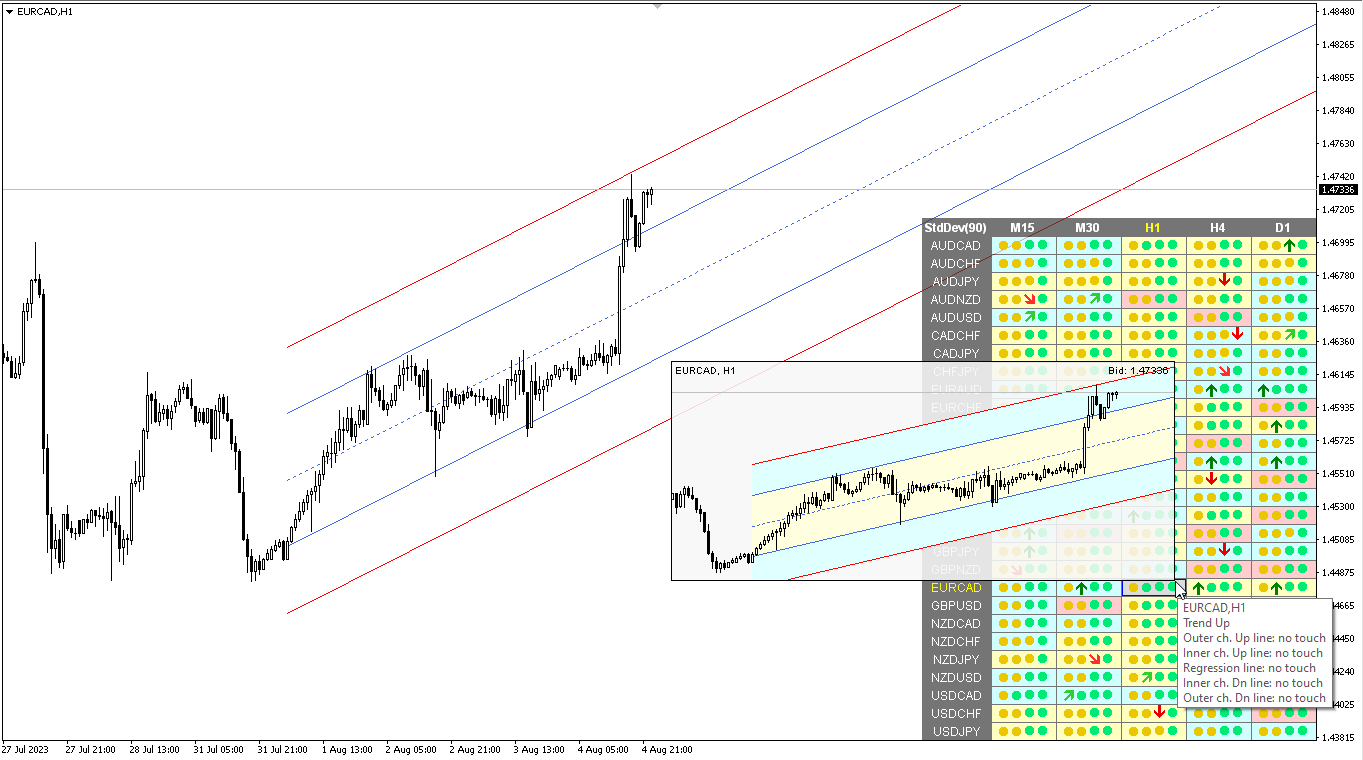
标准偏差通道的多货币和多时间框架指标。 显示市场的当前方向。 在面板上,您可以看到线性回归通道水平的突破和触及(按价格)。 在参数中,您可以指定任何所需的货币和时间范围。 此外,该指标还可以在触及水平时发送通知。 通过单击单元格,将打开该符号和句点。 这是 MTF 扫描仪。
默认情况下,从图表中隐藏仪表板的键是“D”。
«标准偏差通道建立在线性回归趋势的基础上,代表使用最小二乘法在价格图表上的两点之间构建的常见趋势线。 结果,这条线被证明是价格变化的确切中线。 它可以被视为一条均衡价格线,任何向上或向下的偏转分别表明买家或卖家的超活跃性。
标准偏差通道由两条平行线组成,与线性回归趋势上下等距。 通道框架与回归线之间的距离等于收盘价与回归线的标准差值。 所有价格变化都发生在标准偏差通道内,其中下框作为支撑线,上框作为阻力线。 价格通常会在短时间内超过通道框架。 如果它们在通道框架之外停留的时间比平时更长,则预测趋势转向的可能性»
标准偏差通道由两条平行线组成,与线性回归趋势上下等距。 通道框架与回归线之间的距离等于收盘价与回归线的标准差值。 所有价格变化都发生在标准偏差通道内,其中下框作为支撑线,上框作为阻力线。 价格通常会在短时间内超过通道框架。 如果它们在通道框架之外停留的时间比平时更长,则预测趋势转向的可能性»
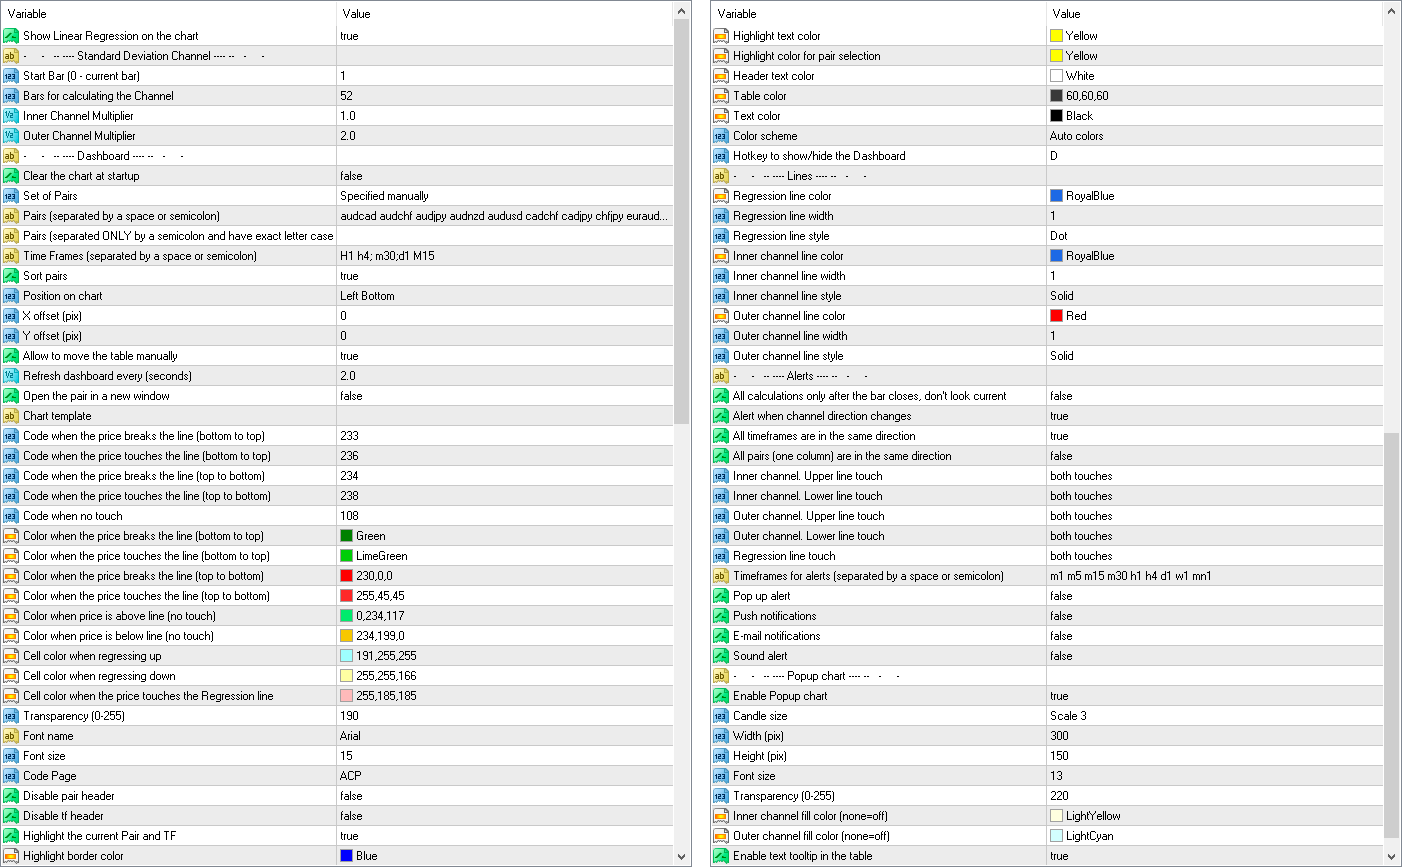
参数
Show Linear Regression on the chart — 在当前图表上绘制标准偏差通道。
Standard Deviation Channel — 标准差通道
StartBar (0 - current bar) — 开始线性回归计算的蜡烛。 零 - 当前柱,回归将在每个价格变动时更新。
Bars for Calculation — 要计算的蜡烛数量。
Inner Channel Multiplier — 用于绘制内部通道的乘数。
Outer Channel Multiplier — 用于绘制外部通道的乘数。
仪表板
Clear the chart at startup — 启动时清除图表。
Set of Pairs — 符号集
— Market Watch — 来自“市场观察”的货币对;— Specified manually — 在参数“Pairs”中手动指定对。— Current pair — 仅显示当前对。
Pairs (separated by a space or semicolon) — 由空格或分号分隔的符号列表。 货币名称的书写方式应与经纪商的名称完全相同,并保留大小写和前缀/后缀。
Time Frames (separated by a space or semicolon) — 由空格或分号分隔的时间范围列表(多个时间范围)。
Sort pairs — 对对列表进行排序。
Position on chart — 在图表上显示面板的角落。
X offset (pix) — 沿 X 轴移动面板;
Y offset (pix) — 沿 Y 轴移动面板;
Refresh dashboard every (seconds) — 所有货币对和时间范围的更新周期。
Open the pair in a new window — 通过单击在新图表窗口中打开交易品种。
Chart template — 图表模板的名称(如果图表在新窗口中打开)。
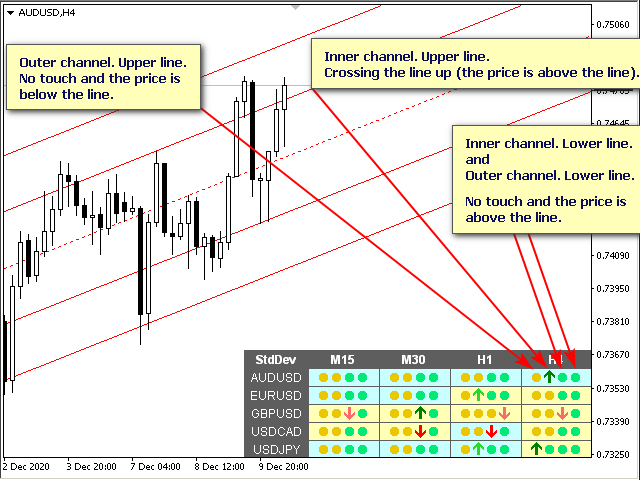
Code when cross from bottom to top (price above line) — 从下到上交叉时的代码(价格高于线);
Code when cross from top to bottom (price below line) — 从上到下交叉时的代码(价格在线下方);
Code when no touch — 无触摸时编码;
Color when cross from bottom to top (price above line) — 从下到上交叉时的颜色(线上方的价格);
Color when cross from top to bottom (price below line) — 从上到下交叉时的颜色(价格低于线);
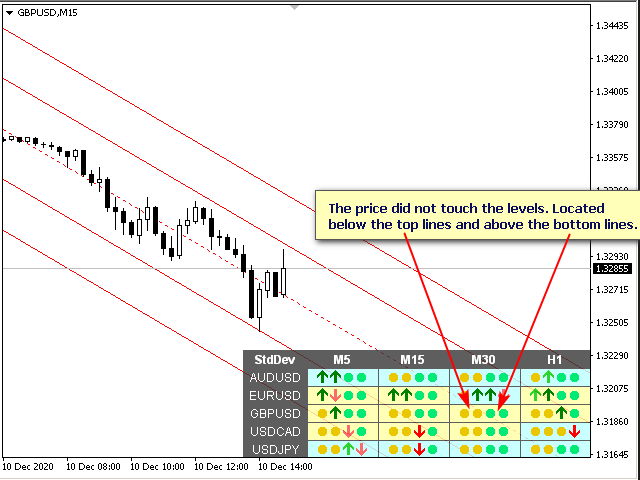
Color when price is above line (no touch) — 价格高于线时显示颜色(无触摸);
Color when price is below line (no touch) — 价格低于线时显示颜色(无触摸);
Cell color when regressing up — 通道向上时单元格的颜色。 (也许 clrNONE);
Cell color when regressing down — 通道指向下方时单元格的颜色。 (也许 clrNONE);
Transparency (0-255) — 透明度(0-255);
Font name — 字体名称;
Font size — 字体大小;
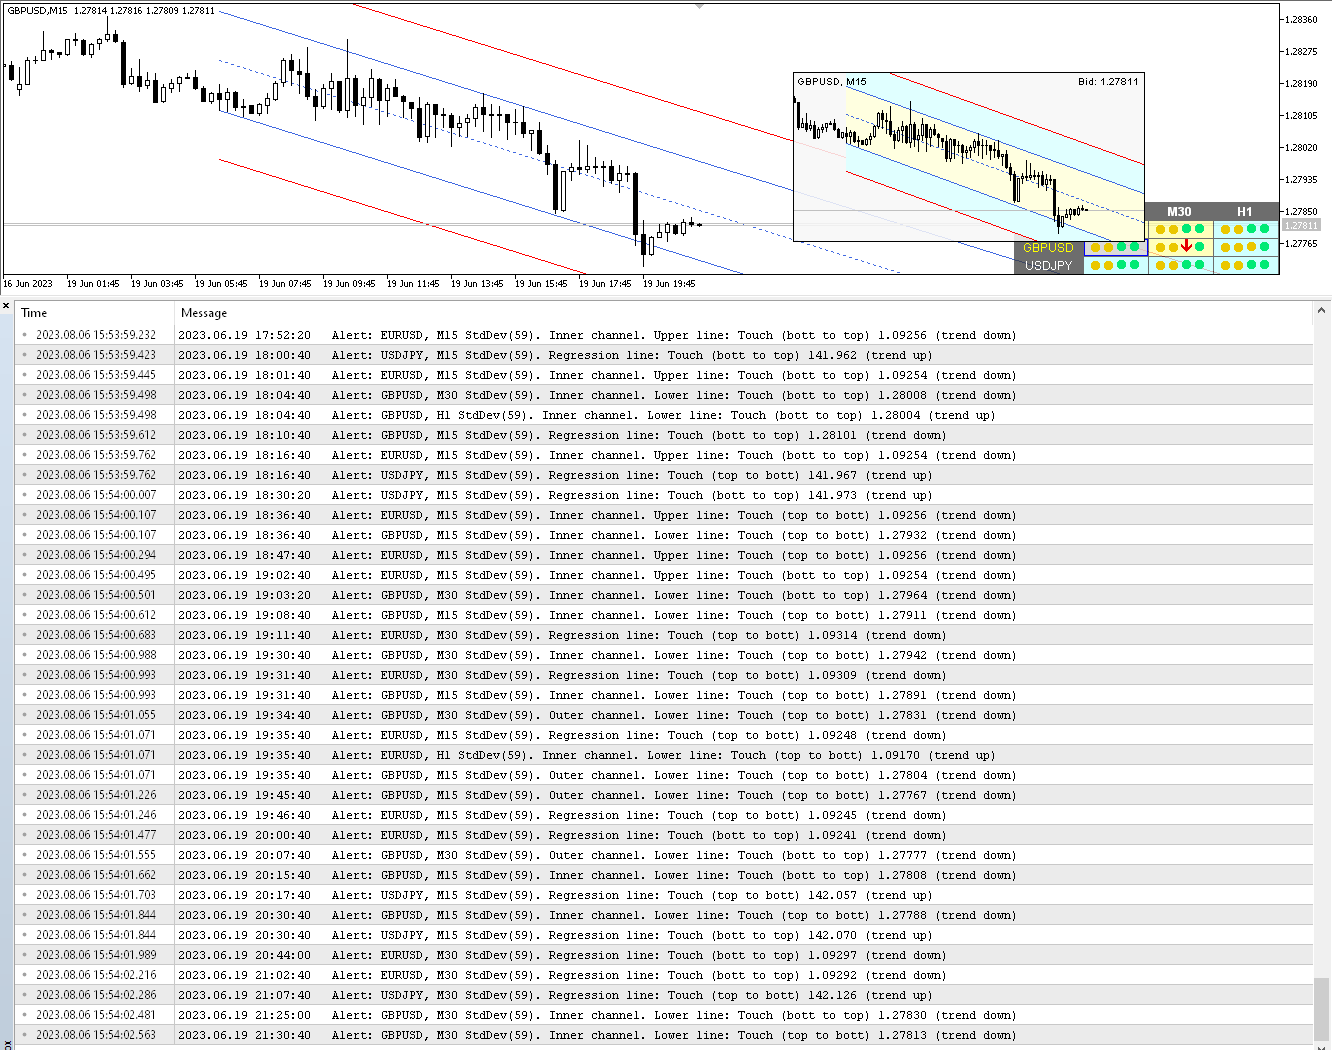
警报
Alert when channel direction changes — 通道方向改变时发出警报;
All timeframes are in the same direction — 所有时间范围都朝同一方向;
All pairs (one column) are in the same direction — 所有对(一列)的方向相同;
Inner channel. Upper line touch — 内通道。 上线触碰;
Inner channel. Lower line touch — 内通道。 下线触感;
Outer channel. Upper line touch — 外通道。 上线触碰;
Outer channel. Lower line touch — 外通道。 下线触感;
Check alerts only when the candle is closed — 仅在蜡烛关闭时检查警报;
Timeframes for alerts (separated by a space or semicolon) — 警报的时间范围(用空格或分号分隔);