版本 2.3
2023.08.31
*** Please always make a backup of the existing indicator (the .ex5 file) before you make an update ***
Change log:
- bug fix
版本 2.2
2021.12.20
*** Please always make a backup of the existing indicator (the .ex5 file) before you make an update ***
- added a possibility to use the indicator in single chart mode (checking only one symbol and time frame). It will then draw the patterns on the chart where the indicator is running. This option is in some ways limited though. More information in the product's blog.
- the buy/sell stop offset for the line drawings can now also be calculated based on the ATR indicator
- added the possibility to set the background and text colors in the panel
- added if bullish or bearish to the alert in breakout mode
- other various minor changes and fixes
版本 2.1
2020.07.11
- bug fix
版本 2.0
2020.07.08
- added the possibility to wait for a formation breakout before alerting
- added the possibility to set a custom alert text for alerts (not in the panel). The custom text will be added to the end of the regular alert text
- the indicator can now be used with my Signal EA (if the breakout logic has been enabled in the indicator): https://www.mql5.com/en/market/product/43820
版本 1.9
2020.01.21
- the buy/sell stop offset points for the line drawings can now also be calculated based on Average daily range (ADR)
版本 1.8
2019.12.26
- added an option to enable drawing of buy/sell lines and suggested TP/SL levels (based on ATR multiplier). Please see screenshot #5 under the product description.
版本 1.7
2019.11.20
- added the possibility to write the signals in the panel to a file. Could for instance be used by an Expert Advisor for automatical trading
版本 1.6
2019.09.16
- added an option to ignore wicks. More useful for inside bars than pennants and triangles
- added an option to disable scanning of pennants and triangles (only inside bars will be scanned)
版本 1.5
2019.03.24
- added the possibility to set minimum and/or maximum candle size for the master (first) bar in a inside bars formation
版本 1.3
2019.02.17
- lines will now be drawn on the chart which is opened when you click on a Pennant/triangle signal in the panel. This in order to
to better visualize the formation
- added an option to use symbols from the Market Watch window instead of the symbols written in the Symbols parameter
版本 1.1
2018.05.31
- added support for the strategy tester
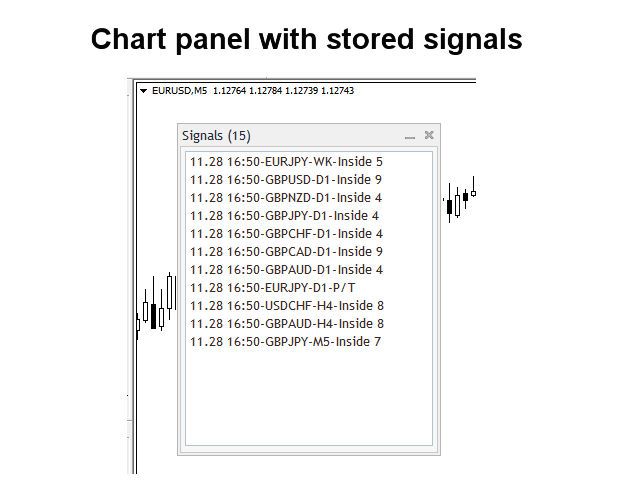
- added an on-chart panel for showing signals

