• 概述
  • 评论
  • 评论

Cobra Levels

眼镜蛇等级

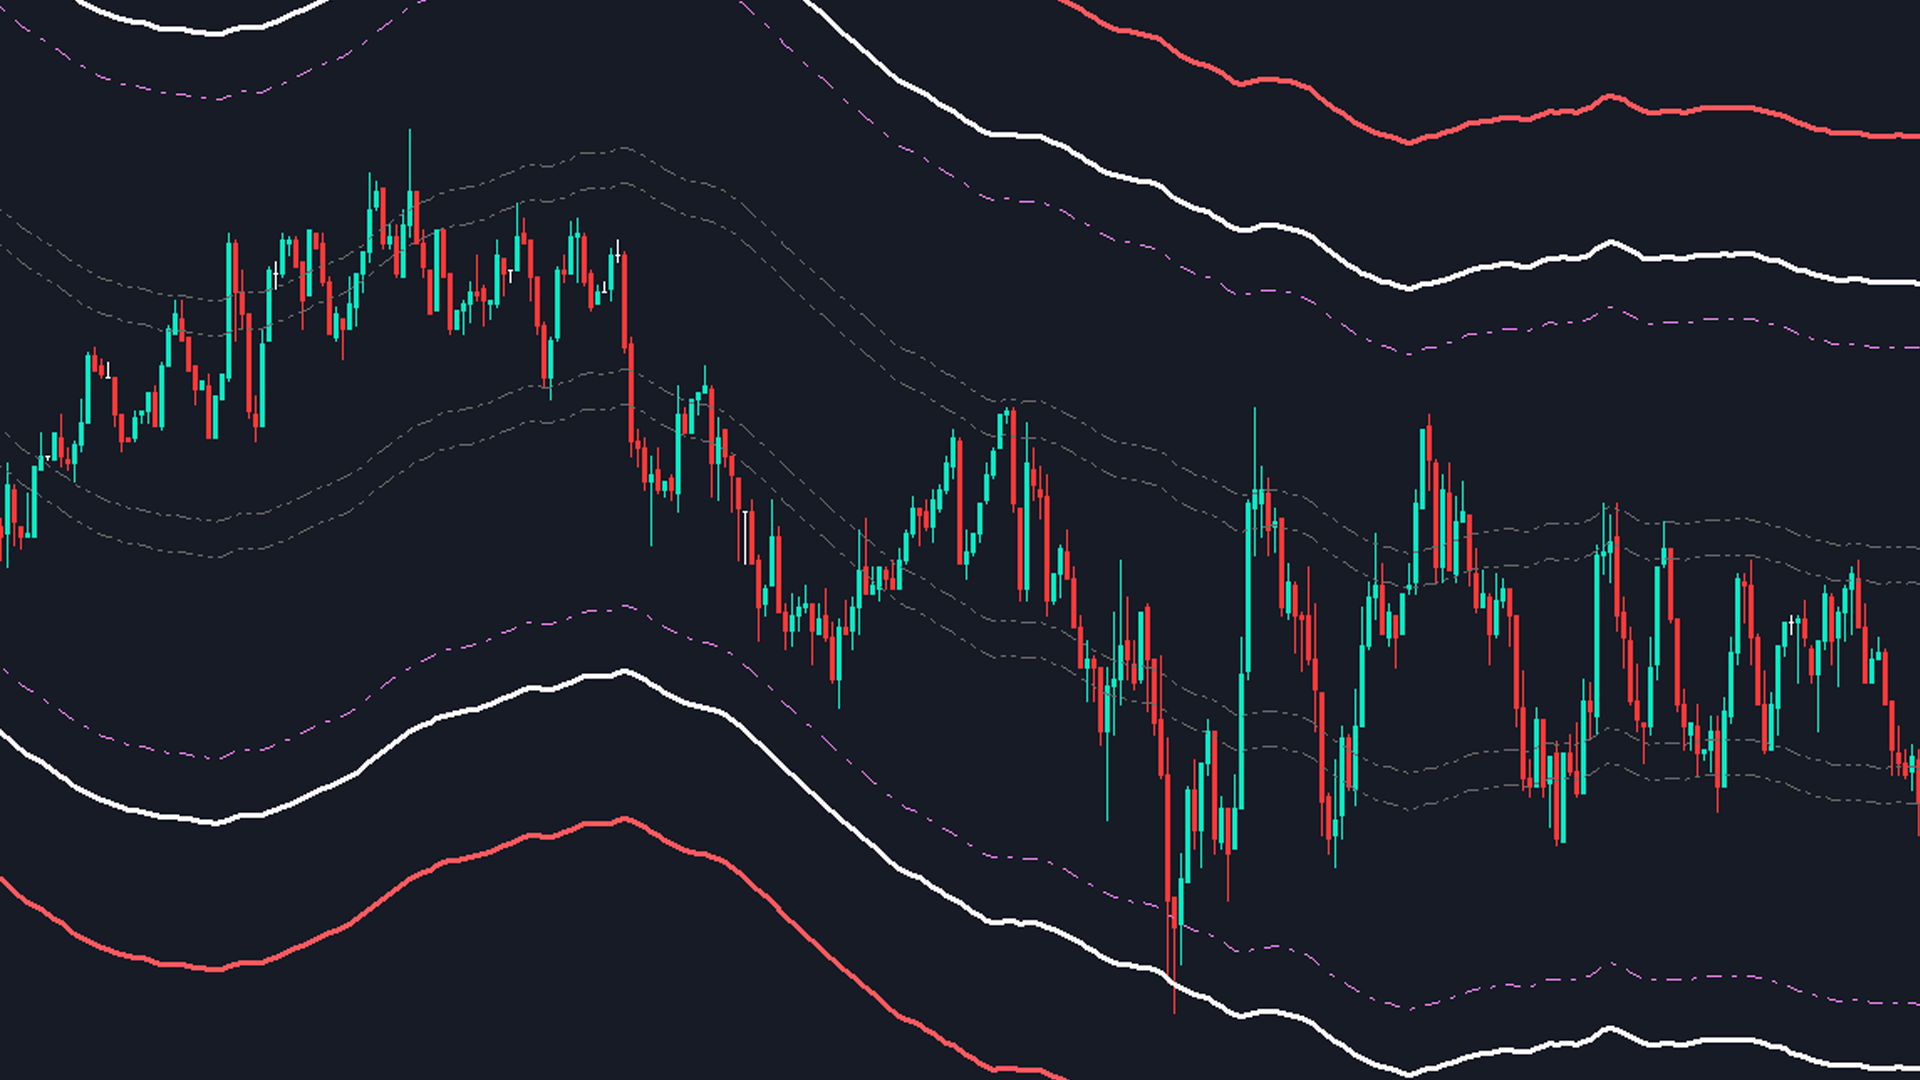
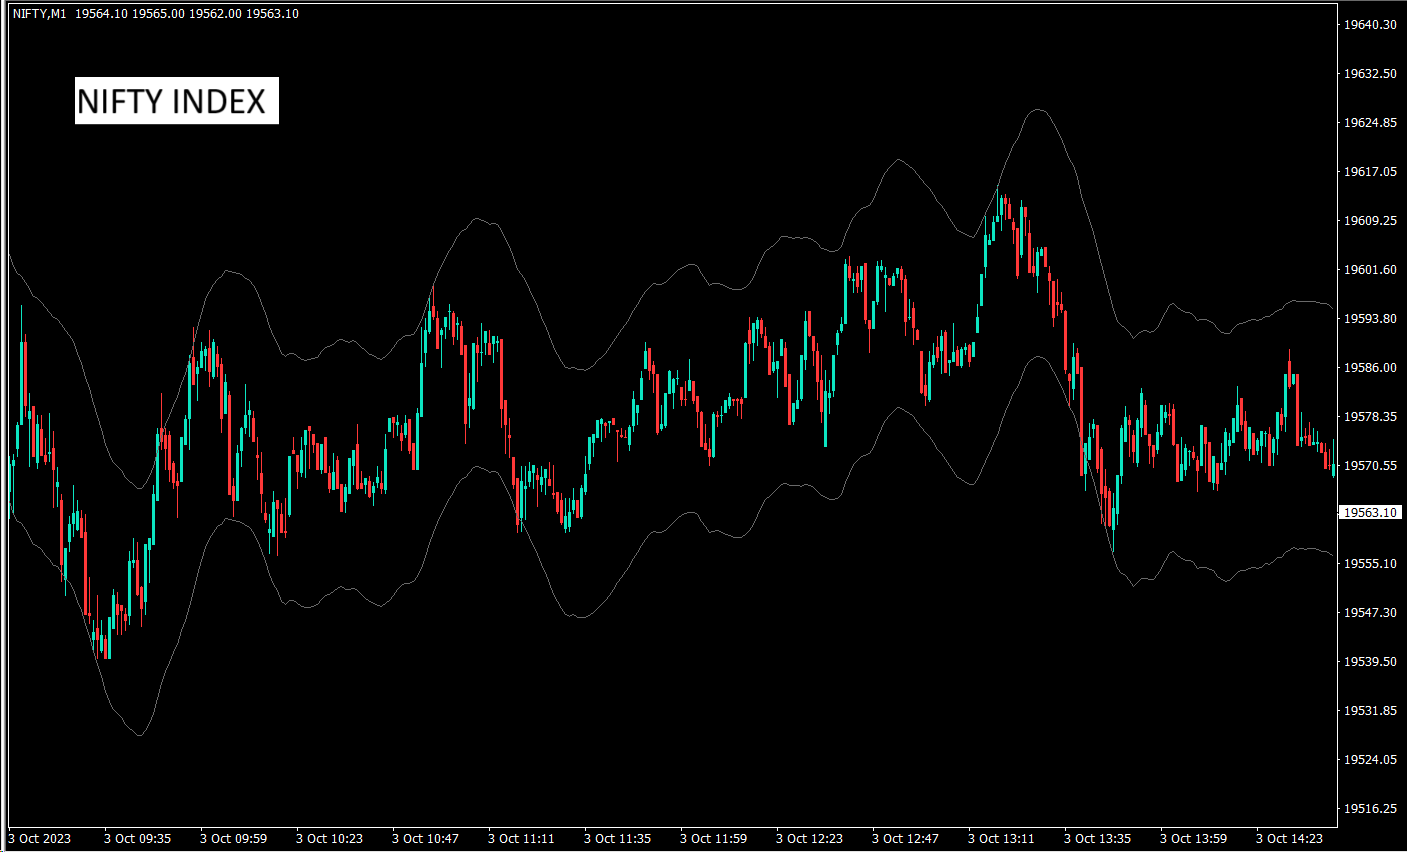
这是 6 组级别,具有两种频率模式,适用于通用市场,包括外汇、加密货币、商品、nifty 和banknifty。 它们是在对金融工具进行最佳研究后出版的。

上层称为U1至U5,下层称为D1至D5
在正常情况下,市场可能会在内部通道中驱动至 U3 或 D3,在波动情况下,市场可能会在外部通道 U4 至 U5 或 D4 至 D5 中驱动。 当价格达到 U3 U4 U5 或 D3 D4 D5 时,反转的可能性非常高,交易者应等待蜡烛图收盘以确认入场,并可以在有效的风险管理下进行交易。


该指标允许您通过指标设置中的自定义选项来改变级别。 用户可以通过添加 + 或 - 点来自定义级别

1. 他们正在处理时间范围:仅 M1、M3、M5、M15、H1 和 H4。
2.适合日内、波段、仓位交易方式
3. 与任何其他指标相比,根据研究帮助找到最佳超买和超卖转折点
4. 动态水平:水平值每分钟都会变化,但当价格在任何情况下超过标准达到这些水平时,就会出现一个循环,并且可以看到反转。
5. 包含提醒广告推送通知


有关交易策略的更多信息,您可以通过 DM 与我联系。
推荐产品
EMAGapCtrend
Eadvisors Software Inc.
O Robô Trader EMAGap faz operações de curto prazo no timeframe 1min buscando as pequenas variações do mercado no instrumento: Mini-índice(B3), utiliza nova tecnologia de trade, os resultados no intraday são íncríveis.    Versão exclusiva para os instrumentos WIN$ e IND$ (Mini-índice B3).  Estratégia utilizada: média móvel e volatilidade. Lote Inicial: Versão Mini-índice, a partir de 1 lote. Versão Bra50, a partir de 0.05 Mini-Lotes. StopLoss e Take Profit Ajustáveis. Gerenciamento de risco:
Setup Double 7s
Luigi Nunes Labigalini
Entry and exit signals from the Double 7's Strategy by Larry Connors in his book "Short Term Trading Strategies That Work". Larry claims this strategy predicted the market's direction over 80% of the time since 1995. Picking up the gains and being exposed in the market less than 25% of the time. Good for swing trading on Daily charts of SPY, Nasdaq, China's FXI, Brazil's EWZ and the majority of the equity ETFs and World Indices. How does it work? The indicator activates the buy signal when
WAPV Box Effort x Result
Eduardo Da Costa Custodio Santos
WA_PV_BOX_EFFORT X MT5 的结果 WAPV Box Effort x Result Indicator 是 Package Indicators 组(Wyckoff Academy Wave Market)的一部分。 MT5 的 WAPV Box Effort x Result Indicator 可帮助您阅读价格和交易量。它的阅读包括协助识别努力x结果 在图表创建的波浪中。 当方框为绿色时,MT5 的 WAPV Box Effort x Result Indicator 表示交易量有利于需求,而当方框为红色时 量有利于供应。 方框越大,成交量相对于价格的位移越大。如果价格的上升波与 Box 的大小不成比例,则 努力x结果。 以一种非常直观的方式,我们可以识别出数量和价格之间的这种差异。 MT5 的 WAPV Box Effort x Result Indicator 还允许您通过将指标置于零轴下方来改善可视化。 以即时交易量和实际交易量在市场上运作 看图片:
Coppock Curve
Abraao Moreira
Fundamentação teórica Rate of Change - taxa de mudança (ROC) O ROC é um oscilador que flutua acima e abaixo de uma linha de zero, medindo a variação percentual de preços ao longo de determinado período. O ROC de 20 períodos mede a variação percentual de preços ao longo de 20 períodos, quanto maior a diferença entre o preço atual e o de 20 períodos atrás, maior o valor do ROC. Quando o indicador está acima de zero, a variação percentual é positiva indicando tendência bullish, se o indicador está
FREE
Limitless MT5
Dmitriy Kashevich
Limitless MT5 is a universal indicator suitable for every beginner and experienced trader. works on all currency pairs, cryptocurrencies, raw stocks Limitless MT5 - already configured and does not require additional configuration And now the main thing Why Limitless MT5? 1 complete lack of redrawing 2 two years of testing by the best specialists in trading 3 the accuracy of correct signals exceeds 80% 4 performed well in trading during news releases Trading rules 1 buy signa
Weis Wave with Alert MT5
Trade The Volume Waves Single Member P.C.
4.93 (15)
Rental/Lifetime Package Options and Privileges  * For optimum results the yearly or lifetime package is suggested due to live training ! Rent Monthly Six Months   Yearly/Lifetime Weis Wave with Speed with Alert+Speed Index x x x Manual  x x x Quick Set up Video x x x Blog x x x Lifetime Updates x x x Setup and Training Material x x Free Rectangle Break Alert Tool      x Discord Access Channel "The SI traders" x 2-hour live methodology training x How to trade with it:    http://
Pendiente de Precio
Cesar Juan Flores Navarro
Indicador en base a la pendiente de la linea de precio, dibuja una línea de color cuando sube a base de los precios que previamente has sido procesados o linealizados, y cuando baja la pendiente la linea linealizada toma otro color. En este caso se a considerado 6 lineas de diferentes procesos desde pendientes largas hacia las cortas, observándose que cuando coincidan las pendientes se produce un máximo o mínimo, lo que a simple vista nos permitirá hacer una COMPRA O VENTA.
The Red Devil Shorter is a fully automatic short setup based on EMAs and SMAs. Attention:  Only 9 of 10 copies left at the price of $250, after that the price goes up to $499 Signal:  https://www.mql5.com/de/signals/1826330 We use this great EA exclusively for the EUR/CHF pair, as we developed it specifically for that. The idea behind the setup is the weakness the EUR/CHF shows in the default time.  The trades are mainly closed by counter signals or the set time. In rare cases, trades are closed
Exclusive FOREX account HEDGE FuzzyLogicTrendEA is based on fuzzy logic strategy based on  analysis 5 indicators and filters. When the EA analysis all this indicators, it decides, based on its fuzzy strategy, which trade will be better: sell or buy. As additional functions, it´s possible defines spread maximum, stop loss and others. Recomm. Symbol: EURUSD, AUDUSD, GBPUSD, NZDUSD, USDCAD, AUDCAD, EURCAD e USDJPY Recomm. timeframe: H1. Backtest were done on EURUSD, H1, 01/07/2023 - 26/0
The best time to trade Using this Indicator is when the time reach exactly hour,half,45 minutes,15 minutes and sometimes 5 minutes.. This indicators is helpful to those who trade boom and crash indecies.How to read this indicator first you'll see Blue allow and Red allow all these allows used to indicate or to detect the spike which will happen so the allow happens soon before the spike happen.This indicator works properly only in boom and crash trading thing which you have to consider when
The "Super Trend Alert MT5" is an indicator designed for the MetaTrader 5 (MT5) trading platform. The specific details and functionality of this indicator may depend on the version or settings you are using. The Super Trend indicator is a popular technical analysis tool that helps identify the direction of the current market trend. It is displayed as a line on the price chart and is accompanied by alerts to notify traders of potential trend changes. To use the "Super Trend Alert MT5" indicator i
QuantumAlert RSI Navigator is a free indicator available for MT4/MT5 platforms, its work is to provide "alerts" when the market is inside "overbought and oversold" regions in the form of "buy or sell" signals. This indicator comes with many customization options mentioned in the parameter section below, user can customise these parameters as needful. Join our MQL5 group , where we share important news and updates. You are also welcome to join our private channel as well, contact me for the priva
FREE
Robo davi I
Lucas Silvino Da Silva
Robô Davi I by Êxodo Capital is a professional system for traders created for the MT5 platform and optimized to work with MINI FUTURE INDEX (WIN) at B3 in BRAZIL. The system uses bias algorithms. After identifying the trend, the position is opened and the robot conducts the trade through a trailing stop that will be driven by the 13-period average. Maximum GAIN of 2200 pts. Main features Our setup has the option to use martingale, the EA has the option to customize. Presentation in the
DemsFx BC Entry EA
Desmond Ebimobowei Dogubo
1. The Expert Adviser is built with a basic, simple and stable trading strategy with i touch or Price Action Principle that is highly effective and accurate with a sniper entry system for a good money management.. 2. The expert advisor works best as from 15 minutes time frame and above.... 3. The expert advisor work with all broker all currency pair and synthetic indices... 4. Use a reasonable lot size and correct settings if you want to get the best of the Expert Advisor.. 5. With Default setti
FREE
Balance Aggression
Edson Cavalca Junior
The indicator measures the balance of aggression. The formula is as follows:   Aggression  = Purchase Volume - Sales Volume. Note : It is rec ommended to use the default configuration and VPS values. It does not work in Forex. Meet Our Products     Parameters : Numbers of days prior to the current one for calculation; Volume Divider e; Enables calculation of the current candle; Histogram Line style and; Size; Line Line style and; Size;  Follow us on our website to check the next new
Swiss VWAPsimple
Terence Gronowski
5 (4)
Swiss VWAPsimple Motivation Did not find free VWAP that works, the one that I found craseh. So I created a VWAP which calculates values only for the actual day. So computer resouces are not over stressed. What is VWAP, how is it used?  VWAP stands for Volume Weighed Average Price, it calculates the running sum of tick volume and the runnung sum of price times tickvolume. The division of these sums result in a weighed price (Sum P*V/Sum V). The calculation starts normally at midnight. The value
FREE
Easy GOLD MT5
Franck Martin
4.4 (15)
Easy Gold is the latest addition to the BotGPT family. It is surprising and very powerful. It is ideal for beginners due to its simplicity.  There is absolutely nothing to do, it's 100% automated, simply indicate the percentage of risk you want to take per trade and the EA is ready. Whatever your capital, the EA takes care of everything. Optimized on (XAUUSD).  Unleash all the power with the professional version (AGI Gold) and its connection to the neural network, available in my store. My othe
FREE
ADR ST Patterns Strategy
Vladimir Poltoratskiy
4.5 (4)
ADR ST Patterns Strategy  is a modification of the classical  ADR  indicator. This simple indicator corresponds to the parameters specified in the  ST Patterns Strategy ( https://stpatterns.com/ ) .  Structural Target Patterns represents the market consistently divided into components. No trend lines, geometric proportions of the model itself, trading volume, or open market interest are needed for the formation of  ST Patterns . They are easily recognized and built only on the basis of breaking
FREE
Trend On Close
David Ben Svaiter
TrendOnClose is a sophisticated indicator designed for Binary market investors, focusing on statistical analysis of trends and counter-trends within specific candle cycles. Each cycle is defined by the candle CLOSE price, establishing the trend direction (UP/DOWN - BULL/BEAR) for subsequent statistical analysis until the start of the next cycle. The statistical analysis operates with two configurations: ⦁ Statistical Goal as SUBSEQUENT CANDLE: The algorithm focuses on the subsequent candle withi
Bollinger Bands B
Flavio Javier Jarabeck
5 (3)
John Bollinger created this indicator in 2010 as a way to read the original indicator (Bollinger Bands) in a more "technical" way, shown as an oscillator. The typical range of the Bollinger Bands %B is 0 - 0.5 - 1.0, where "0" represents the lower band, the "0.5" the middle band, and "1" the upper band. The line on the indicator represents the Closing prices. As simple as that. SETTINGS Bollinger Bands period of analysis Standard Deviation multiplier Shift Price type to be analyzed If you
FREE
Key level wedge MT5
Presley Annais Tatenda Meck
The   Key level wedge MT5   indicator automatically draws rising wedge pattern and falling wedge pattern for you on the chart. This pattern is really good when used as a confirmation entry at key support & resistance, supply & demand and reversal zones. Advantages  The   Key level wedge MT5   block DOES NOT RE-PAINT, giving you confidence when a signal appears and also helps when looking back.  The   Key level wedge MT5   includes an on/off button on the chart to easily keep the charts cle
Bollinger Bands Percentage
Emanuel Cavalcante Amorim Filho
Bollinger Bands %  or Bollinger Bands Percentage is one of the indicators used in the Sapphire Strat Maker - EA Builder . It is calculated using the following formula: Perc = (CLOSE_PRICE - LOWER_BOLLINGER) / (UPPER_BOLLINGER - LOWER_BOLLINGER) * 100 Thus, by taking the difference between closing price to the lower band and dividing it by the difference of the upper and the lower price levels of a Bollinger Bands indicator, we can calculate this indicator. It shows how far the price is f
FREE
MIDAS Super VWAP
Flavio Javier Jarabeck
4.29 (14)
Imagine VWAP, MVWAP and MIDAS in one place... Well, you found it! Now you can track the movement of Big Players in various ways, as they in general pursue the benchmarks related to this measuring, gauging if they had good execution or poor execution on their orders. Traders and analysts use the VWAP to eliminate the noise that occurs throughout the day, so they can measure what prices buyers and sellers are really trading. VWAP gives traders insight into how a stock trades for that day and deter
FREE
Compass B3 Trader
Renato Takahashi
Compass B3 Trader é um robô especialista em trades automatizados para o iBovespa (Miniíndice WIN e Minidólar WDO), baseado na estratégia de análise de inclinação de média móvel. A partir de estabelecimento da inclinação desejada, o robô realiza as entradas de trades, seguindo takeprofit e stoploss fixos ou dinâmicos conforme análise de velas. Ainda, pode-se configura um sistema de trail de stoploss possibilitando trades completos e de grandes grandes (+ pontos). Ativos: WIN, WDO. Timeframe: M1,
Donchian Pro
Paulo Henrique Faquineli Garcia
5 (2)
The Donchian Channel Channels are among the most popular tools of technical analysis, as they visually convey to the analyst the limits within which most price movement tends to occur. Channel users know that valuable information can be obtained at any time, whether prices are in the central region of a band or close to one of the border lines. One of the best known techniques to explore these concepts is Bollinger Bands. However, John Bollinger was not the only one to research the applicatio
FREE
Wave Box Market Frenquency
Jean Jacques Huve Ribeiro
4.83 (6)
Totally linked to the result of a movement and the duration he had. Its height records how many ticks the asset walked during a given movement, its width shows us the duration that movement had. Its configuration must be in line with the Weis Wave Indicator configuration to observe the movement force and can indicate a possible accumulation or distribution of the movement;
FREE
Descubra o EA para Mini Índice, o segredo do sucesso no mercado financeiro! Desenvolvido com anos de observação cuidadosa, este EA utiliza sinais exclusivos de entrada e saída para garantir resultados impressionantes. Prepare-se para uma jornada lucrativa! Graças a dois indicadores poderosos, cuidadosamente configurados (e forneceremos as configurações exatas), este EA oferece resultados excelentes. Imagine maximizar sua taxa de acerto e o payoff, enquanto mantém um baixo drawdown. Sim, é possí
Expert Amazo
Guilherme Geovanini Fraga
EXPERT AMAZO é um Expert Advisor projetado especificamente para negociar WIN (mini índice) e WDO (mini dólar). A operação é baseada na abertura de ordens utilizando alguns indicadores como Sars parabólicos, médias móveis, Bandas de Bollinger, Fibonacci, etc., trabalhando de acordo com 3 modalidades de estratégia, o AMAZO procura prever os movimentos do mercado com operações contra ea favor da tendência.        Entre em nosso Grupo de WhatsApp para receber as melhores configurações do Expert.
Pivotrons B3 Trader
Renato Takahashi
Pivotrons B3 Trader é o robô de negociação automatizada a bolsa iBovespa B3 (miniindice WIN e minidólar WDO) que usa os cálculos de Pivot Points de acordo com o horário estabelecido, bem como analisando minutos anteriores para determinação do pivô, dos suportes e das resistências, adicionando as ordens de acordo com tais configurações. Pode ser configurado um filtro de duas médias móveis, que levam em conta a inclinação das mesmas no momento da emissão de ordens. Atenção: Alterar o parâmetro BR1
该产品的买家也购买
Atomic Analyst MT5
Issam Kassas
5 (13)
首先值得强调的是,该交易指标是非重绘、非延迟的指标,这使其成为手动和机器人交易的理想选择。 用户手册:设置、输入和策略。 Atomic Analyst是一种PA价格行动指标,利用价格的力量和动量来寻找市场上更好的机会。配备了高级过滤器,可帮助去除噪音和假信号,并提高交易潜力。使用多层复杂的指标,Atomic Analyst扫描图表,并将复杂的数学计算转化为任何初学者都能理解并用来做出一致交易决策的简单信号和颜色。 “Atomic Analyst”是专为新手和经验丰富的交易者量身定制的综合交易解决方案。它将高级指标和一流功能融合为一体的交易策略,使其成为所有类型交易者的多功能选择。 日内交易和剥头皮策略:专为快速准确的日内交易和短期交易而设计。 日内和摆动交易策略:可用作追求价格大幅波动的日内和摆动交易者的可靠工具。 多货币和市场:凭借其可靠的精度,在不同的工具和市场上运作。 多个时间框架:可在多个时间框架上使用,性能良好。 稳定性:所有指标均不重绘、不重绘和不滞后,确保可靠的信号。 信号清晰度:提供箭头信号,用于清晰的入场和出场点。 实时警报:通过交易入场、SL和TP警报通知交
首先,值得强调的是,这个交易系统是一个非重绘、非重画和非滞后的指标,这使得它非常适合手动和机器人交易。 在线课程,手册和下载预设。 “智能趋势交易系统 MT5”是专为新手和经验丰富的交易者量身定制的综合交易解决方案。它结合了超过 10 个优质指标,具有 7 多个强大的交易策略,使其成为适用于各种市场条件的多功能选择。 趋势跟随策略:提供精确的入场和止损管理,以有效地跟随趋势。 反转策略:识别潜在的趋势反转,使交易者能够利用区域市场的机会。 剃头策略:专为快速准确的日内交易和短期交易而设计。 稳定性:所有指标都不会重绘、不会重画和不会滞后,确保可靠的信号。 定制:支持自定义策略,以满足个人交易偏好。超过 7 种策略和组合可帮助您找到最佳策略。 信号清晰度:提供箭头信号,以指示清晰的入场和退出点。 实时警报:通过交易进出警报使交易者保持了解。 深入分析:提供更高时间框架的趋势分析和实时交易监控。 自适应颜色编码:利用蜡烛颜色编码来显示成交量、趋势和反转蜡烛信号。通过蜡烛颜色分析市场方向。 “智能趋势交易系统 MT5”赋予交易者必要的工具,以便在各种市场条件下做出明智和战略性的交易决策。无论
TPSpro RFI Levels MT5
Roman Podpora
5 (9)
Reversal First Impulse levels (RFI)      INSTRUCTIONS        RUS       -       ENG              R ecommended to use with an indicator   -   TREND PRO -  Version MT4                 A key element in trading is zones or levels from which decisions to buy or sell a trading instrument are made. Despite attempts by major players to conceal their presence in the market, they inevitably leave traces. Our task was to learn how to identify these traces and interpret them correctly. Main functions:: Di
Quantum Trend Sniper
Bogdan Ion Puscasu
5 (39)
介绍   量子趋势狙击指标 ,突破性的 MQL5 指标,正在改变您识别和交易趋势反转的方式!由拥有超过13年交易经验的资深交易员团队开发,     量子趋势狙击指标   旨在通过其创新的方式以极高的准确度识别趋势反转,将您的交易之旅推向新的高度。 ***购买量子趋势狙击指标,即可免费获得量子突破指标!*** 当量子突破指标识别出趋势反转时,它会向您发出警报和信号箭头,并建议您三个止盈水平。 它既适合新手交易者,也适合专业交易者。 量子 EA 通道:       点击这里 MT4版本:       点击这里 建议: 时间范围: 所有时间范围。为了获得最佳结果,我们建议在 M15、M30 和 H1 时间范围内使用它。 货币对:欧元兑美元、英镑兑美元、澳元兑美元、欧元兑英镑、, EURAUD,  XAUUSD 账户类型:ECN、Raw 或 Razor,点差极低 经纪时间:任意 经纪商:IC Markets、Pepperstone with Raw 和 Razor 的点差最低 建议止损:50 点 建议止盈水平:20 点、50 点和
RelicusRoad Pro MT5
Relicus LLC
4.82 (22)
现在$ 147(更新后增加到$ 499) - 无限帐户(PC或Mac) RelicusRoad 用户手册 + 培训视频 + 访问 Private Discord Group + VIP 身份 一种看待市场的新方式 RelicusRoad 是世界上最强大的外汇、期货、加密货币、股票和指数交易指标,为交易者提供保持盈利所需的所有信息和工具。我们提供技术分析和交易计划,帮助每一位交易者取得成功,从初学者到高级。它是一个关键的交易指标,可以提供足够的信息来预测未来的市场。我们相信一个完整的解决方案,而不是图表上几个没有意义的不同指标。这是一个多合一指标,显示无与伦比且非常准确的信号、箭头 + 价格行为信息。 RelicusRoad 基于强大的人工智能,提供缺失的信息和工具来教育您并使您成为交易专家,成为成功的交易者。 几乎所有技术指标都滞后,这意味着它们只能报告已经发生的事情。因此,他们只确认您过去可以看到的价格已经在哪里。我们相信领先指标可以预测未来价格,而无需重新绘制,也不要过度依赖可能改变并导致重新绘制的滞后指标。如果您根据滞后指标进行交易并建立头寸,您就知道您已
IVISTscalp5
Vadym Zhukovskyi
5 (3)
我们向您介绍iVISTscalp5指标,它不仅独特,而且在交易操作中也非常有效。该指标基于时间数据,是多年金融市场经验和深入分析的结果。iVISTscalp5指标是手动交易的优秀工具。便利性、简单性和可视化 - 所有的复杂性都隐藏在内部。我们将iVISTscalp5指标的设置和使用简化到了最大程度。该指标适用于MT5终端中您所拥有的所有金融工具。 操作时间为UTC+3的早上4点到晚上8点。 iVISTscalp5指标菜单(见截图1): History - 计算行情的周数 dT_min - 选择时间间隔的时间(分钟) TFline - 绘制水平成交量(时间帧) BARSline - 绘制水平成交量(条数) TFtrend1 - 绘制日线通道(时间帧) BARStrend1 - 绘制日线通道(条数) TFtrend2 - 绘制周线通道(时间帧) BARStrend2 - 绘制周线通道(条数) ALERT_TIMER - 设置闹钟 ALERT - 开启/关闭闹钟 Save - 开启/关闭将时间记录到文本文件。 图表上的红色和蓝色旗帜表示时间(VIST智能剃须系统的信号)。卖出信号为红旗,买入
FX Volume MT5
Daniel Stein
4.94 (17)
通过 mql5 和 Telegram 上 的 " 晨间简报 "获取每日市场更新,包括详细信息和屏幕截图 ! 外汇交易量(FX Volume)是第一个也是唯一一个从经纪商角度真正洞察市场情绪的交易量指标。 直接在您的图表上看到这些信息是真正改变游戏规则和突破性的交易解决方案。 受益于独特的市场数据洞察,如 比率(Ratios )显示货币多头和空头头寸的比率(百分比 比率变化 显示所选时间段内的多头比率及其百分比变化 总交易量 显示货币的总交易量(多头和空头),以手为单位 多头 交易量显示货币所有多头头寸的交易量 空头 交易量显示所有货币空头头寸的交易量 净多头 显示净多头交易量,即所有多头头寸减去所有空头头寸(以手为单位)。 净多头百分比 显示货币净多头交易量的变化 请阅读我们的基本教程 -> "如何使用外汇交易量进行交易 " 获取更多信息,如常见问题、交易技巧和教程视频,请访问我们的 外汇交易量公共信息频道 请 安装并运行 SI Connect 以建立与我们数据中心的持续连接 背景信息 我们都知道,外汇是一个分散的市场。这就是为什么我们必须打破常规思维,开发一个独
Bill Williams Advanced
Siarhei Vashchylka
5 (5)
Bill Williams Advanced is designed for automatic chart analysis using Bill Williams' "Profitunity" system. The indicator analyzes four timeframes at once. Manual (Be sure to read before purchasing) Advantages 1. Automatically analyzes the chart using the "Profitunity" system of Bill Williams. The found signals are placed in a table in the corner of the screen. 2. Equipped with a trend filter based on the Alligator indicator. Most of the system signals are recommended to be used only accordi
Dragon Multi Indicator MT5
Mansour Babasafary
5 (3)
74% discount for the next 10 buyers (original price $605): 1 left Get a 50% bonus by buying (or even renting) any of our products. After buying (or renting), send a message for more information. 3 Indicators in 1 indicator Strategy based on price action Made specifically for the best forex currency pairs Can be used in the best time frame of the market at a very reasonable price This indicator is basically 3 different indicatos . But we have combined these 3 indicators in 1 indicator so th
"Piranha" - an autonomous trading system that determines overbought and oversold levels on the chart. Red and blue zones represent overbought and oversold levels respectively. Entry points are marked with arrows: a downward arrow in the red zone for "sell" and an upward arrow in the blue zone for "buy". The Take profit level is indicated by the green moving average. Key features: Adjusting the Take profit level as the green moving average changes position. Averaging ability when a new market e
FxaccurateLS
Shiv Raj Kumawat
WHY IS OUR FXACCCURATE LS MT5 THE PROFITABLE ? PROTECT YOUR CAPITAL WITH RISK MANAGEMENT Gives entry, stop and target levels from time to time. It finds Trading opportunities by analyzing what the price is doing during established trends. POWERFUL INDICATOR FOR A RELIABLE STRATEGIES We have made these indicators with a lot of years of hard work. It is made at a very advanced level. Established trends provide dozens of trading opportunities, but most trend indicators completely ignore them!
介绍     Quantum Breakout PRO   ,突破性的 MQL5 指标,正在改变您交易突破区域的方式!由拥有超过13年交易经验的资深交易员团队开发,     量子突破 PRO     旨在通过其创新和动态的突破区域策略将您的交易之旅推向新的高度。 量子突破指标将为您提供带有 5 个利润目标区域的突破区域的信号箭头,以及基于突破框的止损建议。 它既适合新手交易者,也适合专业交易者。 量子 EA 通道:       点击这里 重要的!购买后请私信我领取安装手册。 建议: 时间范围:M15 货币对:GBPJPY、EURJPY、USDJPY、NZDUSD、XAUUSD 账户类型:ECN、Raw 或 Razor,点差极低 经纪商时间:GMT +3 经纪商:IC Markets、Pepperstone with Raw 和 Razor 的点差最低 规格: 不重漆! 最多 5 个建议利润目标区域 建议止损水平 可定制的盒子。您可以设置自己的 Box Time Start 和 Box Time End。 接触 如果您有任何疑问或需要帮
Advanced Supply Demand MT5
Bernhard Schweigert
4.53 (15)
任何新手或专业交易者的最佳解决方案! 该指标是一款独特、高质量、且价格合理的交易工具,因为我们已经整合了许多专有功能和新公式。 依据此更新,您将能够显示双重时间帧区域。 您不仅可以显示一个较高的时间帧,还可以同时显示图表时间帧,加上更高的时间帧:显示嵌套时区。 供需双方所有交易者都会喜欢它。 :) 重要信息披露 高级供需的最大潜力,请访问 https://www.mql5.com/zh/blogs/post/720245   想象您的交易如何得以改善,是因为您能够精准定位入场或目标位吗? 构建于新的底层算法,它可以更轻松地识别出买卖双方之间的潜在失衡。 这是因为它以图形方式展示供需最强劲区域,及其过去的表现(显示旧区域)。 这些功能旨在帮助您更轻松地发现最佳入场区域和价位。 现在您可以针对您的交易品种和时间帧来优化和编辑区域强度! 高级供需指标适用于所有产品和时间帧。 它是一个新的公式,非常新的功能是两个区域强度函数可由用户输入进行调整! 这在交易中是一大优势。 当您学习如何使用专有功能,例如带有价格游离最小 X 因子的区域强度时,您能够判断该区域强劲与否。 供需区域用作警报触发器
Gartley Hunter Multi
Siarhei Vashchylka
5 (6)
Gartley Hunter Multi - An indicator for searching for harmonic patterns simultaneously on dozens of trading instruments and on all classic timeframes: (m1, m5, m15, m30, H1, H4, D1, Wk, Mn). Manual (Be sure to read before purchasing) | Version for MT4 Advantages 1. Patterns: Gartley, Butterfly, Shark, Crab. Bat, Alternate Bat, Deep Crab, Cypher 2. Simultaneous search for patterns on dozens of trading instruments and on all classic timeframes 3. Search for patterns of all possible sizes. Fr
Introducing the South African Sniper indicator created by a small group of traders with a few years trading trading the financial market profitably . This is a plug and play indicator that provides you with  BUY and SELL (SNIPER ENTRY) signals with TARGET and trail stops. The indicator Works with all MT5 trading instruments. The indicator uses previous  chart data as receipt to speculate on future market moves.
Golden Gate Algo MT5
James David Lane
4 (6)
40% 圣诞优惠!价格将于1月1日涨至$250! 推出GoldenGate Entries:前沿交易解决方案! 发现与GoldenGate Entries(GGE)一同进行交易的革命性方法,这是一款设计用于提升您交易体验的先进指标。GGE提供了一套全面的功能,以赋予用户在交易决策中的精准和信心。 交易对:任意(外汇 - 商品 - 股票 - 股票 - 加密货币) 时间框架:15分钟至H1 主要特点: 买入和卖出箭头指示:接收伴随弹出警报的买入和卖出箭头指示,确保您随时保持了解。 GoldenGate_Algo:通过GoldenGate_Algo深入了解市场状况,这是一款强大的工具,用于评估市场是否处于“超卖”或“超买”状态。 当前趋势分析:通过访问您正在查看的时间框架上的当前趋势,保持领先地位,使您能够将交易与市场当前方向对齐。 内置枢轴点:使用内置的枢轴点轻松识别关键市场点,提供有价值的支撑和阻力水平。 蜡烛扫描器:分析蜡烛形态和图案,找到最佳的入场点并过滤掉低概率的入场。 完全定制:通过完整的定制选项,完全掌控您的交易体验,允许您个性化从
FX Power MT5 NG
Daniel Stein
5 (5)
通过 mql5 和 Telegram 上 的晨间简报获取每日市场更新,包括详细信息和屏幕截图 ! FX Power MT5 NG 是我们长期以来非常受欢迎的货币强度计算器 FX Power 的下一代产品。 这款下一代强度计算器能提供什么?您所喜爱的原版 FX Power 的所有功能 附加功能 黄金/XAU 强度分析 更精确的计算结果 可单独配置的分析周期 可自定义计算限制,以获得更好的性能 为希望查看更多信息的用户提供特殊的多实例设置 无尽的图形设置,可在每个图表中设置您最喜欢的颜色 无数的通知选项,让您再也不会错过任何重要信息 采用 Windows 11 和 macOS 风格的全新圆角设计 神奇的移动指标面板 FX Power 主要功能 所有主要货币的完整强势历史 所有时间框架内的货币强弱历史 所有经纪商和图表的计算结果完全相同 100% 可靠的实时计算 -> 无重绘 可通过下拉列表选择分析时段 通过自定义模式单独配置分析时段 可在一个图表中使用多个实例 可移动 FX Power 显示屏(通过拖放) 适用于高分辨率 QHD、UHD 和 4K 显示器 自动终端配置 针对平板电脑
Advanced Currency Strength28 MT5
Bernhard Schweigert
5 (1)
任何新手或专家交易者的最佳解决方案! 这个指标是一个独特的、高质量的、可负担得起的交易工具,因为我们纳入了一些专有的功能和一个新的公式。只需一个图表,你就可以读出28个外汇对的货币强度!想象一下,你的交易将如何得到改善,因为你的交易是在你的手中进行的。想象一下,你的交易将如何改善,因为你能够准确地确定新趋势或剥头皮机会的触发点? 用户手册:点击这里  https://www.mql5.com/en/blogs/post/697384 这是第一本,原版的! 不要买一个毫无价值的崇拜者的克隆品。 特别的 子窗口中的箭头显示强劲的货币势头GAP将指导你的交易! 当基础货币或报价货币处于超卖/超买区域(外盘斐波那契水平)时,在个人图表的主窗口中出现警告信号。 当货币力量从外围区间回落时,回撤/反转警报。 十字星模式的特别警报 可选择多个时间框架,以快速查看趋势! 货币强度线在所有的时间框架中都非常平稳,当使用较高的时间框架来识别总体趋势,然后使用较短的时间框架来确定精确的入口时,效果非常好。你可以根据自己的意愿选择任何时间框架。每个时间框架都由其自身进行了优化。 建立在
Fractal Advanced MT5
Siarhei Vashchylka
5 (3)
Fractal Advanced - displays Fractal and Alligator indicators on the price chart. Has wide options for settings and customization. It is also equipped with alerts and a hotkey system. Manual (Be sure to read before purchasing) | Version for MT4 Advantages 1. The indicator does not fill the entire chart with fractals, but allows you to display only relevant signals. 2. The number of fractals is adjusted by scrolling the mouse while holding down the Shift key. 3. Instantly show/hide the Alligator
Price Action Finder Multi MT5
Siarhei Vashchylka
5 (4)
The Price Action Finder Multi indicator is an indicator of entry points that searches for and displays Price Action system patterns on dozens of trading instruments and on all standard time frames: (m1, m5, m15, m30, H1, H4, D1, Wk, Mn). The indicator places the found patterns in a table at the bottom of the screen. By clicking on the pattern names in the table, you can move to the chart where this pattern is located. Manual (Be sure to read before purchasing) | Version for MT4 Advantages 1. Pa
Golden Spikes Detector
Batsirayi L Marango
5 (1)
Golden Spikes Detector This indicator is based on an advanced strategy primarily for trading spikes on Boom and Crash Indices. Complex algorithms were implemented to detect high probability entries only. It alerts on potential Buy and Sell entries. To trade spikes on the Deriv or Binary broker, only take Buy Boom and Sell Cash alerts. It was optimised to be loaded on 5-minute timeframe although multiple timeframe analysis is done in the background. Features ·             Desktop pop up and sound
Entry Points Pro for MT5
Yury Orlov
4.55 (159)
这款指标用于 MT5,可提供准确的入场交易信号,且无重绘。 它可应用在任何金融资产:外汇、加密货币、贵金属、股票、指数。 它将提供极其精准的评估,并告诉您何时开仓和平仓的最佳时机。 观看 视频 (6:22),其中包含一个仅处理单一信号的示例,该信号即可值回指标购价! 大多数交易者在 Entry Points Pro 指标的帮助下,在第一个交易周内即改善了他们的交易结果。 订阅我们的 Telegram 群 ! Entry Points Pro 指标的益处。 入场信号无重绘 如果信号出现,并得到确认,则它不会再消失;不像是重绘指标,它会导致重大的财产损失,因为它们可以在显示信号后再将其删除。 无差错开仓 指标算法可令您找到入场交易(买入或卖出资产)的理想时机,从而提高每位交易者的成功率。 Entry Points Pro 可操作任何资产 它允许您在 MT5 平台上交易任何经纪商的加密货币、股票、贵金属、指数、大宗商品和货币。 提供任何方向的信号 Entry Points Pro 指标提供针对任意价格走势的入场交易信号 - 上涨、下跌或横盘(横向)。
MetaForecast M5
Vahidreza Heidar Gholami
5 (2)
MetaForecast能够根据价格数据中的谐波来预测和可视化任何市场的未来走势。虽然市场不总是可预测的,但如果价格中存在模式,MetaForecast可以尽可能准确地预测未来。与其他类似产品相比,MetaForecast通过分析市场趋势可以生成更精确的结果。 输入参数 Past size (过去的尺寸) 指定MetaForecast用于创建生成未来预测模型的柱数量。该模型以一条黄色线绘制在所选柱上。 Future size (未来的尺寸) 指定应预测的未来柱数量。预测的未来以粉色线表示,并在其上绘制了蓝色回归线。 Degree (程度) 此输入确定了MetaForecast将在市场上进行的分析级别。 Degree 描述  0 对于程度0,建议使用较大的值来设置“过去的尺寸”输入,以覆盖价格中的所有高峰、低谷和细节。  1 (建议的) 对于程度1,MetaForecast可以理解趋势,并通过较小的“过去的尺寸”生成更好的结果。  2 对于程度2,除了趋势,MetaForecast还可以识别反转点。对于大于1的程度,必须使用较高的“细节”和“噪音减少”输入值。  大于2 不建议使用大
Volume by Price MT5
Brian Collard
5 (3)
The Volume by Price Indicator for MetaTrader 5 features Volume Profile and Market Profile TPO (Time Price Opportunity). Volume and TPO histogram bar and line charts. Volume Footprint charts. TPO letter and block marker collapsed and split structure charts. Session filtering and grouping. Static, dynamic and flexible range segmentation and compositing methods with relative and absolute visualizations. Graphical layering, positioning and styling options to suit the user's analytic and aesthetic n
Professional Scalping Tool on Deriv Attention! The indicator will be sold in limited quantities!!! The previous 5 copies were sold for $250 The remaining 4 copies will be sold for $350 The next price is $500 Description: This trading indicator is designed for professional traders focused on scalping. Designed with the market in mind, it provides highly accurate spike trading signals. It works on the M1 timeframe and supports the following symbols: Boom 300 Index, Boom 500 Index, Boom 1000 I
PZ Harmonacci Patterns MT5
PZ TRADING SLU
3.25 (4)
可以说,这是您可以为MetaTrader平台找到的最完整的谐波价格形成自动识别指标。它检测19种不同的模式,像您一样认真对待斐波那契投影,显示潜在的反转区域(PRZ),并找到合适的止损和获利水平。 [ 安装指南 | 更新指南 | 故障排除 | 常见问题 | 所有产品 ] 它检测19种不同的谐波价格形态 它绘制了主要,衍生和互补的斐波那契投影(PRZ) 它评估过去的价格走势并显示每个过去的形态 该指标分析其自身的质量和性能 它显示合适的止损和获利水平 它使用突破来表明合适的交易 它在图表上绘制所有样式比率 它实现了电子邮件/声音/视觉警报 受斯科特·M·卡尼(Scott M. Carney)的书的启发,该指标旨在满足最纯粹和最熟练的交易者的需求。但是,它采取了一种使交易更容易的方式:在向交易发出信号之前,它会等待Donchian朝正确方向突破,从而使交易信号非常可靠。 斐波那契投影与向量无关 它实现了电子邮件/声音/推送警报 它绘制了ABCD投影 重要提示: 为了符合 Scott M. Carney先生 的商标申诉,某些图案名称已重命名为不言自明的替代方式, Scot
This indicator builds upon the previously posted Nadaraya-Watson smoothers. Here we have created an envelope indicator based on Kernel Smoothing with integrated alerts from crosses between the price and envelope extremities. Unlike the Nadaraya-Watson estimator, this indicator follows a contrarian methodology. Please note that by default this indicator can be subject to repainting. Users can use a non-repainting smoothing method available from the settings. The triangle labels are designed
XQ Indicator MetaTrader 5
Marzena Maria Szmit
5 (1)
Step into the realm of Forex trading with confidence and precision using XQ, a cutting-edge Forex indicator designed to elevate your trading game to unprecedented heights. Whether you're a seasoned trader or just stepping into the world of currency exchange, XQ Forex Indicator empowers you with the insights and signals needed to make informed trading decisions. The signal conditions are a combination of three indicators, and XQ Forex Indicator only display  medium and long-term trends . The ind
Noize Absorption Index
Ekaterina Saltykova
Noize Absorption Index - is the manual trading system that measures the difference of pressure between bears forces and bulls forces. Green line - is a noize free index that showing curent situation. Zero value of index shows totally choppy/flat market.Values above zero level shows how powerfull bullish wave is and values below zero measures bearish forces.Up arrow appears on bearish market when it's ready to reverse, dn arrow appears on weak bullish market, as a result of reverse expectation.
作者的更多信息
Crypto Charting
Rajesh Kumar Nait
5 (3)
MT5 的加密货币图表。 特征 : 1. 通过 Websocket (wss) 实时 OHLC 图表 2. 从 API 更新柱的历史记录 3. 当 MT5 重新启动时,自动更新图表上的历史记录,以确保柱状图中没有丢失数据,并且始终像原生图表一样保持最新状态 4. API 的预定历史记录更新:如果互联网断开一毫秒,bar ohlc 值可能不正确,因为 websocket 是流协议。 为了减少 1-2% 的错误几率,我们添加了一项通过 API 进行预定历史更新的功能,该功能每隔几分钟就会更新一次数据,这可以通过实用程序设置进行设置。 它确保 OHLC 值始终正确,使您的分析不会出现错误。 5.实用程序支持从M1到MN1的所有时间范围支持 6. 可用数据:开盘价、开盘价、最低价、实际成交量和即时成交量 7. 您可以使用策略测试器对加密数据使用 EA 交易来回测任何策略 8. 断线时自动重连websocket 可用交易所列表: 1. 币安现货、期货和币安 2.ByBit现货、期货和反向期货(v5 API) 3.O
该指标最多绘制 6 个级别,可以根据交易者的要求启用/禁用以使图表更清晰 这 6 个级别分为 2 组:高和低 对于每组,可以选择不同的时间范围 它基于先前高低反转的策略,因为它认为当价格达到每日、每周或每月高低时,价格通常会在更小的时间范围内(如 5 分钟)显示拒绝 特征 : - 在单个图表中跟踪多达 6 个时间帧高低点 - 在这些级别设置警报,邮件、推送或终端警报,当价格触及这些级别时,您将立即收到警报 - 自定义关卡样式,包括线条样式、宽度、颜色等 - 班次:想要跟踪或研究第 2 天或第 3 天的高低?您可以将 shift 设置为 2 用于 2nd Bar 的 High Low 或 3 设置为 3rd Bar 的 High Low 等等。 该指标最多绘制 6 个级别,可以根据交易者的要求启用/禁用以使图表更清晰 这 6 个级别分为 2 组:高和低 对于每组,可以选择不同的时间范围 它基于先前高低反转的策略,因为它认为当价格达到每日、每周或每月高低时,价格通常会在更小的时间范围内(如 5 分钟)显示拒绝 特征 : - 在单个图
该库将允许您使用任何 EA 来管理交易,并且非常容易集成到任何 EA 上,您可以使用描述中提到的脚本代码以及显示完整过程的视频演示示例自行完成。 该产品允许通过API进行交易操作,不包括图表。 用户可以使用提供加密图表的经纪商的图表并向币安发送订单 - 支持单向和对冲模式 - 下限价、止损限价和止盈限价订单 - 下达市场订单、SL 市场订单、TP 市场订单 - 修改限价单 - 取消订单 - 查询订单 - 更改杠杆、保证金 - 获取位置信息 和更多... 脚本文档 1 小时编程教程,帮助初学者使用 MQL5 编写一个简单的 EA,将订单发送到币安 https://www.youtube.com/watch?v=d_r4j2V77mY 该库将允许您使用任何 EA 来管理交易,并且非常容易集成到任何 EA 上,您可以使用描述中提到的脚本代码以及显示完整过程的视频演示示例自行完成。 该产品允许通过API进行交易操作,不包括图表。 用户可以使用提供加密图表的经纪商的图表并向币安发送订单 - 支持单向和对冲模式
该库将允许您使用任何 EA 来管理交易,并且非常容易集成到任何 EA 上,您可以使用描述中提到的脚本代码以及显示完整过程的视频演示示例自行完成。 - 下限价、止损限价和止盈限价订单 - 下达市场订单、SL 市场订单、TP 市场订单 - 修改限价订单 - 取消订单 - 查询订单 - 更改杠杆、保证金 - 获取位置信息 和更多... 租赁加密货币图表是可选的,除非您的 MT5 上没有币安图表。 对于脚本演示:单击此处 如果您想与交易面板进行交易,您可能对此产品感兴趣 该产品是加密图表的插件 该库将允许您使用任何 EA 来管理交易,并且非常容易集成到任何 EA 上,您可以使用描述中提到的脚本代码以及显示完整过程的视频演示示例自行完成。 - 下限价、止损限价和止盈限价订单 - 下达市场订单、SL 市场订单、TP 市场订单 - 修改限价订单 - 取消订单 - 查询订单 - 更改杠杆、保证金 - 获取位置信息 和更多... 租赁加密货币图表是可选的,除非您的 MT5 上
Double Top and Double Bottom
Rajesh Kumar Nait
5 (4)
This indicator finds Double Top and Double bottom Example : What is Double Top When price establishes a new high and then falls, then reverse to the same candle area of High then its considered a valid double top and vice versa for double bottom. 1. It plots and high and low on visible chart if ChartChange is set to true else it searches on new bar opening 2. If there is double top and double bottom found in visible chart window then it plots a line 3. It has options to customize text color, te
FREE
Break of Structure
Rajesh Kumar Nait
市场结构是在更高的时间范围内突破时可能有助于清除交易者趋势的结构。 1. 该指标将之字折线仅绘制到最后 2 个结构(之字折线的前高点和低点),并且仅当结构发生突破时才会形成之字折线的新柱 2.它给终端和推送通知结构中断 3.通过[和]键增加和减少ZigZag的Extdepth来调整摆动 4.更改线AB BC和CD的颜色 5.添加到许多图表并获得多个符号的警报 如果您正在寻找结构断裂 Multi ExtDepth Breakout Multi Symbol Scanner 您可以使用此产品: Multi Symbol Multi ExtDepth ZigZag Breakout Scanner 市场结构是在更高的时间范围内突破时可能有助于清除交易者趋势的结构。 1. 该指标将之字折线仅绘制到最后 2 个结构(之字折线的前高点和低点),并且仅当结构发生突破时才会形成之字折线的新柱 2.它给终端和推送通知结构中断 3.通过[和]键增加和减少ZigZag的Extdepth来调整摆动 4.更改线AB BC和CD的颜色 5.添加
Fibonacci Font Label
Rajesh Kumar Nait
该指标允许您以大字体显示斐波那契水平标签 。 它支持多达 25 个斐波那契水平 - 一旦您绘制斐波那契,它就会显示您作为输入参数添加的水平,并以大字体大小以及您选择的颜色和字体。 可定制选项: 1.Fibo文本字体 2. 斐波那契文本大小 3. 斐波那契文本颜色 3.为每个级别添加描述 4. 其他选项,例如锚点和度数 该指标允许您以大字体显示斐波那契水平标签 。 它支持多达 20 个斐波那契水平 - 一旦您绘制斐波那契,它就会显示您作为输入参数添加的水平,并以大字体大小以及您选择的颜色和字体。 可定制选项: 1.Fibo文本字体 2. 斐波那契文本大小 3. 斐波那契文本颜色 3.为每个级别添加描述 4. 其他选项,例如锚点和度数 该指标允许您以大字体显示斐波那契水平标签 。 它支持多达 20 个斐波那契水平 - 一旦您绘制斐波那契,它就会显示您作为输入参数添加的水平,并以大字体大小以及您选择的颜色和字体。 可定制选项: 1.Fibo文本字体 2. 斐波
Real Spinning Top Candlestick
Rajesh Kumar Nait
5 (3)
真正的陀螺指示器 它检测图表上准确的陀螺,平衡的主体和灯芯高度比,这是陀螺的真正含义,不同于锤子和十字线或空烛台。 该指标在图表上找到的陀螺数量处绘制了一个翼形图标。 设置包括 条数:调整搜索条数 图标颜色:更改图标颜色 图标代码:更改图标的wingdings代码 真正的陀螺指示器 它检测图表上准确的陀螺,平衡的主体和灯芯高度比,这是陀螺的真正含义,不同于锤子和十字线或空烛台。 该指标在图表上找到的陀螺数量处绘制了一个翼形图标。 设置包括 条数:调整搜索条数 图标颜色:更改图标颜色 图标代码:更改图标的wingdings代码 真正的陀螺指示器 它检测图表上准确的陀螺,平衡的主体和灯芯高度比,这是陀螺的真正含义,不同于锤子和十字线或空烛台。 该指标在图表上找到的陀螺数量处绘制了一个翼形图标。 设置包括 条数:调整搜索条数 图标颜色:更改图标颜色 图标代码:更改图标的wingdings代码
FREE
Crypto Ticks and Depth
Rajesh Kumar Nait
5 (1)
EA 的加密货币实时报价数据买价和卖价以及预订深度 可用兑换: 1.币安现货(支持活动图表窗口上的订单簿深度)和期货(支持多个订单簿深度) 2. Kucoin现货和期货,支持活动图表窗口的订单簿深度 3.Bybit期货和反向期货价格变动数据最后出价 即将推出的交易所:OKX、MEXC 等.. 特征 : 1. 带有出价和要价信息的实时报价数据 2. 最佳买价和订单数量,用户可以从设置中启用/禁用深度 3. 加载历史记录:更新开盘高低收盘量和跳动量数据 4. 自动更新历史记录:重启MT5终端时填充缺失的栏 5. 您可以使用策略测试器对加密数据使用您的 EA 交易对加密交易品种的任何策略进行回溯测试 6. 该实用程序不需要加载任何外部DLL文件,并且可以在VPS上运行。 7. 自动重新连接:如果买价/卖价因网络故障而停止更新,用户可以自定义输入秒数以强制重新连接到 websocket。 注意:Webrquest 函数不支持在策略测试器上运行,因此演示将无法运行。 如果想要demo可以私信联系我 将 URL
适用于 MT5 的币安交易工具 1. 本产品包括来自websocket的实时图表、历史图表、 mt5终端重启时自动更新,使其运行流畅,零人工干预,让您体验顺畅交易币安。 现货和期货交易、实时图表和历史数据 如何使用 : 1. 您需要在此实用程序的输入字段中添加您的 API 密钥和密码。 创建 API 时,请确保启用 Futures 来交易 Futures 3. 您需要按照工具 > 选项 > 允许来自 URL 选项卡的 Web 请求添加 Binance api URL,并勾选允许 Web 请求复选框 币安现货 网址 1:api.binance.com 网址 2:stream.binance.com 币安期货 网址 1:fapi.binance.com 网址 2:fstream.binance.com 将这些信息添加到 MT5 中的 Utiltiy 和 Webrequest 中以测试模拟交易 Binance Spot Testnet(测试交易工具) 网址 1:testnet.binance.vision 前缀:api 币安期
多符号双击图表上的任意位置以设置价格警报并从终端警报或推送通知中获得通知 1. 在图表上添加 EA Utility 2. 按 <- 左或 -> 右箭头键浏览图表 3. 双击图表上的任意位置,它会添加一条线,拖动这条线以设置您想要的价格,瞧,警报已设置! 当价格达到该线时,它会根据实用程序的设置通过终端或推送通知通知您。 即使您重新启动终端,此警报也会继续工作。 4. 继续浏览多品种并继续在您希望收到警报通知的许多图表上添加线条。 5. 如果您想重新开始,请按 D 删除您设置的所有警报。 6. 删除水平线,警报将被禁用。 -- 多符号双击图表上的任意位置以设置价格警报并从终端警报或推送通知中获得通知 1. 在图表上添加 EA Utility 2. 按 <- 左或 -> 右箭头键浏览图表 3. 双击图表上的任意位置,它会添加一条线,拖动这条线以设置您想要的价格,瞧,警报已设置! 当价格达到该线时,它会根据实用程序的设置通过终端或推送通知通知您。 即使您重新启动终端,此警报也会继续工作。 4. 继续浏览多品种并继续在您希望收到警
多货币前蜡烛或前柱扫描仪可帮助您扫描具有从指标设置中选择的任何自定义时间范围的多品种图表。 基于产品: https://www.mql5.com/en/market/product/110229 它可用于扫描前一天高低、前一周高低、上个月高低或任何自定义时间范围的多个交易品种,例如 前 4 小时图高低 当价格触及高线或低线时,它会过滤噪音并发出方向警报 策略很简单,当触及前一天、一周或一个月的高点和低点时,价格会在较小的时间范围(如 5 分钟)内被拒绝 它具有选择各种警报类型的选项 您可以选择并设置扫描频率(以毫秒为单位) 1000 表示每秒扫描市场观察中的所有交易品种 产品特点 1. 终端警报 2. 电子邮件提醒 3. 推送通知 多货币前蜡烛或前柱扫描仪可帮助您扫描具有从指标设置中选择的任何自定义时间范围的多品种图表。 基于产品: https://www.mql5.com/en/market/product/78657 它可用于扫描前一天高低、前一周高低、上个月高低或任何自定义时间范围的多个交易品种,例
Crypto to MT5
Rajesh Kumar Nait
Crypto.com 到 MT5 从 Crypto.com websocket 到 Metatrader 5 的实时烛台流 它是 OHCLV(高开低收真实交易量)实时汇率数据  交易者,如果在一分钟图表中,OHLC 数据不正确,那么它可能会在技术图表研究中给出错误的分析,该产品确保它提供实时准确的数据,有助于手动分析 您可以在我的个人资料中查看我的其他加密产品 https://www.mql5.com/en/users/rajeshnait/seller 1. OHLCV 数据 2.支持和创建多个符号 3. 您需要添加 Crypto.com websocket 和 api URL,如工具 > 选项 > 允许来自 URL 选项卡的 Webrequest 并勾选 Allow Webrequest 复选框 - Websocket URL:stream.crypto.com - API URL:api.crypto.com 4. 图表绘制于 GMT+0 时区(Crypto.com 的服务器时间) 5. 不进行 DLL 调用
完美秒图表指示器可让您将分钟蜡烛转换为秒 1. 选择任意秒数以准确时间 100% 关闭柱。 2. 这是基于费率的数据,即使没有蜱虫可用,它也能工作。 3.无需外部DLL,在VPS上运行流畅 4. 快速且优化的代码 5. 支持BInance、Kucoin等加密货币对以及所有其他交易所,期货图表可以轻松转换为秒。 6. 支持所有类型的交易品种,例如黄金和外汇对。 7. 删除符号和汇率的选项。 完美秒图表指示器可让您将分钟蜡烛转换为秒 1. 选择任意秒数以准确时间 100% 关闭柱。 2. 这是基于费率的数据,即使没有蜱虫可用,它也能工作。 3.无需外部DLL,在VPS上运行流畅 4. 快速且优化的代码 5. 支持BInance、Kucoin等加密货币对以及所有其他交易所,期货图表可以轻松转换为秒。 6. 支持所有类型的交易品种,例如黄金和外汇对。 7. 删除符号和汇率的选项。
该指标最多绘制 6 个级别,可以根据交易者的要求启用/禁用以使图表更清晰 这 6 个级别分为 2 组:高和低 对于每组,可以选择不同的时间范围 它基于先前高低反转的策略,因为它认为当价格达到每日、每周或每月高低时,价格通常会在更小的时间范围内(如 5 分钟)显示拒绝 特征 : - 在单个图表中跟踪多达 6 个时间帧高低点 - 在这些级别设置警报,邮件、推送或终端警报,当价格触及这些级别时,您将立即收到警报 - 自定义关卡样式,包括线条样式、宽度、颜色等 - 班次:想要跟踪或研究第 2 天或第 3 天的高低?您可以将 shift 设置为 2 用于 2nd Bar 的 High Low 或 3 设置为 3rd Bar 的 High Low 等等。 该指标最多绘制 6 个级别,可以根据交易者的要求启用/禁用以使图表更清晰 这 6 个级别分为 2 组:高和低 对于每组,可以选择不同的时间范围 它基于先前高低反转的策略,因为它认为当价格达到每日、每周或每月高低时,价格通常会在更小的时间范围内(如 5 分钟)显示拒绝 特征 : - 在单个图
Cobra Pivot Points 是一个用于绘制最佳优化枢轴点的指标,您可以通过下载 DEMO 自行回测。 1. 选择两种最佳枢轴模式:Cobra Pivots 或 Camrilla Pivots 2. 您可以使用任何时间范围,不限于 D1。 3. 您可以使用 Shift 参数来调整前一天的高低收盘值。 1 = 前一柱,2 = 前一柱之前的柱,依此类推。这些参数将帮助您研究和开发枢轴。 4. 触摸级别后发出警报、电子邮件或推送通知。 一旦触及水平,枢轴水平将被视为缓解,因此不会再次提醒您。 如果您想再次发出警报,则需要更改时间范围以重置警报。 5. 完全自定义线条颜色、线条样式、线条宽度、文本颜色和字体。 Cobra Pivots 分为三个区域:LZone(非常接近的剥头皮水平)、NZone(当市场盘整时)和 HZone(距离稍远的水平最适合头寸交易),可以在指标设置中显示/隐藏。 卡姆里拉枢轴公式为:     LS1 = 前一日收盘价- ((前一日最高价-前一日最低价)*0.50);     LS2 = 前一日收盘价- ((前
枢轴点多符号扫描仪扫描市场观察中可用的所有符号,以查找地板、伍迪、卡玛利拉、丹麦或斐波那契枢轴点。 您可以选择任何时间范围来计算枢轴点,并在价格触及这些支撑位和阻力位时收到警报。 对于视觉枢轴点您可能对此产品感兴趣: https://www.mql5.com/en/market/product/110072 它具有选择各种警报类型的选项 您可以选择并设置扫描频率(以毫秒为单位) 1000 表示每秒扫描市场观察中的所有交易品种 产品特点 1. 终端警报 2. 电子邮件提醒 3. 推送通知 枢轴点多符号扫描仪扫描市场观察中可用的所有符号,以查找地板、伍迪、卡玛利拉、丹麦或斐波那契枢轴点。 您可以选择任何时间范围来计算枢轴点,并在价格触及这些支撑位和阻力位时收到警报。 对于视觉枢轴点您可能对此产品感兴趣: https://www.mql5.com/en/market/product/110231 它具有选择各种警报类型的选项 您可以选择并设置扫描频率(以毫秒为单位) 1000 表示每秒扫描市场观察中的
将此指标添加到图表并设置 ZigZag 的 ExtDepth 设置 当价格触及趋势线上、下或中通道时,它会立即发出警报 特征 : -启用/禁用上、下或中线的警报 - 在几秒钟内发出警报后添加暂停 - 使用图表上的按钮暂停或取消暂停趋势通道 - 通过在输入字段中添加点来添加早期警报,例如 ETH 价格是 2900.25,这里的数字 25 是“点”,所以如果您在输入字段中添加 25 以点为单位,并且如果趋势通道下线的值为 2900.25,那么您将在 2900.50 获得早期警报(从设置中增加 25 点) - 启用/禁用定向触摸,更多信息请参见屏幕截图,当价格触及底部阻力和顶部支撑时考虑定向触摸,添加此功能是为了避免来自多个警报的噪音 如果您在 1 分钟到 5 分钟图表中交易,Extdepth 的推荐设置为 55 如果您交易 1 小时到 4 小时图表,Extdepth 的推荐设置为 21 您可以根据图表上的需要调整任何其他 Extdepth,找到最佳趋势通道并暂停它并等待买入或卖出警报, 此外,您可以使用价格行为信息或蜡烛形态来验证反转。 您可以将其添加到许多
三角形图案的图案浏览器,例如对称三角形、不对称三角形或直角三角形,楔形图案,例如上升楔形或下降楔形,扩展图案和趋势通道 该指标探索历史模式以及当前模式,对于那些试图通过手动绘制趋势线或三角形来节省时间并希望将其用于自动分析在图表上绘制最佳模式的人来说,它是最佳指标 特征 : - 用于立即更改 ZigZag 扩展深度以调整并找到最佳模式的面板 - 将模式转移回之前的之字形柱以探索过去发生的事情,您可以探索趋势线是否受到尊重,了解价格走势 并通过探索以前的历史模式,使用该指标分析和学习它们,得出一个总体策略 - 从切换按钮立即从趋势通道或趋势线切换到楔形或三角形模式 - 暂停以冻结模式,因此模式不会改变并继续检查价格触摸以获取警报 - 触摸级别的多种类型的警报:邮件、推送、终端和打印通知 - 通过调整点启用早期警报,以便您在价格接近水平时提前收到警报并准备入场 - 趋势通道:启用/禁用上、中或下线警报 - 目标:对于三角形和楔形,它会自动设置目标,这是您必须买入卖出的有趣区域,如果您是突破交易者,您可以在那里预订利润或等待价格行动进行反转交易
Kraken 加密交易所期货历史更新面板 特征 : 1. 它将根据设置创建符号并完全更新历史记录,可从 Kraken API 获取符号。 此面板使用开盘高低收盘数据更新 Kraken 期货品种的历史记录,它还会在历史更新完成时打印消息。 请注意,这不是实时数据。   3.您需要添加Kraken API URL,如工具>选项>允许来自URL选项卡的Webrequest并勾选允许Webrequest复选框 - API URL:futures.kraken.com 4.消耗更少的内存和CPU 5.终端重启自动更新缺失数据! 每当你打开终端,最新的数据就准备好了! 6. 不进行 DLL 调用 -- Kraken 加密交易所期货历史更新面板 特征 : 1. 它将根据设置创建符号并完全更新历史记录,可从 Kraken API 获取符号。 此面板使用开盘高低收盘数据更新 Kraken 期货品种的历史记录,它还会在历史更新完成时打印消息。 请注意,这不是实时数据。   3.您需要添加Kraken API URL,如工具>选项>允许来自UR
5 EMA Scalping Strategy Multi Symbol Scanner This EA utility will scan all symbols which are selected in marketwatch and alert when such condition is formed in chart when Candle low is above EMA 5 for Sell alert and Candle high is lower from EMA5 so you can be ready before selling or buying for scalping purpose on 5min chart For more details watch attached video Logic : When a candle closes above 5 EMA in 5 mins chart, Wait for its low to break and Sell when low is broken by wick, Your SL sh
Multi Symbol ZigZag Breakout Scanner 扫描在 marketwatch 中选择的所有符号。 当价格即将达到这些水平时,它将有助于轻松找到双顶、双底或任何斐波那契扩展水平。 您可以选择时间范围,以及 Zigzag 的多个 Extdepths(最多 3 个)。 推荐的 ZigZag 为 21,34 和 55,涵盖所有类型的 Zigzag 和过滤噪声 您可以设置接收终端警报或推送通知或两者 Multi Symbol ZigZag Breakout Scanner 扫描在 marketwatch 中选择的所有符号。 当价格即将达到这些水平时,它将有助于轻松找到双顶、双底或任何斐波那契扩展水平。 您可以选择时间范围,以及 Zigzag 的多个 Extdepths(最多 3 个)。 推荐的 ZigZag 为 21,34 和 55,涵盖所有类型的 Zigzag 和过滤噪声 您可以设置接收终端警报或推送通知或两者
Fibo Musang FMBCR CB1 突破扫描器 MT5 Fibo Musang CB1 或 Candle Break 1 是一种非常适用于黄金 XAUUSD 和其他外汇交易品种的策略。 此扫描仪将帮助您非常快速地扫描多符号货币并在 FMCBR CB1 突破时获得警报 请查看视频了解更多详情,因为它完全可以根据交易者的喜好进行定制: 1. 您可以选择柱线的时间范围和历史记录 2. 您可以修改您喜欢的 ZigZag 设置:ExtDepth、ExtDeviation、ExtBackStep 3.获取终端警报或推送通知 4. 追踪斐波那契扩展的选项,如 1.618 2.618 或 4.236 或追踪 CB1 突破与 1.00 Fibo Musang FMBCR CB1 突破扫描器 MT5 Fibo Musang CB1 或 Candle Break 1 是一种非常适用于黄金 XAUUSD 和其他外汇交易品种的策略。 此扫描仪将帮助您非常快速地扫描多符号货币并在 FMCBR CB1 突破时获得警报 请查看视频了解更多详情,因为它
多符号双击图表上的任意位置以设置价格警报并从终端警报或推送通知中获得通知 1. 在图表上添加 EA Utility 2. 按 <- 左或 -> 右箭头键浏览图表 3. 双击图表上的任意位置,它会添加一条线,拖动这条线以设置您想要的价格,瞧,警报已设置! 当价格达到该线时,它会根据实用程序的设置通过终端或推送通知通知您。 即使您重新启动终端,此警报也会继续工作。 4. 继续浏览多品种并继续在您希望收到警报通知的许多图表上添加线条。 5. 如果您想重新开始,请按 D 删除您设置的所有警报。 6. 删除水平线,警报将被禁用。 -- 多符号双击图表上的任意位置以设置价格警报并从终端警报或推送通知中获得通知 1. 在图表上添加 EA Utility 2. 按 <- 左或 -> 右箭头键浏览图表 3. 双击图表上的任意位置,它会添加一条线,拖动这条线以设置您想要的价格,瞧,警报已设置! 当价格达到该线时,它会根据实用程序的设置通过终端或推送通知通知您。 即使您重新启动终端,此警报也会继续工作。 4. 继续浏览多品种并继续在您希望收到警
Control Candle is the candlestick which holds multiple inside bars and are in control until its high low range is broken by close of any candlestick. When control candle is broken, price may act on these control candle as support and resistance. This indicator create rectangles on chart which will help you find control candles fast. Control candle indicator box is customizable by color, style, width and other options in indicator settings.
该指标可有效跟踪您想要在同一图表上跟踪的任何其他时间范围烛台 1. 选择任何更高的时间范围来加载同一图表上的柱形图 2.自定义烛台的颜色和样式 3. 选择绘制烛台的柱数 4. 跟踪更高时间范围的完整蜡烛以及烛芯和实体 5. 对于那些不想切换图表的人来说,简单方便。 该指标可有效跟踪您想要在同一图表上跟踪的任何其他时间范围烛台 1. 选择任何更高的时间范围来加载同一图表上的柱形图 2.自定义烛台的颜色和样式 3. 选择绘制烛台的柱数 4. 跟踪更高时间范围的完整蜡烛以及烛芯和实体 5. 对于那些不想切换图表的人来说,简单方便。 该指标可有效跟踪您想要在同一图表上跟踪的任何其他时间范围烛台 1. 选择任何更高的时间范围来加载同一图表上的柱形图 2.自定义烛台的颜色和样式 3. 选择绘制烛台的柱数 4. 跟踪更高时间范围的完整蜡烛以及烛芯和实体 5. 对于那些不想切换图表的人来说,简单方便。
Cobra Pivot Points 是一个用于绘制最佳优化枢轴点的指标,您可以通过下载 DEMO 自行回测。 1. 选择两种最佳枢轴模式:Cobra Pivots 或 Camrilla Pivots 2. 您可以使用任何时间范围,不限于 D1。 3. 您可以使用 Shift 参数来调整前一天的高低收盘值。 1 = 前一柱,2 = 前一柱之前的柱,依此类推。这些参数将帮助您研究和开发枢轴。 4. 触摸级别后发出警报、电子邮件或推送通知。 一旦触及水平,枢轴水平将被视为缓解,因此不会再次提醒您。 如果您想再次发出警报,则需要更改时间范围以重置警报。 5. 完全自定义线条颜色、线条样式、线条宽度、文本颜色和字体。 Cobra Pivots 分为三个区域:LZone(非常接近的剥头皮水平)、NZone(当市场盘整时)和 HZone(距离稍远的水平最适合头寸交易),可以在指标设置中显示/隐藏。 卡姆里拉枢轴公式为:     LS1 = 前一日收盘价- ((前一日最高价-前一日最低价)*0.50);     LS2 = 前一日收盘价- ((前
多货币前蜡烛或前柱扫描仪可帮助您扫描具有从指标设置中选择的任何自定义时间范围的多品种图表。 基于产品: https://www.mql5.com/en/market/product/78657 它可用于扫描前一天高低、前一周高低、上个月高低或任何自定义时间范围的多个交易品种,例如 前 4 小时图高低 当价格触及高线或低线时,它会过滤噪音并发出方向警报 策略很简单,当触及前一天、一周或一个月的高点和低点时,价格会在较小的时间范围(如 5 分钟)内被拒绝 它具有选择各种警报类型的选项 您可以选择并设置扫描频率(以毫秒为单位) 1000 表示每秒扫描市场观察中的所有交易品种 产品特点 1. 终端警报 2. 电子邮件提醒 3. 推送通知 多货币前蜡烛或前柱扫描仪可帮助您扫描具有从指标设置中选择的任何自定义时间范围的多品种图表。 基于产品: https://www.mql5.com/en/market/product/78657 它可用于扫描前一天高低、前一周高低、上个月高低或任何自定义时间范围的多个交易品种,例如
枢轴点多符号扫描仪扫描市场观察中可用的所有符号,以查找地板、伍迪、卡玛利拉、丹麦或斐波那契枢轴点。 您可以选择任何时间范围来计算枢轴点,并在价格触及这些支撑位和阻力位时收到警报。 对于视觉枢轴点您可能对此产品感兴趣: https://www.mql5.com/en/market/product/110072 它具有选择各种警报类型的选项 您可以选择并设置扫描频率(以毫秒为单位) 1000 表示每秒扫描市场观察中的所有交易品种 产品特点 1. 终端警报 2. 电子邮件提醒 3. 推送通知 枢轴点多符号扫描仪扫描市场观察中可用的所有符号,以查找地板、伍迪、卡玛利拉、丹麦或斐波那契枢轴点。 您可以选择任何时间范围来计算枢轴点,并在价格触及这些支撑位和阻力位时收到警报。 对于视觉枢轴点您可能对此产品感兴趣: https://www.mql5.com/en/market/product/110072 它具有选择各种警报类型的选项 您可以选择并设置扫描频率(以毫秒为单位) 1000 表示每秒扫描市场观察中的
筛选:
无评论
回复评论