• Genel bakış
  • İncelemeler (6)
  • Yorumlar (24)
  • Yenilikler

RSI Divergence Scanner MT5

5

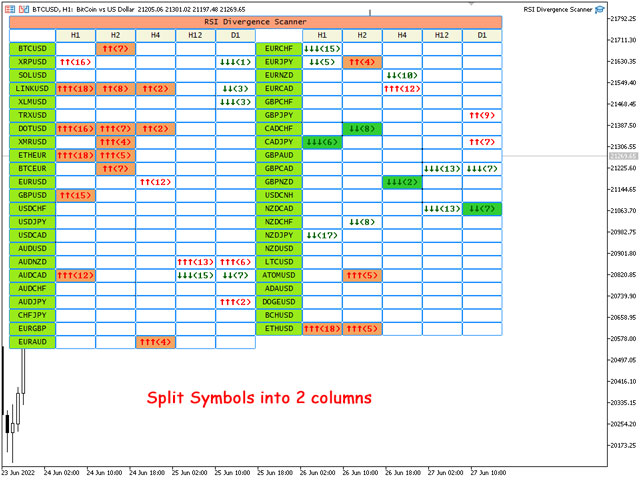
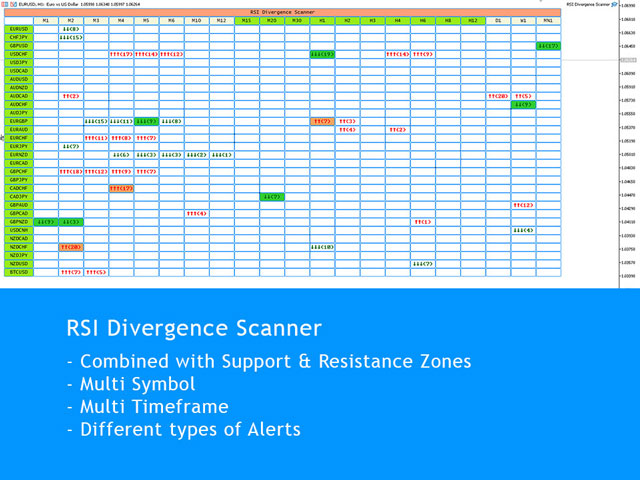
RSI Divergence Scanner is a multi-timeframe and multi-symbol dashboard and alert that checks all timeframes and symbols to find regular and hidden divergences between price chart and RSI indicator.

This divergence scanner is integrated with support and resistance zones so you can check the RSI divergences in the most important areas of the chart to find trend reversals in price chart.

Download demo version (works on M4,M5,M6,M12,H3,H8 timeframes)

Full description of scanner parameters -> click here.

How to get the most from the scanner -> read this article.

Using RSI divergences alongside other technical tools like price action, candlestick patterns and support resistance zones gives reliable signals for possible trend reversals.

If you are using RSI Divergence in your trading strategy, this scanner helps you find the best opportunities to trade without spending much time in front of your system.

RSI Divergence Scanner Features:

  • Scanner finds both regular (classic) and hidden divergences
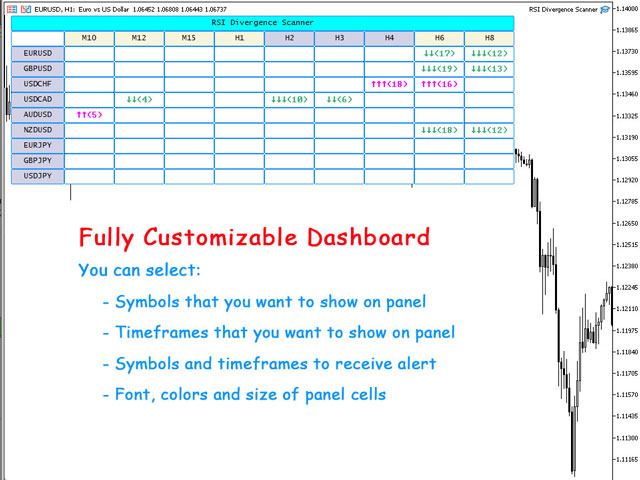
  • Run the dashboard on one chart and see the RSI Divergence for all selected symbols and timeframes.
  • You can set the scanner to only search for divergences that occur in overbought/oversold levels (that you set in parameters).
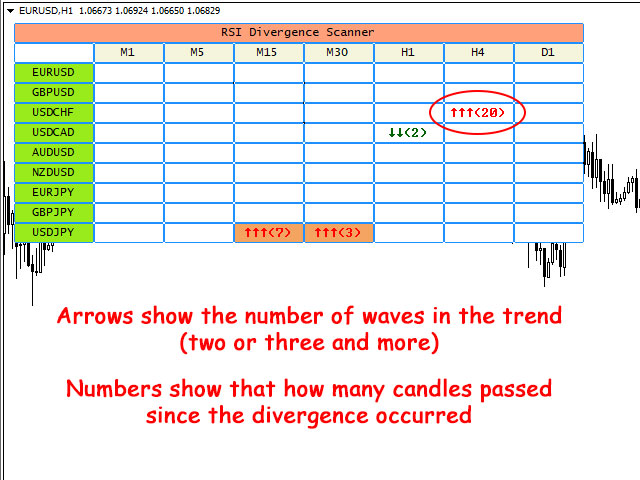
  • The panel shows that how many candles passed since the divergence occurred.
  • The panel shows the number of trend waves (2 or 3 and more) that leads to the divergence.
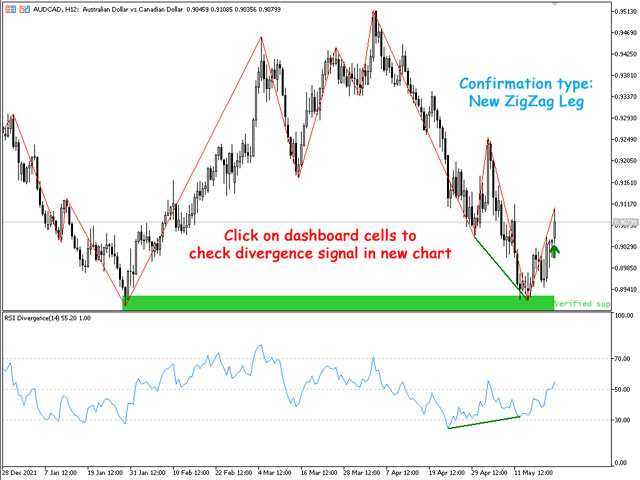
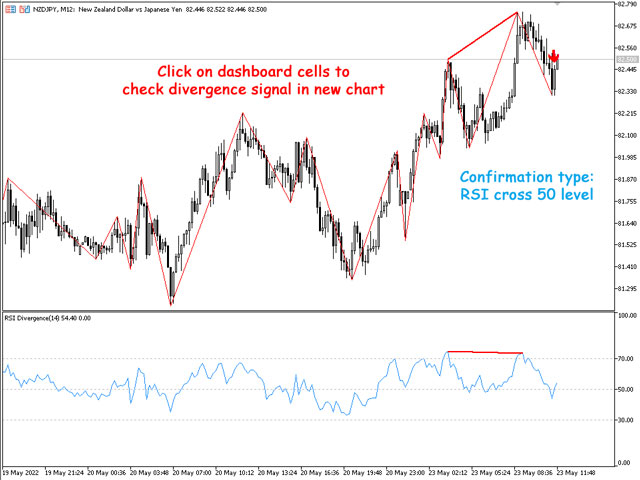
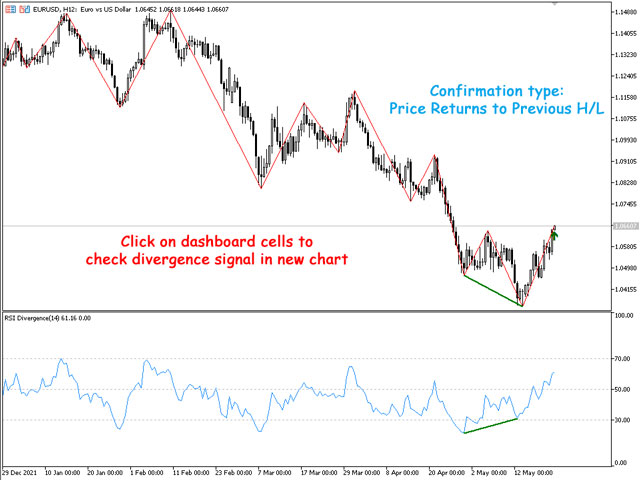
  • When you click on table cells, you can see the S/R zone, divergence line and divergence arrow on the opened price chart.
  • You can split the symbols into 2 or 3 columns to show more symbols on the chart.
  • You can separate symbols into multiple dashboards with different parameters for each dashboard (for example for different markets).
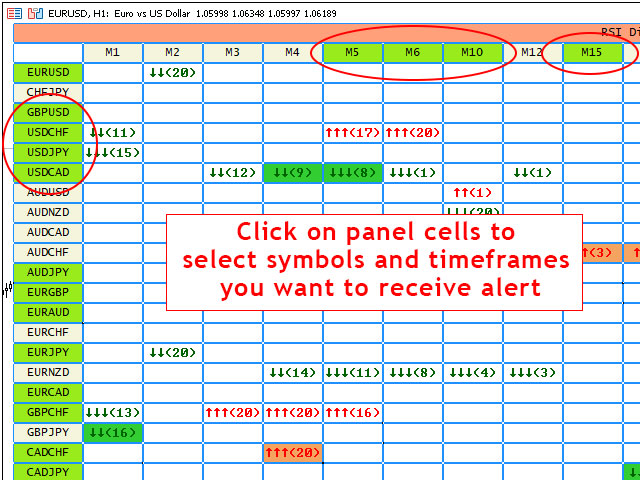
  • You can enable/disable alerts for symbols and timeframes directly from the scanner dashboard.
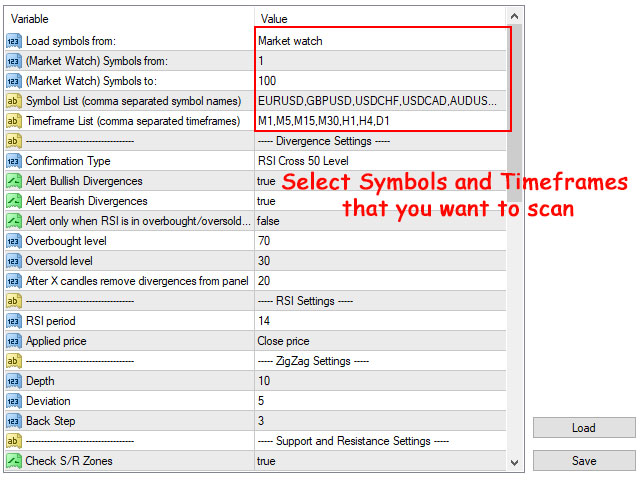
  • Scanner works in all markets (Forex, Stocks, Indices, Commodities, Crypto ...), you can write the symbol names in the settings (comma separated) or simply set the scanner to read the symbols from market watch.

Different confirmations for divergences

There are 7 confirmation option for RSI divergences that you can select in input parameters:

  • Candlestick Patterns
  • RSI line cross 50 level
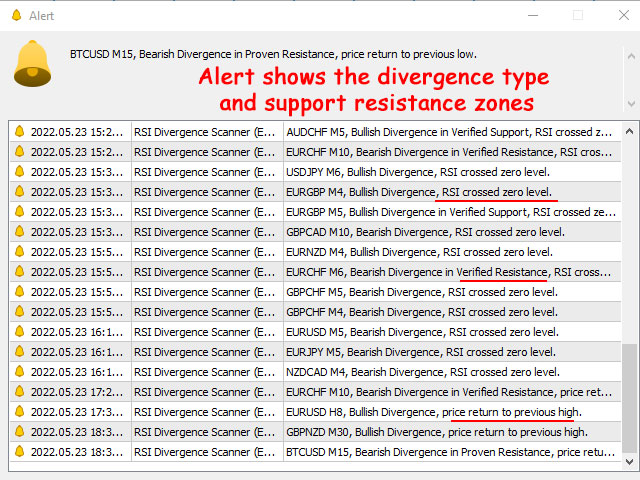
  • Price returns to previous H/L (known as change of character or momentum shift)
  • Heiken Ashi indicator - Changing the Color
  • Stochastic indicator - Lines Cross
  • Strong Reversing Candle (may not happen)
  • Immediate alert without confirmation

Integrated with support and resistance zones

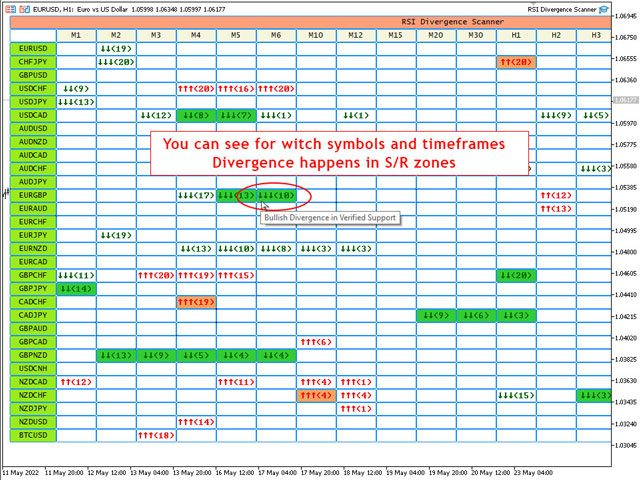
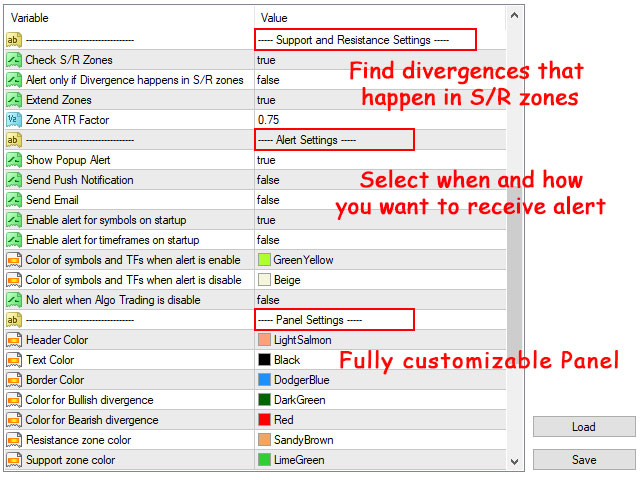
  • You can set the scanner to only receive alerts for RSI divergences that are inside the support and resistance zones.
  • You can see witch RSI divergences happen in support resistance zones through cell colors.
  • You can set the parameters for support and resistance zones in scanner input parameters.
  • Support and resistance zones are calculated based on shved supply and demand indicator that you can download for free from this link (scanner doesn't need it).

Different Alert Types:

You can enable the following alerts at the same time in the scanner settings.

  • Show Pop Up Alert: Show alert window when scanner alert triggers.
  • Send Push Notification: Send push notification to mobile phone when scanner alert triggers. (You should set metatrader Notifications options)
  • Send Email: Send email when scanner alert triggers. (You should set metatrader Email options)

Notes:

  • RSI Divergence Scanner uses ZigZag indicator to determine trend direction and HH/LL of the price, you can change the ZigZag parameters in the indicator's input window.
  • You can add the free RSI Divergence Indicator to your default chart template, so when you click on the dashboard cells, you can see the divergence on the opened chart (dashboard doesn't need the indicator to run).
  • Dashboard works smoothly for 50 symbols and all 21 timeframes on an average PC, you can add more symbols when you reduce the number of timeframes.
  • If there are many symbols in the market watch, in the first run of the scanner on the chart it may take some time to load the history data for all timeframes of all symbols.
  • If you don't want to find RSI divergences on W1 and MN1 timeframes, don't load them on the dashboard. Charts must have at least 300 candles for checking the trend and finding the divergences.
  • Dashboard updates every 1-minute candle open time, run it on more volatile symbols like EURUSD and BTCUSD to receive new price ticks faster.

İncelemeler 6
Vladimir Shramchenko
425
Vladimir Shramchenko 2024.10.17 11:04 
 

Thank you for your hard work. A very high-quality product that shows the rapidly turning formations of the market. And you can quickly apply it in your Trading System.

JAMTRADERS
36
JAMTRADERS 2024.05.30 11:34 
 

great tool for traders who use RSI divergence as tool when trading. very easy to use and it lessen my time scanning the market for possible entry

(less time scanning---->less stress--->less emotion----->GOOD TRADING)

thank you so much sir

simon.metivier
76
simon.metivier 2024.03.06 01:29 
 

It's a wonderful tool, it helps saving me a lot of time looking for divergence on multiple instruments with several Timeframe on each. I am using divergences without confirmation and all are spot on everytime and pop instantly at the close of the candle. If there was one thing I'd like to add, it would be the possibility to receive alert for divergences without confirmation and (at the same time) with confirmation (Candlestick Pattern or another type). Because I like to work and see which type of confirmation is best for working indices. Again thanks for your great work.

Önerilen ürünler
MACD Divergence Scanner is a multi-timeframe and multi-symbol dashboard and alert that checks all timeframes and symbols to find regular and hidden divergences between price chart and MACD indicator. This divergence scanner is integrated   with support and resistance zones so you can check the MACD divergences in the most important areas of the chart to find trend reversals in the price chart. Download demo version   (works on M4,M5,M6,M12,H3,H8 timeframes) Full description of scanner parameters
Introducing the Consecutive Green/Red Candle Alert Indicator for MT5 - Your Trend Spotting Companion! Are you ready to take your trading to the next level? We present the Consecutive Green/Red Candle Alert Indicator, a powerful tool designed to help you spot trends and potential reversals with ease. Whether you're a new trader looking for clarity in the market or an experienced pro seeking additional confirmation, this indicator is your trusted companion. Key Features of the Consecutive Gre
Wolfe Wave Scanner MT5
Reza Aghajanpour
5 (5)
**  All Symbols  x  All Timeframes  scan just by pressing scanner button ** *** Contact me  to send you instruction and add you in "Wolfe Wave Scanner group" for sharing or seeing experiences with other users. Introduction: A Wolfe Wave is created with five-wave patterns in price. It shows supply and demand and a fight towards a balance price. T hese waves of price actions can help traders identify the boundaries of   the trend . Also  It helps forecast how the price will move in the near futu
The Penta-O is a 6-point retracement harmonacci pattern which usually precedes big market movements. Penta-O patterns can expand and repaint quite a bit. To make things easier this indicator implements a twist: it waits for a donchian breakout in the right direction before signaling the trade. The end result is an otherwise repainting indicator with a very reliable trading signal. The donchian breakout period is entered as an input. [ Installation Guide | Update Guide | Troubleshooting | FAQ | A
Cumulative delta indicator As most traders believe, the price moves under the pressure of market buying or selling. When someone redeems an offer standing in the cup, the deal is a "buy". If someone pours into the bid standing in the cup - the deal goes with the direction of "sale". The delta is the difference between purchases and sales. A cumulative delta - the difference between the cumulative sum of purchases and sales for a certain period of time. It allows you to see who is currently contr
This indicator can automatically scan the RSI values of all varieties on the mt5 and set an alarm. Note that it is fully automatic scanning, you do not need to enter which varieties, do not need to open the variety chart, as long as there are some varieties in the market quotation column, will be automatically scanned to reach the set rsi alarm value, will pop up the alarm, and cycle with the market changes to scan the latest RSI values of all varieties, and alarm. This is very helpful t
KopierMaschine - локальный копировщик сделок между различными счетами MetaTrader 4 и MetaTrader 5 в любом направлении расположенных на одном компьютере с интуитивно понятным интерфейсом. Направления копирования: MT4 --> MT5 MT4 --> MT4 MT5 --> MT5 MT5 --> MT4 для копирования между терминалами MetaTrader 4 и   MetaTrader   5 необходимо приобрести версию продукта   KopierMaschine  для    MetaTrader  4 Особенности Программа работает в двух режимах Master и Slave На один подчиненный счет можно коп
Schaff Trend Cycle STC
Mohammad Taher Halimi Tabrizi
The Schaff Trend Cycle indicator is the product of combining Slow Stochastics and the moving average convergence/divergence (MACD). The MACD has a reputation as a trend indicator, but it's also notorious for lagging due to its slow responsive signal line. The improved signal line gives the STC its relevance as an early warning sign to detect currency trends. this indicator is converted from Trading View code of STC Indicator - A Better MACD [SHK]
Gartley Projections D
Oleksandr Medviediev
3 (2)
The indicator identifies the harmonic patterns (XABCD) according to developments of H.M.Gartley ( "Profits in the Stock Market" , 1935г). It projects D-point as a point in the perspective projection (specify ProjectionD_Mode = true in the settings). Does not redraw. When a bar of the working timeframe closes, if the identified pattern point has not moved during Patterns_Fractal_Bars bars, an arrow appears on the chart (in the direction of the expected price movement). From this moment on, the ar
ATrend
Zaha Feiz
4.83 (6)
ATREND: Nasıl Çalışır ve Nasıl Kullanılır ### Nasıl Çalışır "**ATREND**" göstergesi, MT5 platformu için tasarlanmış olup, traderlara sağlam alım ve satım sinyalleri sağlamak amacıyla teknik analiz metodolojilerinin bir kombinasyonunu kullanır. Bu gösterge, öncelikle volatilite ölçümü için Ortalama Gerçek Aralık (ATR) kullanır ve potansiyel piyasa hareketlerini belirlemek için trend tespit algoritmalarıyla birleştirir. Satın aldıktan sonra bir mesaj bırakın ve özel bir bonus hediyesi kazanın. ##
Price Breakout pattern Scanner is the automatic scanner for traders and investors. It can detect following patterns automatically from your chart. Head and Shoulder - Common tradable pattern. Reverse Head and Shoulder - This pattern is the reverse formation of the Head and Shoulder. Double Top - When the price hits resistance level twice and decline toward the support level, the trader can anticipate sudden bearish breakout through the support level. Double Bottom - The double bottom pattern is
FXC iMACD-DivergencE MT5 Indicator This is an advanced MACD indicator that finds trend-turn divergences on the current symbol. The indicator detects divergence between the MACD and the price movements as a strong trend-turn pattern. Main features: Advanced divergence settings Price based on Close, Open or High/Low prices Give Buy/Sell open signals PUSH notifications E-mail sending Pop-up alert Customizeable Information panel Input parameters: MACD Fast-EMA: The Fast-EMA variable of the MACD
Introducing the Power Trade Plus indicator designed by a small group of traders with a few years of experience trading the market profitably.  The Power Trade Plus is derived from the Power Trade indicator,  the indicator strive in powerful sniper entries and take profit levels,  with an algorithm that's can determine the markets volatility and Provides entries based on the current market volatility. This indicator is much more effective in stock ,currencies and indices.
DarwinIA Gümüş Derecelendirme 95,09 - Aylık Tahsis 145.000 € - Temmuz 2024 Bu, Darwinex Zero'da kullanmak üzere yalnızca bir kopyası satılacak olan özel, türünün tek örneği bir Uzman. Darwinex'te kopya ticaretinin sıkı kontrolü olduğundan, özel uzmanların kullanılması zorunludur. Bu Uzman, Darwinex'in kuralları ve beklentileriyle tamamen uyumludur. Bu Uzman, fiyat hareketini, gücü ve eğilimi titizlikle analiz eden bir avcı olarak işlev görür. İşini olağanüstü bir etkinlikle gerçekleştirmek iç
This plots  Fibonacci deviation levels above and below a moving average of the price. Companion indicator to the " Golden Bull Wave Trader "  expert advisor which uses volume\price trend to determine price reversals. https://www.mql5.com/en/market/product/56291 The expert advisor and this indicator were created in order to: Identify ideal and repeatable trade entries with high level of certainty Create a day trading strategy which doesn’t require a hard SL and TP Use alternate risk management me
Introduction to X3 Chart Pattern Scanner X3 Cherart Pattern Scanner is the non-repainting and non-lagging indicator detecting X3 chart patterns including Harmonic pattern, Elliott Wave pattern, X3 patterns, and Japanese Candlestick patterns. Historical patterns match with signal patterns. Hence, you can readily develop the solid trading strategy in your chart. More importantly, this superb pattern scanner can detect the optimal pattern of its kind. In addition, you can switch on and off individu
Introduction to Chart Pattern MT Chart Pattern MT is a chart pattern scanner to detect the triangle pattern, falling wedge pattern, rising wedge pattern, channel pattern and so on. Chart Pattern MT uses highly sophisticated chart pattern detection algorithm. However, we have designed it in the easy to use with intuitive user interface. Chart Pattern MT will show all the patterns in your chart in the most efficient format for your trading. You do not have to do tedious manual pattern detection an
MACDivergence MTF MT5
Pavel Zamoshnikov
4 (5)
Advanced ideas of the popular MACD indicator: It detects and displays classic and reverse divergences (two methods of detecting divergences). It uses different color to highlight an uptrend and a downtrend. Two methods of determining a trend: а) MACD crosses the 0 level (classic signal); б) MACD crosses its own average (early signal). This is a multi-timeframe indicator: it can display MACD data from other timeframes. Two methods of drawing: classic histogram and line. It generates sound and vis
Elliott Wave Trend was designed for the scientific wave counting. This tool focuses to get rid of the vagueness of the classic Elliott Wave Counting using the guideline from the template and pattern approach. In doing so, firstly Elliott Wave Trend offers the template for your wave counting. Secondly, it offers Wave Structural Score to assist to identify accurate wave formation. It offers both impulse wave Structural Score and corrective wave Structure Score. Structural Score is the rating to sh
Description : Rainbow EA MT5 is a simple Expert advisor based on   Rainbow MT5 indicator witch is based on Moving average with period 34. The indicator is incorporated in the EA, therefore, it is not required for the EA to operate, but if you wish, you can download it from   my product page . The Expert Advisor settings are as follows : Suitable for Timeframes up to H1 The parameters below can be set according to your trading rules. StopLoss ( Stop Loss in pips) TakeProfit ( Take Profit in pi
Noize Absorption Index - is the manual trading system that measures the difference of pressure between bears forces and bulls forces. Green line - is a noize free index that showing curent situation. Zero value of index shows totally choppy/flat market.Values above zero level shows how powerfull bullish wave is and values below zero measures bearish forces.Up arrow appears on bearish market when it's ready to reverse, dn arrow appears on weak bullish market, as a result of reverse expectation.
Atomic Analyst MT5
Issam Kassas
4.32 (19)
Öncelikle belirtmek gerekir ki bu Ticaret Göstergesi Yeniden Çizim Yapmaz, Gecikmez ve Gecikme Göstermez, bu da hem manuel hem de robot ticareti için ideal hale getirir. Kullanıcı kılavuzu: ayarlar, girişler ve strateji. Atom Analisti, Piyasada Daha İyi Bir Avantaj Bulmak İçin Fiyatın Gücünü ve Momentumunu Kullanan PA Fiyat Hareketi Göstergesidir. Gürültüleri ve Yanlış Sinyalleri Kaldırmaya ve Ticaret Potansiyelini Artırmaya Yardımcı Olan Gelişmiş Filtrelerle Donatılmıştır. Birden fazla katmanl
KT Renko Patterns MT5
KEENBASE SOFTWARE SOLUTIONS
KT Renko Patterns scans the Renko chart brick by brick to find some famous chart patterns that are frequently used by traders across the various financial markets. Compared to the time-based charts, patterns based trading is easier and more evident on Renko charts due to their uncluttered appearance. KT Renko Patterns features multiple Renko patterns, and many of these patterns are extensively explained in the book titled Profitable Trading with Renko Charts by Prashant Shah. A 100% automate
Göreceli Güç Endeksi (RSI) göstergesinin çoklu para birimi ve çoklu zaman çerçeveli modifikasyonu. Parametrelerde istediğiniz para birimini ve zaman dilimlerini belirtebilirsiniz. Ayrıca panel aşırı alım ve aşırı satım seviyelerini geçerken bildirim gönderebilir. Noktalı bir hücreye tıkladığınızda bu sembol ve nokta açılacaktır. Bu MTF Tarayıcıdır. Kontrol panelini grafikten gizlemenin anahtarı varsayılan olarak "D"dir. Para Birimi Gücü Ölçer'e benzer şekilde, Kontrol Paneli belirli bir par
Premium seviye, %80'den fazla doğru tahmin doğruluğuna sahip benzersiz bir göstergedir! Bu gösterge en iyi Ticaret Uzmanları tarafından iki aydan uzun süredir test edilmiştir! Yazarın göstergesini başka hiçbir yerde bulamazsınız! Ekran görüntülerinden bu aracın doğruluğunu kendiniz görebilirsiniz! 1, sona erme süresi 1 mum olan ikili opsiyon ticareti için harikadır. 2 tüm döviz çiftleri, hisse senetleri, emtialar, kripto para birimleri üzerinde çalışır Talimatlar: Kırmızı ok görün
Identify precise entry and exit points with AB=CD patterns This indicator finds AB=CD retracement patterns. The AB=CD Retracement pattern is a 4-point price structure where the initial price segment is partially retraced and followed by an equidistant move from the completion of the pullback, and is the basic foundation for all harmonic patterns. [ Installation Guide | Update Guide | Troubleshooting | FAQ | All Products ] Customizable pattern sizes Customizable AC and BD ratios Customizab
Incinerat8
Paulos Ngwenya
This algorithm uses real time data to generate signals with an accuracy rate of 80%. It shows entries and where you should place both the stoploss and the take profit for each trade. It determines trend! It can even help you to become a signal provider! And it can generate up to 8 signals a day! You get access to a free forex trading community  Operates on any broker compatible to synthetic indices and forex   if you need any assistance whatsapp +2774 35 35 744 or telegram link @pipsempire01
An Ultimate Tool  for quick and efficient market analysis. Unique combination of solid indicators defining market direction for trend tracking and filtration designed for you to stay on the   right   side of the market. Market Rider Oscillators  gives you access to one of the most used from professional trades indicators on worldwide, which were not build in for MT4 and MT5 terminals . These are unique non-repainting oscillators designed to be used on all time frames for all instruments class
Gann Kutusu (veya Gann Meydanı), W.D. Gann'ın "Piyasa tahminleri için matematiksel formül" makalesine dayanan bir pazar analiz yöntemidir. Bu gösterge üç Kare modelini çizebilir: 90, 52(104), 144. Altı ızgara çeşidi ve iki yay çeşidi vardır. Bir grafik üzerinde aynı anda birden fazla kare çizebilirsiniz. Parametreler Square — kare modelin seçimi : 90 — 90'ın karesi (veya dokuzun karesi); 52 (104) — 52'nin karesi (veya 104); 144 — 144'ün evrensel karesi; 144 (full) — karenin "tam" versiyonu
Now, you have your own AUTO-CLOSE program ! Once your account target or drawdown hits, all open orders will be closed automatically. ========================================== INPUTS: Account target:   Put the exact account target. Once the equity hits it or went above that, all orders closed. Please add buffer to consider slippage. Use fixed value or dynamic value:   Choose whether you will need a fixed value or dynamic value for drawdown.  DYNAMIC SETTINGS: Equity-based or Balance-based drawdo
Bu ürünün alıcıları ayrıca şunları da satın alıyor
Trade Assistant MT5
Evgeniy Kravchenko
4.37 (166)
It helps to calculate the risk per trade, the easy installation of a new order, order management with partial closing functions, trailing stop of 7 types and other useful functions. Attention, the application does not work in the strategy tester. Manual, Description, Download demo Line function -   shows on the chart the Opening line, Stop Loss, Take Profit. With this function it is easy to set a new order and see its additional characteristics before opening.   Risk management  - The risk
Trade Manager EA’ye hoş geldiniz! Ticaretin daha sezgisel, hassas ve verimli hale gelmesi için tasarlanmış nihai risk yönetim aracı ile tanışın. Bu sadece bir emir verme aracı değil; ticaret planlaması, pozisyon yönetimi ve risk kontrolü için kapsamlı bir çözüm. İster yeni başlayan bir yatırımcı olun, ister deneyimli bir trader ya da hızlı emir gerektiren bir scalper, Trade Manager EA ihtiyaçlarınıza uyum sağlar ve forex, endeksler, emtialar ve kripto paralar dahil tüm piyasalarda esneklik sunar
TradePanel MT5
Alfiya Fazylova
4.85 (115)
Ticaret Paneli çok işlevli bir ticaret asistanıdır. Uygulama, manuel ticaret için 50'den fazla işlev içerir ve çoğu ticaret eylemini otomatikleştirmenize olanak tanır. Satın almadan önce Demo sürümünü bir demo hesabında test edebilirsiniz. Demo burada . Talimatların tamamı burada . Ticaret. Tek tıklamayla temel alım satım işlemlerini gerçekleştirmenize olanak tanır: Bekleyen emirleri ve pozisyonları açın. Bir sipariş tablosu açılıyor. Bekleyen emirleri ve pozisyonları kapatın. Pozisyonların ters
Riskinizi otomatik olarak hesaplarken işlemlere hızlı bir şekilde girip çıkmanıza yardımcı olacak Ticaret Yöneticisi. Aşırı Ticaret, İntikam Ticareti ve Duygusal Ticaretten korunmanıza yardımcı olacak özellikler içerir. İşlemler otomatik olarak yönetilebilir ve hesap performans ölçümleri bir grafikte görselleştirilebilir. Bu özellikler, bu paneli tüm manuel yatırımcılar için ideal kılar ve MetaTrader 5 platformunun geliştirilmesine yardımcı olur. Çoklu Dil desteği. MT4 Sürümü  |  Kullanım Kılavu
Tired of complex order placement and manual calculations? Trade Dashboard is your solution. With its user-friendly interface, placing orders becomes effortless, by a single click, you can open trades, set stop loss and take profit levels, manage trade lot size, and calculate risk to reward ratios, allowing you to only focus on your strategy. Say goodbye to manual calculations and streamline your trading experience with Trade Dashboard. Download  Demo Version  right now. You can find  Details of
Özel Uyarılar, sekiz ana para biriminin (USD, CAD, GBP, EUR, CHF, JPY, AUD ve NZD) yanı sıra ALTIN (XAU), bu para birimlerine dayalı 28 Forex ve ALTIN çiftinin tümü ve US30, UK100, WTI, Bitcoin gibi yedi endekse kadar umut verici kurulumları tanımlayan çok yönlü bir çoklu piyasa izleme aracıdır. Tamamen özelleştirilebilir. Araç, FX Power, FX Volume ve IX Power göstergelerimizden veri toplar ve önemli olayları size bildirir.   Başlamadan önce, bu çoklu piyasa tarayıcısının sağladığı tüm seçene
Exp COPYLOT CLIENT for MT5
Vladislav Andruschenko
4.08 (24)
MT5 için ticari kopyalayıcı, МetaТrader 5 platformu için bir ticari kopyalayıcıdır   . arasındaki   forex işlemlerini kopyalar.       COPYLOT MT5 sürümü için   herhangi bir hesap   MT5   -   MT5, MT4   -   MT5 (veya COPYLOT MT4 sürümü için   MT4 -   MT4 MT5   -  MT4) Güvenilir fotokopi makinesi! MT4 sürümü Tam tanım   +DEMO +PDF Nasıl alınır Nasıl kurulur     Günlük Dosyaları nasıl alınır?     Nasıl Test Edilir ve Optimize Edilir     Expforex'in tüm ürünleri Ayrıca МТ4 terminali   (МТ4  
The product will copy all telegram signal to MT5 ( which you are member) , also it can work as remote copier.  Easy to set up, copy order instant, can work with almost signal formats, image signal,  s upport to translate other language to English Work with all type of channel or group, even channel have "Restrict Saving Content", work with  multi channel, multi MT5 Work as remote copier: with signal have ticket number, it will copy exactly via ticket number. Support to backtest signal. How to s
Üye olduğunuz herhangi bir kanaldan (özel ve kısıtlı olanlar dahil) sinyalleri doğrudan MT5'inize kopyalayın.  Bu araç, kullanıcıyı göz önünde bulundurarak tasarlanmış olup işlemleri yönetmek ve izlemek için ihtiyacınız olan birçok özelliği sunar. Bu ürün, kullanıcı dostu ve görsel olarak çekici bir arayüzde sunulmaktadır. Ayarlarınızı özelleştirin ve ürünü dakikalar içinde kullanmaya başlayın! Kullanıcı Kılavuzu + Demo  | MT4 Sürümü | Discord Sürümü Demo denemek isterseniz lütfen kullanıcı k
-25% discount ($199 -> $149) Advanced trading tool: One click smart orders that execute under your conditions Developed by trader for trading community:  position size calculator (lot size), open position after price action, strategy builder, set and forget trading, mobile notifications... Risk Management -  Risk percentage position size calculator, gain percentage, target risk reward ratio, spread and commissions are included in calculations 7 Advanced order types  - Set and forget trading w
1 tıklama ile ticaret için Ticaret Paneli.   Pozisyonlar ve emirlerle çalışmak!   Grafikten veya klavyeden alım satım. Alım satım panelimizi kullanarak, grafikten tek bir tıklamayla alım satım yapabilir ve alım satım işlemlerini standart MetaTrader kontrolünden 30 kat daha hızlı gerçekleştirebilirsiniz. Bir tüccar için hayatı kolaylaştıran ve bir tüccarın ticaret faaliyetlerini çok daha hızlı ve daha rahat gerçekleştirmesine yardımcı olan parametrelerin ve işlevlerin otomatik hesaplamaları. Gra
Trading Chaos Expert
Gennadiy Stanilevych
5 (10)
This software has no equals in the world and represents a universal trade "console" covering trading signals, automated market entry, setting of Stop Loss and Take Profit, as well as Trailing Profit for multiple trades at the same time in a single open window. Intuitive control of the Expert Advisor in "three clicks" ensures a comprehensive use of all its functions on different computers, including tablets PCs. Interacting with additional signal indicators that mark the chart to give a real mark
Trade Assistant 38 in 1
Makarii Gubaydullin
4.89 (18)
Çok amaçlı araçlar: Lot hesaplayıcı, fiyat analizi, risk/ödül oranı, pozisyon yönetici, arz  talep bölgelerini de içeren 65'den fazla fonksiyon Deneme sürümü   |   Kullanım Kılavuzu   |   MT4 Yardımcı program, strateji test cihazında çalışmaz: Ürünü test etmek için Demo Sürümünü BURADAN indirebilirsiniz. Sorularınız için iletişim İşlem sürecinizi kolaylaştırın, hızlandırın ve otomatikleştirin. Terminalin standart  özelliklerini bu program ile genişletin Yeni işlem açma : Lot / Risk / Risk/Ödül
DrawDown Limiter
Haidar, Lionel Haj Ali
5 (18)
Drawdown Limiter EA You are in the right place if you were searching for Drawdown control, Drawdown limiter, Balance protection, Equity Protection or Daily Drawdown Limit related to Prop Firm, FTMO, or Funded account trading, or if you want to protect your trading account. Have you suffered from controlling your drawdown when trading funded accounts? This EA is meant for you. Prop firms usually set a rule called “Trader Daily Drawdown”, and if it is not respected, you are disqualified.  I am an
The most advanced news filter and drawdown limiter on MQL market NEW: Take a Break can be backtested against your account history! Check the " What's new " tab for details. Take a Break has evolved from a once simple news filter to a full-fledged account protection tool. It pauses any other EA during potentially unfavorable market conditions and will continue trading when the noise is over. Typical use cases: Stop trading during news/high volatility (+ close my trades before). Stop trading when
Set price targets, and leave everything else to HINN Lazy Trader! This tool is designed for automatic position sizing from specified levels to designated targets. Using a VPS is recommended (*). The demo version   limited in functionality, be sure to watch this video before using -->  https://youtu.be/geLQ6dUzAr8 A community for users, product discussion, update news, and first line of support are organized in a free Discord: https://discord.gg/zFhEZc7QDQ Use Webmoney For payments in cryptocu
Hedge Ninja
Robert Mathias Bernt Larsson
3 (2)
Make sure to join our Discord community over at www.Robertsfx.com , you can also buy the EA at robertsfx.com WIN NO MATTER IN WHICH DIRECTION THE PRICE MOVES This robot wins no matter in which direction the price moves by following changing direction depending on in which direction price moves. This is the most free way of trading to this date. So you win no matter which direction it moves (when price moves to either of the red lines as seen on the screenshot, it wins with the profit target yo
ATTENTION the expert does not work in strategy tester, for a trial version visit my profile. Manual RiskGuard Management   RiskGuard management was born with the idea of ​​helping traders from their initial journey to becoming expert and aware traders. Compatible with any operating system whether Mac or Windows. The operations panel is integrated into the graph giving the possibility to choose size and position between right and left, while the various buttons light up when they can be used,
Grid Manual MT5
Alfiya Fazylova
4.88 (16)
Grid Manual, sipariş ızgarasıyla çalışmak için kullanılan bir ticaret yardımcı programıdır. Yardımcı program evrenseldir, esnek ayarlara ve sezgisel bir arayüze sahiptir. Sadece kayıpların ortalaması yönünde değil, aynı zamanda kazanç artışı yönünde de bir emir ızgarası ile çalışır. Tüccarın bir emir ızgarası oluşturmasına ve eşlik etmesine gerek yoktur, bu yardımcı programı yapacaktır. Emri açmanız yeterlidir ve Grid manual otomatik olarak ona bir emir ızgarası oluşturacak ve kapanana kadar ona
Auto Trade Copier is designed to copy trades to multiple MT4, MT5 and cTrader accounts/terminals with 100% accuracy. The provider and receiver accounts must be on the same PC/VPS. With this tool, you can copy trades to receiver accounts on the same PC/VPS. All trading actions will be copied from provider to receiver perfectly. This version can be used on MT5 accounts only. For MT4 accounts, you must use Auto Trade Copier (for MT4). Reference: - For MT4 receiver, please download Trade Receiver Fr
Bu Uzman Danışman, maliyetli düşüşleri önlemek ve/veya alım satım kurallarına uymak için alım satım hesabınızın öz sermayesini sürekli olarak izler. Belirli bir dizi kural ihlal edildiğinde, EA uyaracak, tüm işlemleri kapatacak ve bazı durumlarda bekleyen tüm emirleri silecektir. İsteğe bağlı olarak, hesapta çalışan tüm EA'ları kaldırmak için tüm çizelgeleri de kapatabilir. Bu EA, özellikle FTMO Challenge veya PZ Challenge gibi Prop Trading Challenges için kullanışlıdır. [ Kurulum Kılavuzu | Gü
The  Easy Strategy Builder (ESB)  is a " Do It Yourself " solution that allows you to create a wide range of the automated trading strategies without any line of codes. This is the world’s easiest method to automate your strategies that can be used in STP, ECN and FIFO brokers. No drag and drop is needed. Just by set conditions of your trading strategy and change settings on desired values and let it work in your account. ESB has hundreds of modules to define unlimited possibilities of strategi
Comprehensive on chart trade panel with the unique ability to be controllable from mobile as well. Plus has a library of downloadable configuration, e.g. exit rules, extra panel buttons, pending order setup and more. Please see our product video. Works with all symbols not just currency pairs. Features On chart panel plus controllable from free app for Windows, iPhone and Android Built-in script engine with library of downloadable configuration, e.g. add 'Close All Trades in Profit' button, exit
-25% discount ($149 -> $111) Everything for chart Technical Analysis indicator mt5 in one tool Draw your supply demand zone with rectangle and support resistance with trendline and get alerts to mobile phone or email alert -  Risk reward indicator mt5 Video tutorials, manuals, DEMO download   here .   Find contacts on my   profile . 1.   Extended rectangles and trendlines Object will be extended to the right edge of the chart when price will draw new candles on chart. This is rectangle extend
Fotokopi->Arayüz etkileşimi ->>>>Windows bilgisayarlarda veya VPS Windows'ta kullanılması önerilir Temel işlevler: Kopyalama ticareti etkileşiminin hızı 0,5 saniyeden azdır Farklı platformlardaki sembollerin %95'i (farklı ekler gibi özel durumlar) otomatik olarak eşleştirilir, temel olarak manuel ayar gerekmez Farklı sinyal kaynaklarına göre ayarlanabilen 4 lot hesaplama modu Birden fazla platform, birden fazla sinyal kaynağı, birden fazla alıcı isteğe göre birleştirilebilir (       MT4 ve MT5 v
YuClusters
Yury Kulikov
4.93 (42)
Attention: You can view the program operation in the free version  YuClusters DEMO .  YuClusters is a professional market analysis system. The trader has unique opportunities to analyze the flow of orders, trade volumes, price movements using various charts, profiles, indicators, and graphical objects. YuClusters operates on data based on Time&Sales or ticks information, depending on what is available in the quotes of a financial instrument. YuClusters allows you to build graphs by combining da
News Trade EA MT5
Konstantin Kulikov
4.5 (10)
Birkaç yıldır kullandığım çok yararlı bir robotu tanıtıyorum. Hem yarı otomatik hem de tam otomatik modlarda kullanılabilir. Program, ekonomik takvim haberlerinde esnek ticaret ayarlarını içeriyor. Stratejiler test cihazında kontrol edilemez. Sadece gerçek bir iş. Terminal ayarlarında, haberler sitesini izin verilen URL'ler listesine eklemeniz gerekir. Servisler > Araçlar > Danışmanlar'a tıklayın. "Aşağıdaki URL'ler için WebRequest'e İzin Ver:" kutucuğunu işaretle. Aşağıdakini ekleyin (boşluğ
Mentfx Mmanage mt5
Anton Jere Calmes
4.25 (8)
The added video will showcase all functionality, effectiveness, and uses of the trade manager. Drag and Drop Trade Manager. Draw your entry and have the tool calculate the rest. Advanced targeting and close portions of a trade directly available in tool (manage trades while you sleep). Market order or limit order on either side with factored spread. Just draw the entry, the tool does the rest. Hotkey setup to make it simple. Draw where you want to enter, and the stop loss, the tool calculates al
Effortlessly calculate lot sizes and manage trades to save time and avoid costly errors The Trade Pad Pro EA is a tool for the Metatrader Platform that aims to help traders manage their trades more efficiently and effectively. It has a user-friendly visual interface that allows users to easily place and manage an unlimited number of trades, helping to avoid human errors and enhance their trading activity. One of the key features of the Trade Pad Pro EA is its focus on risk and position managem
Adam FTMO MT5
Vyacheslav Izvarin
5 (2)
ADAM EA Special Version for FTMO Please use ShowInfo= false for backtesting ! Our 1st EA created using ChatGPT technology Trade only GOOD and checked PROP FIRMS  Default parameters for Challenge $100,000 Tested on EURUSD and GBPUSD only  Use 15MIN Time Frame Close all deals and Auto-trading  before Weekend at 12:00 GMT+3  Friday For Prop Firms MUST use special Protector  https://www.mql5.com/en/market/product/94362 -------------------------------------------------------------------------------
Yazarın diğer ürünleri
RSI divergence indicator finds divergences between price chart and   RSI   indicator and informs you with alerts (popup, mobile notification or email). Its main use is to find trend reversals in the chart. Always use the divergence indicators with other technical assets like support resistance zones, candlestick patterns and price action to have a higher possibility to find trend reversals. Three confirmation type for   RSI   divergences: RSI   line cross 50 level Price returns to previous H/L C
FREE
50% off. Original price: $60 Candlestick Pattern Scanner is a multi-timeframe and multi-symbol dashboard and alert system that checks all timeframes and currency pairs for different candlestick patterns that are formed in them. Scanner is integrated with support and resistance zones so you can check the candlestick patterns in the most important areas of the chart to find breakout and reversal patterns in the price chart. Download demo version   (works on M1,M5,M30,W1 timeframes) Read the full
40% off. Original price: $50 Support and Resistance Dashboard for MT4 is a multi-timeframe and multi-symbol scanner and alert system that finds S/R zones and pivot points for all timeframes and symbols and alerts when price has interaction with them. If you are using support and resistance (or supply and demand) zones in your trading strategy, this dashboard and its alert and filtering system is a big time saver for you. Download demo version   (works on M 1,M5,M30,W1   timeframes) Full descrip
MACD Divergence Scanner is a multi-timeframe and multi-symbol dashboard and alert that checks all timeframes and symbols to find regular and hidden divergences between price chart and MACD indicator. This divergence scanner is integrated   with support and resistance zones so you can check the MACD divergences in the most important areas of the chart to find trend reversals in the price chart. Download demo version   (works on M4,M5,M6,M12,H3,H8 timeframes) Full description of scanner parameters
MACD divergence indicator finds divergences between price chart and MACD indicator and informs you with alerts (popup, mobile notification or email) . Its main use is to find trend reversals in the chart. Always use the divergence indicators with other technical assets like support resistance zones, candlestick patterns and price action to have a higher possibility to find trend reversals. Three confirmation type for MACD divergences: MACD line cross zero level Price returns to previous H/L Crea
FREE
50% off. Original price: $60 Ichimoku Assistant is a multi-timeframe panel and alert system that scans all timeframes for multiple rules related to different ichimoku strategies. The Ichimoku indicator has 5 different lines, including Tenkan-sen, Kijun-sen, Senku Span A, Senku Span B and Chikou Span. This scanner checks the status of these lines compared to each other and gives alerts based on your selected rules. If you are using ichimoku kinko hyo in your trading strategy, this scanner and it
RSI Divergence Scanner is a multi-timeframe and multi-symbol dashboard and alert that checks all timeframes and symbols to find divergences between price chart and RSI indicator. This divergence scanner is integrated with support and resistance zones so you can check the RSI divergences in the most important areas of the chart to find trend reversals in the price chart. Download demo version   (works on M 1,M5,M30,W1 timeframes) Full description of scanner parameters ->   click here . How to get
50% off. Original price: $60 Candlestick Pattern Scanner is a multi-timeframe and multi-symbol dashboard and alert system that checks all timeframes and currency pairs for different candlestick patterns that are formed in them. Scanner is integrated   with support and resistance zones so you can check the candlestick patterns in most important areas of the chart to find breakout and reversal patterns in the price chart. Download demo version   (works on M4,M5,M6,M12,H3,H8 timeframes) Read the f
RSI divergence indicator finds divergences between price chart and RSI   indicator and informs you with alerts (popup, mobile notification or email). Its main use is to find trend reversals in the chart. Always use the divergence indicators with other technical assets like support resistance zones, candlestick patterns and price action to have a higher possibility to find trend reversals. Three confirmation type for RSI   divergences: RSI   line cross 50 level (doesn't repaint) Price returns to
FREE
40% off. Original price: $50 Moving Average Trend Scanner is a multi symbol multi timeframe triple MA crossover dashboard that helps traders to monitor, and identify potential market trends from one chart. This panel scans 3 moving averages in up to 28 configurable instruments and 9 timeframes for triple moving average alignment and moving average crossover  with a deep scan feature to scan all market watch symbols (up to 1000 instruments!). Download Demo here  (Scans only M1 and M5) Settin
Ichimoku Trend Alert is the Ichimoku Kinko Hyo indicator with Alerts and signal filters. Ichimoku Trend Alert features: Optional check of Ichimoku cloud, Tenkan sen(Conversion Line), Kijun sen(Base Line), Senkou span A, Senkou span B, and Chikou span relative to price, and more. Popup, email, and phone notification alerts for selected symbols and timeframes. There are 9 classic Ichimoku trend filters you can enable/disable in settings: Price/Cloud Order:   Checks the price position relative
FREE
40% off. Original price: $50 Moving Average Trend Scanner is a multi symbol multi timeframe triple MA crossover dashboard that helps traders to monitor, and identify potential market trends from one chart. This panel scans 3 moving averages in up to 28 configurable instruments and 9 timeframes for triple moving average alignment and moving average crossover with a deep scan feature to scan all market watch symbols (up to 1000 instruments!).   Download Demo   here   (Scans only M1 and M6) Sett
Moving Average Trend Alert is a triple MA indicator that helps traders to identify potential market trends based on 3 MAs alignment and crossover. Moving Average Trend Alert features: Customizable short-term, medium-term, and long-term MAs. Option to filter signals based on a minimum distance between moving averages to avoid premature MAs alignment. Optional Filter of signals with RSI indicator overbought/oversold levels. Optional Filter of signals with ADX indicator. Popup, email, and phone n
FREE
40% off. Original price: $50 Support and Resistance Dashboard for MT5 is a multi-timeframe and multi-symbol scanner and alert system that finds S/R zones and pivot points for all timeframes and symbols and alerts when price has interaction with them. If you are using support and resistance (or supply and demand) zones in your trading strategy, this dashboard and its alert and filtering system is a big time saver for you. Download demo version   (works on M4,M5,M6,M12,H3,H8 timeframes) Full desc
50% off. Original price: $60 Support and Resistance zones indicator for MT4 is a multi-timeframe panel and alert that finds support and resistance zones and pivot points for all timeframes of MetaTrader 4 and gives alert when price has interaction with them. Download demo version (works on GBPUSD, EURJPY and NZDUSD symbols) Read the full description of scanner parameters in the blog page . Many unique features in one indicator: Integrating support and resistance zones and pivot points in one
25% off. Original price: $40 RSI Scanner is a multi symbol multi timeframe RSI dashboard that monitors Relative Strength Index indicator for price entering and exiting overbought and oversold in up to 28 symbols and 9 timeframes. Download Demo here  (Scans only M1, M5 and M10) Settings description   here MT4 version   here RSI Scanner features: Signals RSI entering and exiting the overbought and oversold zones. Monitors 28 customizable instruments and 9 timeframes at the same time. Supports
MACD divergence indicator finds divergences between price chart and MACD indicator and informs you with alerts (popup, mobile notification or email). Its main use is to find trend reversals in the chart. Always use the divergence indicators with other technical assets like support resistance zones, candlestick patterns and price action to have a higher possibility to find trend reversals. Three confirmation type for MACD divergences: MACD line cross zero level Price returns to previous H/L Creat
FREE
50% off. Original price: $60 Order Manager is a trade assistant and trade copier with a money manager that helps traders open, modify and close manual trades and also copy their trades between multiple accounts in the most simple way to help them focus more on their market analysis and open orders with just a few clicks. Download Demo here  (It only works on demo accounts) Full guide   here MT5 version here Order Manager features: Works on all instruments such as currency pairs, indexes, CF
50% off. Original price: $375 Reward Multiplier is a semi-automatic trade manager based on pyramid trading that opens additional orders with the running profit of your trades to maximize return exponentially without increasing the risk. Unlike other similar EAs, this tool shows potential profit/loss and reward to risk ratio before even entering the first trade! Download Demo here  (starting lot is fixed at 0.01) Guide + tips here MT5 version   here You only open the first order. When your
Ichimoku Trend Alert is the Ichimoku Kinko Hyo indicator with Alerts and signal filters. Ichimoku Trend Alert features: Optional check of Ichimoku cloud, Tenkan sen(Conversion Line), Kijun sen(Base Line), Senkou span A, Senkou span B, and Chikou span relative to price, and more. Popup, email, and phone notification alerts for selected symbols and timeframes. There are 9 classic Ichimoku trend filters you can enable/disable in settings: Price/Cloud Order: Checks the price position relative to
FREE
Moving Average Trend Alert is a triple MA indicator that helps traders to identify potential market trends based on 3 MAs alignment and crossover. Moving Average Trend Alert features: Customizable short-term, medium-term, and long-term MAs. Option to filter signals based on a minimum distance between moving averages to avoid premature MAs alignment. Optional Filter of signals with RSI indicator overbought/oversold levels. Optional Filter of signals with ADX indicator. Popup, email, and phone n
FREE
Reward Multiplier is a semi-automatic trade manager based on pyramid trading that opens additional orders with the running profit of your trades to maximize return exponentially without increasing the risk.Unlike other similar EAs, this tool shows potential profit/loss and reward to risk ratio before even entering the first trade! Download full version here  ( In the mini version. Starting lot is fixed at 0.01 (or minimum allowed lot size ) Guide + tips here MT4 version   here You only open the
FREE
Advanced Indicator Scanner is a multi-symbol multi-timeframe scanner that works with hundreds of custom indicators available across the web including mql5 website market and codebase indicators. Advanced Indicator Scanner features: Scans your indicator in 28 customizable instruments and 9 timeframes. Monitors up to 2 lines(buffers) of an indicator. Showing of indicator value on buttons. You can choose between 3 alert modes:  Single symbol and timeframe Multiple timeframes of a symbol Multipl
50% off. Original price: $60 Triangle Finder is a multi symbol multi timeframe dashboard that monitors and finds symmetrical triangle pattern in 28 symbols and 9 timeframes with a deep scan feature to scan all market watch symbols (up to 1000 instruments!). Download Demo here  (Scans only M1 and M5) Settings description   here MT5 version   here Triangle Finder features: Realtime monitoring of 28 customizable instruments and 9 timeframes at the same time. Deep scan mode to scan all market w
25% off. Original price: $40 RSI Scanner is a multi symbol multi timeframe RSI dashboard that monitors Relative Strength Index indicator for price entering and exiting overbought and oversold in up to 28 symbols and 9 timeframes. Download Demo here  (Scans only M1 and M5) Settings description   here MT5 version   here RSI Scanner features: Signals RSI entering and exiting the overbought and oversold zones. Monitors 28 customizable instruments and 9 timeframes at the same time. You can choos
Reward Multiplier is a semi-automatic trade manager based on pyramid trading that opens additional orders with the running profit of your trades to maximize return exponentially without increasing the risk. Unlike other similar EAs, this tool shows potential profit/loss and reward to risk ratio before even entering the first trade! Download full version here  ( In the mini version. Starting lot is fixed at 0.01 (or minimum allowed lot size ) Guide + tips here MT5 version   here You only open the
FREE
40% off. Original price: $50 ATR Scanner Pro is a multi symbol multi timeframe volatility scanner that monitors and analyzes Average True Range indicator value in up to 28 symbols and 9 timeframes in 3 modes : ATR value:   As a volatility dashboard it shows the ATR indicator value in all pairs and timeframes and signals when the ATR value reaches a maximum or minimum in a given duration. Short term ATR/Long term ATR ratio:  It shows ratio of 2 ATRs with different periods. It's useful in detec
50% off. Original price: $60 Order Manager is a trade assistant and trade copier with a money manager that helps traders open, modify and close manual trades and also copy their trades between multiple accounts in the most simple way to help them focus more on their market analysis and open orders with just a few clicks. Download Demo here  (It only works on demo accounts for 14 days) Full guide   here MT4 version here Order Manager features: Works on all instruments such as currency pairs,
25% off. Original price: $40 Stochastic Scanner is a multi symbol multi timeframe Stochastic dashboard that monitors the indicator for price entering and exiting overbought and oversold in up to 28 symbols and 9 timeframes. Download Demo here  (Scans only M1, M5 and M10) Settings description   here MT4 version   here Stochastic Scanner features: Signals price entering and exiting the overbought and oversold zones. Monitors up to 28 customizable instruments and 9 timeframes at the same time.
50% off. Original price: $60 Triangle Finder is a multi symbol multi timeframe dashboard that finds symmetrical triangle pattern in 28 symbols and 9 timeframes with a deep scan feature to scan all market watch symbols (up to 1000 instruments!). Download Demo here  (Scans only M1, M5 and M10) Settings description   here MT4 version   here Triangle Finder features: Realtime monitoring of 28 customizable instruments and 9 timeframes at the same time. Deep scan mode to scan all market watch sym
Filtrele:
Vladimir Shramchenko
425
Vladimir Shramchenko 2024.10.17 11:04 
 

Thank you for your hard work. A very high-quality product that shows the rapidly turning formations of the market. And you can quickly apply it in your Trading System.

JAMTRADERS
36
JAMTRADERS 2024.05.30 11:34 
 

great tool for traders who use RSI divergence as tool when trading. very easy to use and it lessen my time scanning the market for possible entry

(less time scanning---->less stress--->less emotion----->GOOD TRADING)

thank you so much sir

simon.metivier
76
simon.metivier 2024.03.06 01:29 
 

It's a wonderful tool, it helps saving me a lot of time looking for divergence on multiple instruments with several Timeframe on each. I am using divergences without confirmation and all are spot on everytime and pop instantly at the close of the candle. If there was one thing I'd like to add, it would be the possibility to receive alert for divergences without confirmation and (at the same time) with confirmation (Candlestick Pattern or another type). Because I like to work and see which type of confirmation is best for working indices. Again thanks for your great work.

Amir Atif
70270
Geliştiriciden yanıt Amir Atif 2024.03.07 16:55
Hi Simon
Thank you for your positive feedback.
Adding an option to select 2 Confirmation type at the same time makes thing very complicated from the programming aspects. But you can run the scanner on 2 separate chart with different settings, it may slow down the scanners but is useful for finding the best settings for divergence signals.
Regards
Adama Diop
383
Adama Diop 2023.01.24 03:36 
 

Hi sir, where can I find the updated version? Mine doesn't show all the symbols I input ad it also doesn't show arrows or open chart when I click on it. Thanks

Amir Atif
70270
Geliştiriciden yanıt Amir Atif 2023.01.24 08:33
Hi Adama
For updating the scanner delete the previous version then install the new one. For loading your symbols, change the "Load symbols from" parameter and give the scanner enough time to load the history data for all symbols and timeframes, then click on cells to open the new chart and load divergence arrow and lines.
Please let me know if there are any problems.
Regards
Onuoha Osisioma
25
Onuoha Osisioma 2022.12.28 11:52 
 

a very expensive mistake of an application. would seriously want my money refunded to be frank and sincere. sent a mssg to mr atif. no response from him

Amir Atif
70270
Geliştiriciden yanıt Amir Atif 2022.12.28 13:56
Hi, I responded to your message 6 hours after you sent the message to me and gave you full instructions for solving your problem.
Looks like you don't check your messages. I'll attach the screenshot of my response in the comment section.
Regards
Ajuda Conf
28
Ajuda Conf 2022.10.05 17:23 
 

Powerful scan, I've adjusted the parameters for my operative and I'm making money from the market with the tool. It is very valuable, you will not regret it. Thank you very much.

İncelemeye yanıt
Sürüm 7.1 2024.06.23
! A few bug fixes for options that were added in the last version.
Sürüm 7.0 2024.05.30
+ "Hidden Divergence Ratios" section added to define the shape of the hidden divergence (like "Regular Divergence Ratios" section for regular divergences).
+ "Max. divergence candles" and "Min. divergence candles" options added to define the minimum and maximum time range of the divergences.
+ Now you can choose to calculate the ZigZag indicator with the close price of candles instead of the high and low prices. (experimental)
+ Minor bug fixes and improvements.
Sürüm 6.3 2023.11.02
+ The option “Mark divergences that happen after a long trend” added to the dashboard (for “Check trend length for regular divergences” parameter).
+ Improvement in detecting divergences with “Stochastic indicator” confirmation type.
+ Minor bug fixes and improvements.
Sürüm 6.2 2023.10.16
+ "Stochastic indicator" added for confirming the divergences, now you can choose to receive alert when the stochastic indicator lines cross each other. Also, you can set that the crossing must be in the overbought/oversold levels of the stochastic indicator.
+ Average body filter (for 2-bar and 3-bar patterns) and average height filter (for 1-bar patterns) parameters added to the dashboard, by enabling these filters you can set the dashboard to show only divergences that confirm by big size candlestick patterns.
+ Now you can use dashboard signals in your EAs. If you set the dashboard to show the divergences in new charts, then you can use the divergence information embedded in the Arrow name in your EA.
+ Now you can set the dashboard to mark the divergences that happen after a long trend (with L letter).
Sürüm 6.1 2023.09.19
+ Stochastic indicator confirmation type added to the scanner. By selecting this option, divergence will confirm when Stochastic lines cross each other. You also can choose that lines cross must be in overbought or oversell levels.
+ "Confirm with Candlestick Patterns before other confirmations" option added to the scanner, by enabling it the divergences must first be confirmed by candlestick patterns, then confirm by selected confirmation type.
+ Fixed a bug in detecting candlestick patterns.
Sürüm 6.0 2023.09.05
+ Candlestick patterns (10 patterns) added to "Confirmation type" parameter, with this option divergence will be confirmed if a candlestick pattern forms after it.
+ Now you can filter divergences with 2 Moving Average indicators from same or upper timeframes, you can set timeframe and period of these MAs separately for each timeframe of the dashboard.
+ You can reverse the Moving Average filters and find divergences that are in the opposite direction of the MA, also you can set for each filter to be applied to which type of divergence (regular, hidden or both), also the filters can be reversed separately.
+ An option added to the dashboard to not remove the failed divergences from the dashboard, it is useful when you want to practice the divergence trading.
+ Now you can choose what information to see on the dashboard cells: “Divergence type, candles passed” or “Divergence type, divergence direction, candles passed” or “Compact detailed info”.
+ A parameter added to the scanner to use a second ZigZag indicator for detecting more divergences. Enabling this parameter slows down the scanner, so use it if you are loading a limited number of symbols and timeframes in the dashboard.
- Some bug fixes and other improvements.
Sürüm 5.2 2023.03.24
Fixed a bug in changing the cell colors for S/R zones in the previous update.
Sürüm 5.1 2023.02.23
+ Added Moving Average indicator filter, you can now set the scanner to find divergences based on the direction of the moving average and/or the position of the divergence relative to the MA.
- Fixed a bug in loading symbols from the symbol list when the symbol names have lowercase letters.
Sürüm 5.0 2023.02.22
+ Now you can set the scanner to only find divergences that happen at the end of a long trend.
+ Two new confirmation type ("Changing the color of Heiken Ashi indicator" and "Strong Reversing Candle") added to the scanner and "New zigzag leg" confirmation type removed from the scanner.
+ Two filters (and their parameters) added for detecting the strong reversing candle.
+ You can choose to show the divergence lines and arrow on the opened charts with custom chart template (in addition to the default chart template).
+ Minor improvements and bug fixes.
Sürüm 4.0 2023.01.14
+ "Max. divergence pullback percent (Fibonacci retracement)" option added to the scanner, with this option you can set the maximum acceptable percent for the last pullback in the trend.
+ "Min. length ratio (last wave/previous wave)" options added to the scanner, with this parameter you can define the minimum acceptable length of the last wave of the trend compared to the length of the wave before it.
+ "Max. length ratio (last wave/previous wave)" options added to the scanner, with this parameter you can define the maximum acceptable length of the last wave of the trend compared to the length of the wave before it.
+ "Min. time ratio (last wave/previous wave)" parameter added to the scanner, with this parameter you can define the minimum acceptable duration of the last wave of the trend compared to the duration of the wave before it.
+ "Max. time ratio (last wave/previous wave)" parameter added to the scanner, with this parameter you can define the maximum acceptable duration of the last wave of the trend compared to the duration of the wave before it.
+ Improving the dashboard appearance.
- Fixing a bug where sometimes the dashboard didn't send immediate alert for new divergences.
Sürüm 3.6 2022.12.20
- "Min. divergence pullback percent (Fibonacci retracement)" option added to the scanner, this option helps to filter out regular divergences caused by small pullbacks in the trend.
- "Cell background color" option added for the dashboard.
Sürüm 3.5 2022.12.07
+ You can select for each symbol to alert only bullish or bearish divergences by clicking on its cell on dashboard.
+ Panel cells show the strength of divergences (weak, medium, strong).
+ Panel cells show when divergence happens in RSI oversold/overbought levels (by showing O letter in the cell).
+ You can see divergence lines for both price and RSI indicator when checking divergences in new charts.
+ You can see nearest support and resistance zones when checking divergences in new charts to see the price distance to S/R levels.
Sürüm 3.4 2022.10.29
+ A parameter added to enabling alerts for selected timeframes on startup of dashboard.
Sürüm 3.3 2022.09.28
+ Now you can split the symbols into 3 columns for showing more symbols in the dashboard on a single chart.
! Fixed a bug in receiving alerts when selecting “No Confirmation” option in the confirmation type parameter.
Sürüm 3.2 2022.09.10
Added a parameter to automatically open divergence chart after detecting the divergence, without clicking on dashboard cell.
Sürüm 3.1 2022.09.04
+ Added an option to receive alert immediately after divergence detected by scanner (before any confirmation, this may create repeated alerts).
Sürüm 3.0 2022.08.24
+ Finding hidden divergences added to the scanner.
+ Now you can load a custom chart template when clicking on the dashboard cells.
! Fixed a bug in showing the zones when MetaTrader starts up.
Sürüm 2.2 2022.06.28
Fixed a bug in splitting symbols into 2 columns.
Sürüm 2.1 2022.06.27
“Split symbols in 2 columns” option added to parameters, now you can show more symbols in dashboard on a single chart.