Смотри обучающее видео по маркету на YouTube
Как купить торгового робота или индикатор
Запусти робота на
виртуальном хостинге
виртуальном хостинге
Протестируй индикатор/робота перед покупкой
Хочешь зарабатывать в Маркете?
Как подать продукт, чтобы его покупали
Технические индикаторы для MetaTrader 5 - 71

ГАРМОНИЧЕСКИЕ ПАТТЕРНЫ OSW MT5
Этот индикатор отвечает за обнаружение гармонических паттернов, чтобы вы могли работать с ними, давая вам сигнал, чтобы вы могли добавить ручной анализ, принимаете ли вы ордер или нет.
Среди гармонических паттернов, которые обнаруживает индикатор:
>гартли
>летучая мышь
>Бабочка
>краб
>Акула
Среди функций, которые вы можете найти:
> Генерировать оповещения на почту, мобильный телефон и ПК
> Меняйте цвета гармоник, как при покупке, так и при прод
The Scalper v2 will give you accurate guidance to trade with. It has indications with arrows and it sends notifications. This software was built based on the RSI,MACD,Martingale, Ema 50 and 200, Aligator, SMA 30,50, ADX, Volumes percent range, variable dynamics and fibonacci levels. all of these indicators have something in common, it allows analysis, support and resistance, accurate signals for buy and sell, overbought and oversold market analysis. I have combined all of these indicators into o
The Adaptive EMA consists of 3 lines: Yellow, Blue and Red If a yellow line appears, it means the market is entering Consolidation, Range, Contraction and no opportunities are available. If a Blue line appears, It means prices are accumulating, and now being marked up, so you are now entering a buy market with a strong Bullish trend. If a Red line appears, it means prices are now being marked down, price distribution is underway, so you are now entering a Sell market with a strong Bearish trend.

Это многоцелевая система, которая подходит как ручным трейдерам Форекс, так и скальперской системе или стратеги и для получения очень сильного импульса, трей дерам бинарных опционов или для использования универсальными советниками в авт о матической торговле. Это многоцелевая система, которая подходит как ручным трейдерам Форекс, так и скальперской системе или стратеги и для получения очень сильного импульса, трей дерам бинарных опционов или для использования универсальными советниками в авто ма

Представляем нашу последнюю новинку в индикаторах MetaTrader 5, созданную для значительного улучшения вашего торгового рабочего процесса с помощью высокой функциональности и простоты использования. Он включает в себя мощный набор функций, разработанных для того, чтобы помочь вам оптимизировать анализ графиков и максимально использовать ваши торговые решения. Вот краткий обзор его потрясающих возможностей: Быстрое рисование объектов : Сэкономьте драгоценное время с функцией быстрого рисования. П
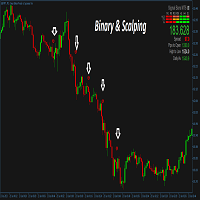
This is a trend following system for Binary options traders and forex scalpers. It is carefully crafted and recognizes periods of WATERFALL in the market and gives the trader the advantage and opportunity of riding with the momentum. It works on all timeframes and currency pairs especially high liquidity pairs. Avoid news events 15mins before and after. Always have your money management script or system in place. Tested on Deriv synthetics as well, please check screenshots. The mt4 version can b

Готовы ли вы выйти на новый уровень в своем торговом путешествии? Не ищите ничего, кроме MarketMagnet, этого новаторского индикатора, разработанного, чтобы стимулировать ваш торговый успех с волнением и точностью. Основанный на слиянии Momentum и CCI (индекс товарного канала), MarketMagnet предоставляет трейдерам окончательный инструмент для определения направления и цен входа для широкого спектра рекомендуемых валютных пар и инструментов. Если вы новичок, трейдер среднего уровня, у которого ес
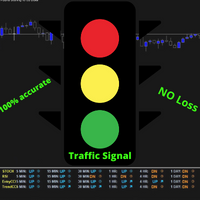
Представляем революционный индикатор MT5 под названием Traffic Signal - ваша несокрушимая ворота в мир успешной торговли! Разработанный с точностью и профессионализмом, Traffic Signal работает на основе специальной стратегии, которая использует мощь передовых технических индикаторов - RSI, Stochastics, CCI и Trends - на всех временных рамках. Приготовьтесь к невероятному торговому опыту, поскольку этот передовой индикатор предлагает вам наиболее точные сигналы для входа, позволяя вам навигироват

Smart Currency Strength is a powerful yet simple indicator that measures the strength of individual currencies.
It features a graphic panel that lists the main currencies and their strength in each timeframe, ranging from 0 (most oversold) to 100 (most overbought). The strength for all currencies in the current timeframe is also shown in a separate window as a multi-line graph, where each currency is represented with a different color, this allows you to monitor the evolution of strength tre

SourcePoint是一个很好的中长线交易指示器,他能独立使用,也可以去其他趋势型指标独立使用,可以很好的指出最佳的buy和sell位置,指标不含有未来函数,不会重新绘制,不仅能够应用到自己的手动交易过程中,还能完全可以写入到自己的EA中。建议配合BS TrendLine( https://www.mql5.com/zh/market/product/96476?source=Site+Market+My+Products+Page ) 一起使用。 (如果你感觉到这个指标能够帮助你进行更准确的交易,请帮忙给个好评,希望我的作品能够帮助更多有需要的人) ===================参数列表===================== fastP: 12 slowP:26 avgP:9 =================参考使用方法=================== 此指标可以适用于任何交易品种,能够用在任何周期。 每次形成一个交点,就是一个交易机会,同时也是一个持仓平仓点位。建议配合大小周期一起使用,这样更容易让你找到更精准的入场位置和出场位置

Moving Average Crossover Indicator. Add this Easy Indicator to your charts. The indicator indicates when to buy and when to sell. When the line is orange that is a sell signal. When the line is green that is a buy signal. Easy to use and colors can be changed so suit your charts. Easy to use. Follow the indicator and enter your buy and sell signals. Work on any market and on any timeframe.

Easy to use buy and sell signals with arrows. Non Repainting indicator. Non Lagging indicator. Down Arrows indicate sell and up arrows indicate buys. Works on any market and on any time frames. Arrow colors can be changed to match chart colors. Audible alerts. Periods can be changed to phase out false signals. Please remember to follow the trend like with any indicator.
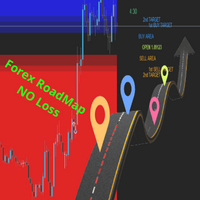
Представляем ROADMAP: ваш идеальный индикатор MT5 Forex для точного входа в сделку! Устали от постоянной неопределенности и догадок на рынке Forex? Вам сложно определить идеальные точки входа, зоны покупки и продажи или установить точные уровни стоп-лосса и тейк-профита? Вашим решением станет инновационный индикатор ROADMAP для MT5 Forex, который полностью изменит вашу торговую стратегию. ROADMAP разработан на основе специальной стратегии и дарит вам бесценные знания и точные расчеты, которые по

Scalping Entry Points - ручная торговая система, которая может подстраиваться под движения цены и давать сигналы для открытия сделок без перерисовки. Направление тренда индикатор определяет центральным уровнем поддержки и сопротивления. Точечный индикатор предоставляет сигналы для входов и выходов. Подходит для ручной торговли внутри дня, скальпинга и бинарных опционов. Работает на всех тайм-фреймах и торговых инструментах.
Индикатор дает несколько типов оповещений.
Как использовать продукт

Предлагаю попробовать торговать всем кому интересно по индикатору Lino Treand.
Lino Treand – это инструмент технического анализа, который использует математические вычисления, чтобы определить различные аспекты движения цен и основывается на исторических данных. Индикатор работает используя функцию циклично-волновой зависимости. Таким образом, все точки входа будут оптимальными точками, в которых изменяется движение. Lino Treand показывает особые аспекты движения цены и позволяет трейдерам со
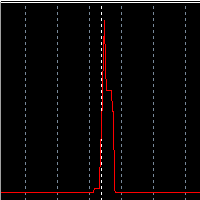
Hello! My name is Saullo and I am an MQL5/4 programmer specializing in custom services for Metatrader.
This is a very simple indicator that shows on the chart the history of the spread of each candle of the chart's asset.
Follow me on instagram: @saullo_algotrader
If you need custom development services for metatrader contact me on instagram. Thank you very much!

The Game-Changing Engulfing Candle Hunter - Your Guide to Profitable Trend Trading
Step into the realm of trading possibilities with our revolutionary product - The Engulfing Hunter. Designed by traders for traders, this dynamic indicator combines the potency of engulfing candlestick patterns and the versatility of proprietary trend detection system, offering a trading edge unlike any other. Engulfing candlestick patterns have always been a revered tool in the arsenal of seasoned traders. Acti

This indicator doesn't repaint & shows several things 1) Order Block 2) Imbalance candle stick (the icon is a vertical rectangle) 3) Swings (zigzag), 3 to be exact (minor, major and external major zigzags). If you know market structure, you should understand internal & external trends. Minor & major are internal trends of external major in this indicator. 4) Supply & Demand (arrow icon) 5) Major supply & demand (purple arrow) 6) Range/Bias lines (only shown in time frame 1hour & lower) 7) Previo
Индикатор "Benefit Predictor"
Это высокоточный инструмент для прогнозирования разворота цены на любом финансовом инструменте и любом таймфрейме. Этот продукт появился благодаря годам опыта и исследований в области анализа цен и других временных рядов, используя продвинутые методы машинного обучения и математического анализа.
Особенности продукта : Готовая торговая система, подходит как для ручной торговли, так и для использования в торговых роботах. Не перерисовывается после появления сигна
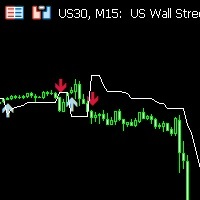
**Features:**
1. **Innovative Trend Tracking:** The UT BOT Simple Indicator leverages the power of the Average True Range (ATR), a renowned volatility measure, to calculate precise trailing stop values, providing unparalleled insights into market trends.
2. **Customizable Settings:** Flexibility is paramount in any trading strategy. With this in mind, our indicator allows you to adjust the ATR periods and other key parameters to tailor the tool to your trading style and strategy.
3. **Rea

Индикатор формирует входные сигналы по БИНАРНЫМ ОПЦИОНАМ, рисуя стрелку на графике и издавая звуковой сигнал.
ВРЕМЯ РАБОТЫ: 6.00 GMT/ 17.00 GMT (не рекомендуется после 17.00 GMT и ночью из-за слишком низкой волатильности и отсутствия объемов)
ПАРЫ: EUR/USD (@EU6), GBP/USD (BP6).
Таймфреймы: 1,2,3,5,10,15 минут Лучший таймфрейм: 3 минуты
СРОК ГОДНОСТИ: 1 свеча
Индикатору для работы нужны реальные объемы (без тиковых объемов): он не работает на спотовых парах EUR/USD, GBP/USD ECC, а на
Что такое индикатор волшебной матрицы валюты? Индикатор волшебной матрицы валюты - это графический инструмент, который показывает силу валюты. Обычные индикаторы обычно показывают силу валюты относительно другой валюты, однако с помощью некоторых расчетов можно найти абсолютную силу каждой отдельной валюты. Таким образом, индикатор волшебной матрицы валюты (или метр) - это инструмент, который пытается выразить абсолютную силу валюты, чтобы вы могли сравнить эту силу с силой других валют. Существ
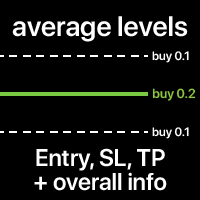
The average Entry, SL and TP levels of all trades on the Symbol. The levels can be calculated together, or separately for Buy and Sell trades. You can optionally display additional info: Level price, total Lot size, floating P/L. The styles and colors of the levels are customizable. My #1 Utility : includes 65+ functions | Contact me if you have any questions | MT4 version In the settings of the indicator, you can configure: Average Entry level: on/off; Average SL level: on/off; Average

Visualization of the trade deals, distributed by price levels. You can set any period for calculation: between 2 vertical lines, or set a fixed time interval. The histogram levels are relative: a wider bar means more trading volume. Distribution extremes can be used as a support and resistance levels.
All styles, sizes and colors are customizable. My #1 Utility : includes 65+ functions | Contact me if you have any questions | MT4 version In the settings of the indicator, you can config
MT5インジケータ TC-Alerts 開発経緯:
実はFXで簡単に勝てる手法があるんです。 それは。。。 主要な(4時間足以上、4時間足、日足、週足)のレジスタンスとサポートラインの反発を狙う FXは一方向には進まず90%以上で 必ず、必ずと言っていいほど、 どこかで反発します 。そこは大抵主要なレジスタンスとサポートラインまたは主要なフィボナッチラインなのです。
なのでそこに水平線を引いて ただ待つ のです。そこに到達したら、1分足や5分足に落として
長いヒゲ、ダブルボトム、ダブルヘッド、トリプルボトム、トリプルヘッド、三尊、逆三尊などの反転の形成を確認してエントリーする。 または、こちらを使用して
https://www.mql5.com/ja/market/product/53987
強弱が弱くなってきたのを確認してエントリーすればいいのです。
これだけです。シンプルです!!
うまく行くと、長期足レベルでレジスタンスとサポートライン間、つまり頭から尻尾まで取れる可能性もありますし、リスクリワードが異常にいいです。
そのためには、チャートに主要なレジスタンスと

This Indicator breaks down the movement into 3 waves: The primary wave suitable for long-term trading The intermediate wave suitable for intraday trading The minor wave for short-term trading
Supports and resistances:
Each wave is defined by major highs and minor lows. According to Dow's theory, an uptrend will be defined by minor lows higher and higher and a downtrend by major highs lower and lower.The indicator plots the next supports and resistances for each wave.
Trend channels (primary

Entry Pro Indicator is a powerful multi-functional trading tool designed to increase your market entry accuracy. It combines the power of several key market trend indicators, including ATR Trailing Stop and both fast and slow EMA, to provide comprehensive market insight. It offers easy-to-interpret market entry signals represented by colored arrows. Also, it's fully customizable, allowing you to adjust ATR and EMA periods to suit your trading strategy. Trend filters and alerts can be toggled on

Meet the Tweezer Hunter, an essential tool for every Forex trader looking to make accurate, trend-following trades. This powerful, intuitive indicator helps traders spot potential trend reversals before they happen, providing a significant advantage in the fast-paced world of Forex trading. The Tweezer Hunter is more than your average tweezer candle indicator; it's designed with a built-in trend identification feature that accurately detects whether the market is bearish or bullish. By integrat

Man Trend использует в своей основе процесс выявления скорости изменения роста цены и позволяет найти точки входа и выхода с рынка.
Индикатор был создан на основе оригинальных индикаторов поиска экстремумов, индикатор хорошо подходит для определения разворота или большого резкого рывка в одну из сторон благодаря ему вы будете знать когда такое произойдет он вас уведомит появлением точки синего цвета на покупку красного на продажу.
Это фундаментальный технический индикатор, который позволяе

О нас Представляем вам наш индикатор технического анализа нового поколения, который прогнозирует тренды с использованием множества источников с технических графиков, специально настроенных для валютных пар EURUSD, EURJPY и EURGBP на рынке Форекс. Это передовой инструмент разработан с целью предоставить трейдерам точные и надежные предсказания потенциальных трендов на рынке и движений цен, позволяя принимать обоснованные решения относительно своих сделок. Анализируя ряд ключевых показателей, вклю
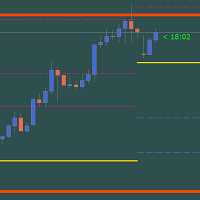
Gold PL MTF – это прекрасный биржевой технический индикатор. Алгоритм индикатора анализирует движение цены актива и автоматически отражает важные Pivot Levels заданного таймфрейма (ТФ) по методике Fibonacci (золотое сечение).
Индикатор прекрасно описывают траекторию цены выбранного таймфрейма (день, неделя, месяц, год), определяет начало тренда и начало коррекции, которая возможно перерастёт в противоположный тренд. Также индикатор показывает текущие неотработанные Pivot Levels разных таймфрей

Представляем Didi Index Volume - технический индикатор анализа, разработанный бразильским трейдером Одиром Агуиаром, который отличается передовым и мощным подходом к выявлению возможностей на финансовом рынке. Доступный на различных платформах, Didi Index Volume стал неотъемлемым инструментом для трейдеров, ищущих точные инсайты и ценную информацию для своих торговых стратегий.
Индикатор объединяет известный Didi Index, созданный Одиром Агуиаром, с интеллектуальным использованием объема торго
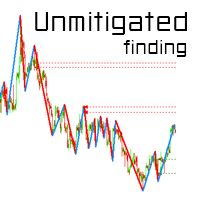
SMC Unmitigated Finding is a indicator for find unmitigated supply and demand in previous legs of price
Settings Zigzag Settings ZZDepth - by Default is 12.
ZZDeviation - by Default is 5.
ZZBackStep - by Default is 3. Horizontal Line Settings SupportColor- color for Support line.
ResistanceColor - color for Resistance line. Settings Num of Show - Number of Support & Resistance Show.

Индикатор DVV – многогранный информативный индикатор для рынка Форекс или Криптовалютного рынка . Индикатор дает четкие и надежные сигналы без перерисовки. Индикатор можно использовать в ботах, снимая показания с его нулевого буфера. Обратите внимание для разных валютных пар настройки необходимо подбирать по отдельности, это не сложно. Изменение входных параметров сильно влияет на отображение. Я покажу четыре варианта применения индикатора. Индикатор имеет только один выходной информативный буфе

Gioteen Volatility Index (GVI) - your ultimate solution to overcoming market unpredictability and maximizing trading opportunities. This revolutionary indicator helps you in lowering your losing trades due to choppy market movements. The GVI is designed to measure market volatility, providing you with valuable insights to identify the most favorable trading prospects. Its intuitive interface consists of a dynamic red line representing the volatility index, accompanied by blue line that indicate

3 candel indicator in 1 !!! The 3 most important candel indicator in 1 packadge. Help trader in chart visualisation, prevent reversal !!! Doji : Gravestone Doji, Long Legged Doji, Dragonfly Doji. Engulfing : Bullish, Bearish. Hammer : red hammer, green hammer. Fully parametrable indicator icon color config and alarm. Free life time update !!! Just try our demo for free.

Crash 500 indicator Update V2 No Repaint
This indicator works with a custom build in strategy The indicator will only give a sell sign when market conditions are in place. Only for sell. Apply own risk management target profit and stoploss. When market conditions are met the sell sign will indicate you to enter a sell position and you will have to apply your risk management system accordingly. This is only for Crash 500 market and only 1min chart
NB: Please note this indicator will be fr

Основная цель индикатора - определение моментов входов и выхода из сделок, поэтому ExactArrow не рисует ничего кроме стрелок, которые показывают места входа в рынок и выхода из него. Несмотря на всю видимую простоту индикатора, внутри у него сложные аналитические алгоритмы, при помощи которых система определяет моменты входов и выходов. Индикатор дает точные и своевременные сигналы на вход и на выход из сделки, которые появляются на текущей свече. Индикатор в среднем дает сигналы на 1-2 свечи ра

License required to run all EAs created by Forex Forensics 101 LLC.
How to use: - Download from marketplace - Move to 'Indicators' folder, can not be in folders within the 'Indicators' folder
Disclaimer: Forex Forensics 101 LLC is not affiliated with anyone selling an EA created through Forex Forensics 101 LLC. As such, the buyer is responsible for all wins and losses they may experience. Trading the forex market is high risk. You should always consult an expert before risking any capital.

Make Sure to Read the Description! UT Bot Plus contains free EA!
The EA can be downloaded from telegram channel: https://t.me/ +NSOJTvH39fNhZmU0
Unlock the Power of Automated Trading with UT BOT Indicator, Integrated with a FREE EA! ( Limited time offer ) This version has been expanded to include multiple additional filtering options. These options are fully configurable and can be switched on and off.
This versatile UT BOT indicator is crafted and optimized to work seamlessly with the

Индикатор Smart Binary Volume представляет собой универсальный инструмент, объединяющий анализ торгового объема с машинным обучением. Он может быть применен на различных рынках и стратегиях, включая скальпинг и другие виды краткосрочных сделок. С помощью передовых алгоритмов машинного обучения, данный индикатор выявляет сложные паттерны, обеспечивая более точные сигналы на покупку и продажу.
Buffer to Create EA. Buffer Line Gold = 0. Buffer Line Red = 2 Buffer AI = 3
AI Buffer >= 0 ("
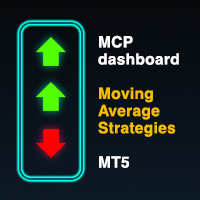
Мультивалютный индикатор в формате таблицы. Сигналы появляются с подтверждением, не перерисовывает. Работает на текущем (открытом) таймфрейме. Уведомления приходят по открытому инструменту. В настройках индикатора можно выбрать 1 из 4 стратегий Moving Average . Стратегии (представлены в скриншотах): Классическое пересечение быстрой и медленной скользящих средних Реверс сигнала классического пересечения (используется для флэтового/бокового движения) Классическое пересечение относительно более
ボリンジャーバンドは、価格変動を分析するためのテクニカル分析の1つのツールになります。
ボリンジャーバンドには、中心線と2つのバンドがあります。
中心線は、一般的には移動平均線(通常は20日間の単純移動平均)として計算されます。この中心線は、一定期間の価格の平均値を表しています。 ボリンジャーバンドのバンドは、中心線の上と下に等間隔で配置されます。通常は中心線から2つの標準偏差分だけ離れた位置に設定されます。 拡大(Expansion)とは、ボリンジャーバンドが広がる状態を指します。
つまり、上下のバンドが中心線から離れ、価格の変動範囲が広がっていることを示します。拡大は、相場が活発になり、価格の大幅な変動が起こりやすいことを示すことがあります。 収縮(Contraction)とは、ボリンジャーバンドが狭くなる状態を指します。
つまり、上下のバンドが中心線に近づき、価格の変動範囲が狭まっていることを示し、相場が方向感を失い、一時的に価格変動が鈍化していることを示すことがあります。 ボリンジャーバンドの収縮と拡大は、価格変動のパターンや相場の特徴を捉えるために重要な指

MT4 Version Understanding market sentiment is a critical aspect of successful trading. Market sentiment refers to the overall feeling or attitude of traders and investors towards a particular financial instrument, such as a stock, currency pair, or cryptocurrency. It is a collective perception of market participants' emotions and beliefs about the asset's future price direction. Market sentiment can be bullish (positive), bearish (negative), or neutral (sideways). Knowing the market sentiment ca
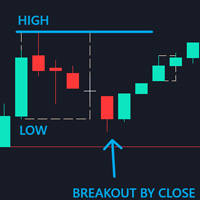
Control Candle is the candlestick which holds multiple inside bars and are in control until its high low range is broken by close of any candlestick. When control candle is broken, price may act on these control candle as support and resistance.
This indicator create rectangles on chart which will help you find control candles fast.
Control candle indicator box is customizable by color, style, width and other options in indicator settings.
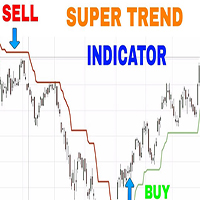
Как следует из названия, он указывает направление движения цены на рынке, который находится в тренде, то есть следует какой-то определенной траектории. Он отображается на графиках цен на акции, чтобы инвесторы могли видеть отмеченную текущую тенденцию, которая отображается красным цветом, когда цены падают, и зеленым, когда цены растут.
Входные параметры:
Период индикатора CCI Период индикатора ATR Уровень активации ТПП Горизонтальное смещение баров индикатора В противном случае ; Вы може

KT Triple Top-Bottom identifies the triple top/bottom pattern with a breakout signal in the opposite direction. It is used to identify potential trend reversals.
A Triple Top pattern is formed when the price reaches a high point three times, while a Triple Bottom pattern occurs when the price comes to a low point three times.
Features The indicator detects the triple top/bottom pattern with high precision and accuracy. The indicator suggests a shift in momentum, with sellers or buyers takin

Introducing the Aroon Indicator - Your Ultimate Trend Analysis Tool!
Are you looking to take your trading game to the next level? Want to identify lucrative entry and exit points in the financial markets with ease? Look no further! The Aroon Indicator is here to revolutionize your trading strategy and help you make informed decisions like never before.
Developed by the brilliant mind of Tushar Chande, the Aroon Indicator is a powerful technical analysis tool designed to measure the strength

KT DMA is a modified and advanced version of the classic Displaced Moving Averages with buy/sell crossover alerts and a Multi-Timeframe scanner that shows DMA's direction across each real-time time frame. A Displaced Moving Average is a simple moving average that moves ahead or backward in a time frame (either short-term or long-term). It also allows you to predict price movement more accurately.
Features Depicts the trend direction using the alignment of three moving averages. Buy/Sell signa
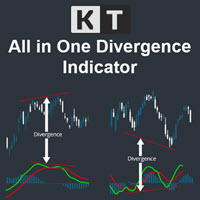
The KT All-In-One Divergence is designed to identify regular and hidden divergences between the price and 11 widely recognized oscillators. This powerful tool is indispensable for swiftly and accurately spotting market reversals. Its a must-have tool in any trader's arsenal, providing clear and accurate divergence patterns. Its accuracy and speed in identifying market reversals are remarkable, allowing traders to seize profitable opportunities confidently.
Features No Interference: You can a
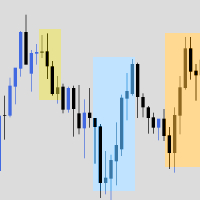
The indicator is a bundle of EIGHT different fundamental functions required for a trader: 1] Forex Session where you can determine your own timings/highlights. 2] High low marking from 1H to 1M 3] Sweetspot 4] Spread and Candle Stick Timer 5] Background logo for branding- You can place the images at any zone of the chart you want 6] Profit and Loss 7] Days names (SUN MON TUE…) on the chart 8] High/low break notification
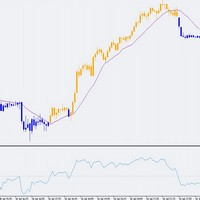
This indicator can be very important in any trading system. The Indicator colors candles above or below the 50 level of the RSI, which is a widely used indicator in technical analysis. With this indicator it is much easier to identify trends, helping with the entry and exit points of negotiations. It is a fact that in the financial market, simple things work. Este indicador pode ser muito importante em qualquer sistema de negociação. O Indicador colore as velas acima ou abaixo do nível 50 do

Hello There,
Today I want to show you my new researchable fore BUY SELL indicator,
it work all asset,
and also work Derive Volatility asset!
it work all time frame, but i recommend start 5 minute to H1
when you receive a signal just take trade and stay wait for your take profit
asset
All Major Pair And minor
IT WORK ALSO XAUUSD
Fantastic results,
for more info,,, message us
thank you
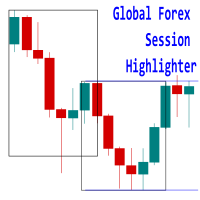
Introducing the 'Global Forex Session Highlighter' , a powerful tool designed to enhance your trading strategy by providing a visual representation of the Three major Forex trading sessions: Tokyo, London, and New York. This indicator is designed to help traders understand the dynamics of the global Forex market by highlighting the trading sessions directly on your MT5 chart. It provides a clear view of when each session starts and ends, allowing you to strategize your trades around the most act
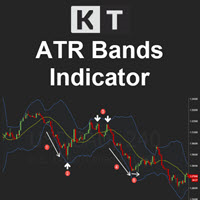
KT ATR Bands draws the volatility envelops and bands using a combination of Average True Range and Moving average. They are typically used to identify the potential reversal points and the periods of high and low volatility.
Features
Multi-Timeframe Ability: For example, you can have the atr bands from the daily timeframe on the H1 timeframe. Smart Alerts: You can turn on/off alerts for each band separately. Also, you can choose a minimum time interval between each alert to stop unnecessary,
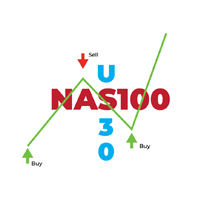
Индикатор NAS30 Scalper - передовой инструмент, разработанный для предоставления точных сигналов на покупку и продажу для торговых стратегий скальпинга на NAS100 и US30. Этот индикатор использует передовые алгоритмы для выявления краткосрочных рыночных тенденций и получения прибыли из быстрых ценовых движений, что делает его идеальным для трейдеров, стремящихся использовать быстрые возможности для получения прибыли.
Основные характеристики:
Сигналы в реальном времени: Получайте мгновенные о

Индикатор создан по уникальному алгоритму не имеющему аналогов. В основание расчётов рассчитывается сама цена контракта и проявляемый к ней интерес, что отображается в индикаторе в виде гистограмм в двух вариантах обрисовке а также в шести вариантах отображения на графике цены в различных комбинациях что позволяет точно увидеть интерес всех участников торгов в виде обрисовки уровней поддержки и сопротивления. Принятия торговых решений можно принимать как по тренду так и коррекционные движения ц
Alright. This indicator works on MT5 and is very easy to use. When you receive a signal from it, you wait for that candle with the signal to close and you enter your trade at the beginning of the next new candle. A red arrow means sell and a green arrow means buy. for easy identification of trade signal. Are you okay with that?
The indicator cost $500. We release new updates of the indicator every month and the updates are for free once you bought the indicator first time. This indicator was
Candle Scanner Dashboard is an incredibly powerful tool in the financial markets. It excels at detecting market reversals, trend changes, and retracements. The dashboard displays patterns as they are identified, and with a simple click on each pattern, you can view them on their dedicated charts to precisely locate their occurrences. With its capability to detect 11 popular bullish and 11 bearish patterns, you can trust the dashboard to handle pattern identification effortlessly. It provides an

1. GENERAL DESCRIPTION OF THE TREND RENEWAL INDICATOR The Trend Renewal Indicator (TRI) is a simple yet very powerful trend-following indicator that works on the MT5 trading platform of MetaQoutes (MLQ5). The TRI indicator suits small and large accounts, and is ideal for very large accounts. It has been used for decades by fund managers and institutional traders, but never offered to retail traders. The TRI works with any instrument, including currencies, crypto currencies, metals, hard and soft

MT4 Version GaussChannelPro is a powerful and innovative trading indicator designed to enhance your trading strategy with the precision of Gaussian-based channels. Leveraging the principles of Gaussian (normal) distribution, this indicator creates a unique channel on your price chart, offering valuable insights into market trends and potential turning points. Utilizing advanced statistical analysis, GaussChannelPro calculates the optimal channel boundaries based on historical price data, present
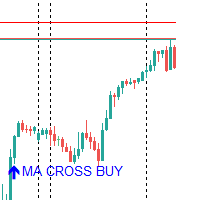
This indicator does not repaint, it is a trend indicator created to trade all financial instruments; go watch the video of the presentation on youtube https://youtu.be/OyhGcmgpzdQ you can do swin, day trading and scalping depending on the settings you will receive after your purchase, join my telegram channel @ASTBOSSA MY USERNAME FOR TELEGRAM GOOD LUCK TIMEFRAME: H1,H4,D1 (98% WIN RATE FOR ALL MARKET)
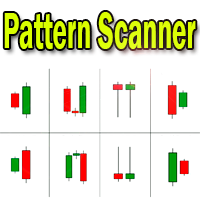
Индикатор свечных паттернов - отображение на графике найденных свечных паттернов. MT4-version: https://www.mql5.com/en/market/product/103345
Медвежьи паттерны:
Обозначения медвежьих паттернов Название паттерна SS
Падающая звезда ( Shooting Star) STR(E) Вечерняя звезда ( Evening Star) DJ(E) Звезда доджи вечерняя ( Evening Doji Star) DC Завеса из темных облаков (Dark Cloud) BEP Медвежье поглощение (Bearish Engulfing) Бычьи паттерны: Обозначение бычьих паттернов Название паттерна HMR
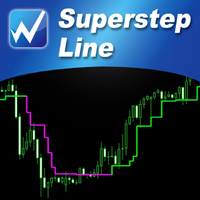
【SuperStep Line】Indicator Introduction : The color of the SuperStep line which is green and climbing up means that the price trend is going up.The color of the SuperStep line is purple and going down means that the price trend is going down.
It is very simple to use it to judge the market trend! What's even better is that the open parameters of the indicators allow investors to adjust. You can adjust 【SuperStep Line】 according to your needs. Adjust it faster to be closer to short-term market

【Super Scanner】Indicator Introduction : The color of the Super Scanner which is green and climbing up means that the price trend is going up.The color of the Super Scanner is red and going down means that the price trend is going down.
It is very simple to use it to judge the market trend! What's even better is that the open parameters of the indicators allow investors to adjust. You can adjust【Super Scanner】according to your needs. Adjust it faster to be closer to short-term market fluctuati

Currently 50% off!
The best solution for any Novice or Expert Trader!
This indicator is a unique, high quality and affordable trading tool because we have incorporated a number of proprietary features and a new formula. You will not only be able to show a higher TF, but also show both the chart's TF PLUS the highest TF: SHOWING ALIGNED ZONES AND MARKET AGGRESSION. All Supply and Demand traders will love it. :)
Important Information Revealed See our LivWell Indicators results, visit ht

This indicator uses a mathematical calculation algorithm . This algorithm calculates the remainder between the updated model and the actual values and produces the possible progress of the graph on the graph. It is not a super prophet in trading, but it is very good for the trader when entering the market and to analyze it before entering. Applicable for all currencies. Данный индикатор использует алгоритм математических вычислений . Данный алгоритм вычисляет остаток между обновленной моделью и

Описание индикатора: Зоны дисбаланса FVG Индикатор Зоны дисбаланса FVG - это мощный инструмент, предназначенный для выявления потенциальных дисбалансов цен на финансовых графиках. Разработанный Пьером-Алексисом Блондом, этот инновационный индикатор помечает области, где могут происходить значительные изменения цен, предоставляя трейдерам ценные сведения о возможных точках разворота рынка. Основные особенности: Обнаружение дисбалансов: Зоны дисбаланса FVG выявляют потенциальные дисбалансы цен на

Indicator Type Strategy (Pullback) for all Symbols and Periodicity, Preferably from 30M periodicity. Can be used for manual trading. Its workspace corresponds to channel of 3 bars of Bill Willians. Also relies on the indicator Rsi and Atr. BUY when: There is a Green Arrow STOPLOSS to buy, below the bottom line of the channel (red line)" SELL when: There is a Red Arrow. STOPLOSS to sell, above the upper line of the channel (blue line)
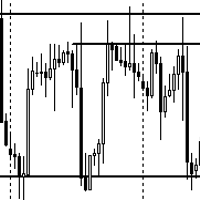
The Vice Supply and Demand Zones MT5 Indicator is a powerful tool designed to identify potential supply and demand zones on price charts. These zones represent areas where market forces of supply and demand are likely to cause significant price movements. The indicator helps traders to spot key support and resistance levels, aiding in making informed trading decisions. Indicator Features: Supply Zones: The indicator plots blue rectangles on the chart to identify potential supply zones. Supply z
MetaTrader Маркет - лучшее место для продажи торговых роботов и технических индикаторов.
Вам необходимо только написать востребованную программу для платформы MetaTrader, красиво оформить и добавить хорошее описание. Мы поможем вам опубликовать продукт в сервисе Маркет, где его могут купить миллионы пользователей MetaTrader. Так что занимайтесь только непосредственно своим делом - пишите программы для автотрейдинга.
Вы упускаете торговые возможности:
- Бесплатные приложения для трейдинга
- 8 000+ сигналов для копирования
- Экономические новости для анализа финансовых рынков
Регистрация
Вход
Если у вас нет учетной записи, зарегистрируйтесь
Для авторизации и пользования сайтом MQL5.com необходимо разрешить использование файлов Сookie.
Пожалуйста, включите в вашем браузере данную настройку, иначе вы не сможете авторизоваться.