Смотри обучающее видео по маркету на YouTube
Как купить торгового робота или индикатор
Запусти робота на
виртуальном хостинге
виртуальном хостинге
Протестируй индикатор/робота перед покупкой
Хочешь зарабатывать в Маркете?
Как подать продукт, чтобы его покупали
Технические индикаторы для MetaTrader 5 - 70

On this occasion I am pleased to present the (Boom 300 Professional Pack) where it consists of 4 indicators for the Boom 300 index of synthetic indices (Deriv Broker) Acquiring this indicator enables you the pack of the 4 boom 300 indicators where the rest of the indicators will be sent, This indicator is 1 of the 4 that includes the Buy/Sell strategy, sending you clear alerts where there buy or sell the pair It is recommended to use in a period of 15 minutes, to have a greater profit since the

Professional Pack Crash 300 Indicators, On this occasion I present the trend indicator that is for the crash index 300 (Deriv Broker) The indicator consists of a strategy where trends are caught in periods of 15 minutes, very clearly the indicator shows the purchase marking the tip of red until the trend develops, and then mark the green point of purchase, it is very simple to use, It is recommended to use in that temporality since it serves to catch longer trends and increase profit, the indica

Channel Stochastic Boom 1000 I am pleased to present the pack (Tendence Boom 1000) where on this occasion I present the Channel Stochastic Boom 1000 indicator for (Deriv Broker) where is 1 of the 4 indicators that the pack brings! The indicator consists of the sthochastic strategy, where it reaches the point of (0 Level) the purchase is made, taking advantage of hunting spike, where it reaches the point of (90 Level) the sale is made taking advantage of the trend candles! It is used in 1 minute

The Fisher Transform is a technical indicator created by John F. Ehlers that converts prices into a Gaussian normal distribution. The indicator highlights when prices have moved to an extreme, based on recent prices. This may help in spotting turning points in the price of an asset. It also helps show the trend and isolate the price waves within a trend. The Fisher Transform is a technical indicator that normalizes asset prices, thus making turning points in price clearer. Takeaways Turning poi

"Advanced Daily VWAP with Standard Deviation and Trading Bands" Description: "The 'Advanced Daily VWAP with Standard Deviation and Trading Bands' indicator offers a comprehensive view for traders who wish to make the Volume Weighted Average Price (VWAP) the crux of their trading strategy. It not only calculates the VWAP on a daily basis but also incorporates standard deviation to give an accurate representation of market volatility. The trading bands are calculated using a 1.5% multiplier for th

Вероятностный индикатор Этот индикатор анализирует движение цен за определенный период, чтобы получить важную информацию для анализа распределения вероятностей, такую как их среднее значение и стандартное отклонение. Получив такую информацию, он выполняет все необходимые расчеты и, наконец, вычисляет вероятность того, что текущая рыночная стоимость упадет. выше или ниже баров заданного периода.
Поскольку этот индикатор эффективно использует силу вероятности, которая не лжет, это мощный индика
Palantir
Индикатор Palantir предсказывает разворот цены на заданное пользователем в настройках число пунктов. Вы выбираете размер интересующего вас тренда и индикатор предскажет с какой вероятностью цена пройдёт в обратную сторону указанное количество пунктов от ближайшего экстремума. В основе работы индикатора лежит статистический подсчет исторических трендов. Палантир анализирует на истории тренды с заданным в настройках размером, собирает статистику и выдаëт на её основе результат. Наприм

This MT5 indicator is my newest trading indicator which gives traders an accurate entry to buy or to sell. This can be used to scalp or swing-trade on longer time-frames but you will need to set your own stop loss and profit targets as the markets are unpredictable. This indicator can always provide the trader with at least a few pips of profit from scalping. Buy when you see a green arrow and sell when you see a red arrow. It's as easy as that.

The ChanLun or Chan theory is one of the most popular trading theories in China. But it seems like that it has little influence in western countries. Actually, the Chan Theory is based on a sophisticated mathematical model. The basic idea ChanLun is to simplify the bar chart by its model. With the help of ChanLun, a trader can analyze and predict the trend of future goods, stocks.
In ChanLun, there are several basic elements called fractals, strokes, line segments and pivots . A trader should p
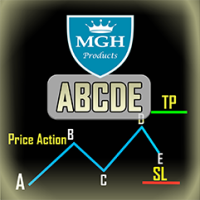
Индикатор ABCDE
Этот индикатор основан на первичных abc-шаблонах ценового движения (то есть прорыв, откат, движение). Эти шаблоны напоминают шаблон ралли-основание-ралли, и для выдачи точного сигнала проверяются такие анализы, как анализ тренда и анализ расхождения. Он обеспечивает достаточно точные торговые сигналы и сообщает вам, когда лучше открывать и закрывать сделки. Он может быть применен к любому финансовому активу: форекс, криптовалюты, металлы, акции, индексы.
Основные возможности
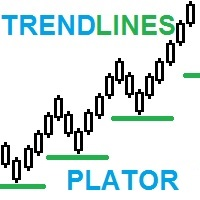
TrendPlator: Мощный индикатор прогнозирования тренда для оптимизированных торговых стратегий Откройте для себя мощь нашего нового индикатора! Способность вычислять трендовые линии более крупных таймфреймов и проецировать их прямо на ваш текущий таймфрейм обеспечивает стратегическую поддержку, привлекающую внимание всех трейдеров. Эти точки становятся мощными уровнями поддержки или сопротивления для ваших сделок, способствуя улучшению вашей торговой стратегии. Представьте себе индикатор, который

This is a multi-timeframe indicator that detects and displays support and resistance (S&R) lines using the ZigZag indicator.
Features
The support and resistance lines are not redrawing. The indicator is capable of adding new support and resistance levels as they appear. Each S&R line has a tooltip that displays the price level and start time. Save time for multi-timeframe analysis on trades. All types of alerts (sound, pop-up, email, mobile push notification) are available. Working with al
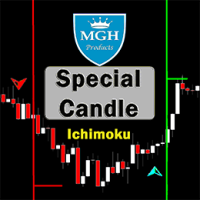
Вела Эспециал
Вы бы хотели использовать один из лучших индикаторов валютного обмена, основанный на стратегии Ишимоку, которая является очень успешной? Вы можете использовать отличный индикатор, основанный на стратегии Ишимоку.
Версия MT4 доступна здесь.
Первая стратегия:
Эта стратегия включает в себя выявление похожих и редких, но мощных пересечений.
Самые подходящие временные интервалы для этой стратегии - 30 минут (30M) и 1 час (H1).
Подходящие символы для графика 30 минут:
• CAD/JPY

-- BEST SWING --
L'indicateur BEST SWING est un indicateur technique personnalisé, un excellent outil pour négocier les cassures en fonction des niveaux de support et de résistance horizontaux. L'indicateur BEST SWING utilise une formule complexe en analysant des données de prix autrement incongrues sur les cours de clôture de chaque période, ainsi que les hauts et les bas du prix, afin de donner un aperçu de la force ou de la faiblesse de la tendance du marché et de sa probabilité

Индикатор Trading Hours рисует на графике рамки, представляющие часы открытия и закрытия конкретной биржи. Входы: Входной параметр `сдвиг часового пояса UTC` устанавливает сдвиг часового пояса пользователя относительно UTC, Другие параметры используются для отображения или скрытия рамок или установки цвета. Функции: Рисует рамки, которые представляют часы открытия и закрытия конкретной биржи на диаграмме, Показать/скрыть кадры для выбранного обмена, Устанавливает цвет для выбранного обмена, Под
A visual Order Book is a powerful tool used in the financial market to provide a detailed view of buy and sell orders in a given financial instrument in real time.
This visual representation allows traders to observe the liquidity available in the market, identify the supply and demand levels at different prices and follow the evolution of orders as they are placed, modified or withdrawn.
By analyzing the visual Order Book, traders can identify trading patterns, detect possible reversal poi
Boom Scalper Gold It is an indicator, programmed to scalp in a timeframe of 1/5 and 15 Minutes, perfect for hunting spikes and trend sails, where in the parameters of (70) it sends you a sale/sell alert and in the level parameter (8) it sends you a buy signal It is used for indices (BOOM) of synthetic indices (Deriv) It's easy and simple to use, it does all the work by sending you the alerts! the indicator during this period will remain on SALE! Without further ado, enjoy! Good profit. World Inv

Crash Scalper Gold It is an indicator, where it marks points of purchase and points of sale As the name says, it is used to scalp in the pairs of (Crash) 1000/500/300 where it sends you signals of sale/Sell and purchase/Buy at level points (90) he sends you the sell signal, (Spike) at the level point (27) it sends you the buy signal, (Trend Candles) It is very simple and easy to use. to make the best tickets possible! For this period it will remain on sale! Without further ado, enjoy! Good profi

Introducing the Power Trade Plus indicator designed by a small group of traders with a few years of experience trading the market profitably. The Power Trade Plus is derived from the Power Trade indicator, the indicator strive in powerful sniper entries and take profit levels, with an algorithm that's can determine the markets volatility and Provides entries based on the current market volatility. This indicator is much more effective in stock ,currencies and indices.

The "AI Forecast" indicator is the result of a unique experiment in which I asked an AI how to create the best indicator to anticipate the market. The AI suggested measuring the past history of the price and its reactions to different levels, and then calculating the probabilities of the price reaction in the future.
With this idea, I designed with the help of another AI the "AI Forecast" indicator, which adapts to any MetaTrader chart and shows you three lines: one for entry and two for poss
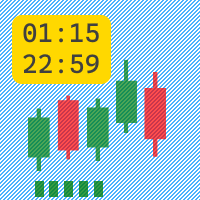
Индикатор Active Session отображает в отдельном окне активную торговую сессию в виде зеленых свечей.
Параметры индикатора: Monday = true/false - торговать в понедельник, если параметр равен true. Tuesday = true/false - торговать во вторник, если параметр равен true. Wednesday = true/false - торговать в среду, если параметр равен true. Thursday = true/false - торговать в четверг, если параметр равен true. Friday = true/false - торговать в пятницу, если параметр равен true.
StartHour -
Xau/Usd Scalper It is a unique indicator where it counts the low/high to make buy and sell entries! where you mark the entries with arrows next to the lows and highs used in m15/H1 to make longer and more valuable entries It is very simple and easy to use It also works for forex pairs and synthetic indices! Without further ado, enjoy! good profit World Investor!!

Step Scalper , It is an indicator with alerts, where it sends you buy and sell alerts accompanied by a moving average of 21 periods It is very easy and simple to use. where on the path of the green period marks the purchase of the asset , and the path of the red period marks the sale of the asset, It is used for scalping on M5/M15 but it is also recommended use it in periods of 1 hour since it captures the buying or selling trend, to get more profit! no more to enjoy good profit World Investor!
Индикатор Logarithmic Moving Average представляет собой скользящее среднее, которое инвертирует формулу экспоненциального скользящего среднего.
Известно, что многие трейдеры используют логарифмические графики для анализа продолжительности ценовых колебаний. Индикатор в этом посте можно использовать для анализа логарифмического значения цены на стандартном графике с временной шкалой.
Трейдер может задать следующие входные параметры:
MAPeriod [по умолчанию: 9] — установите большее чи

If you have been anywhere near Forex forums or social media lately, you have no doubt been hearing people talk about Smart Money Concepts (SMC) trading. You may be wondering what SMC is, and whether it deserves all the hype. In this post, we will introduce Smart Money Concepts trading to you so you can make an informed decision about whether or not to give this strategy a try in your own trading. What is SMC Forex trading? Smart Money Concepts (SMC) is one of many forex trading methods. SMC

What is this indicator? This indicator is for comparing multiple charts and verifying the chart pattern. Synchronize each chart position with the common vertical line. By changing the chart mode, you can also display the chart like a real trade.
How to set up
1. Scroll the chart of the target currency pair to the end in the past direction and download all the historical data of that currency pair. 2. Install this indicator in the main window of each chart. 3. Customize each parameter on th

Indicator show best signals for buy and sell orders. Indicator uses only 2 inputs: DEMA Fast Period - fast double exponential moving average period DEMA Slow Period - slow double exponential moving average period Crossings of fast and slow double double exponential moving averages shows buy and sell signals, which are drawn as green and magenta arrows respectively.

https://youtu.be/JJanqcNzLGM , https://youtu.be/l70MIHaQQa4 , https://youtu.be/pg0oiT5_8y0 Automated Supply and Demand Trading Edge MT5. These videos demonstrate how we apply the supply and demand system to our latest trading review and market analysis
Enhance your Trading Strategy with the Supply and Demand Trading Edge MT5. Gain a competitive market advantage with the Supply and Demand Trading Edge MT5 indicator, a powerful tool that combines MACD signals with supply and demand zones. B
Indicator show best signals for buy and sell orders. Indicator uses only 3 inputs: DEMA Fast Period - fast double exponential moving average period DEMA Slow Period - slow double exponential moving average period DEMA Trend Period - trend double exponential moving average period
Position of price according to trend double double exponential moving average and crossings of fast and slow double double exponential moving averages shows buy and sell signals, which are drawn as gr

Indicator show best signals for buy and sell orders. Indicator uses only 2 inputs: PEMA Bounce Period - bounce percentage exponential moving average period PEMA Confirm Period - confirm percentage exponential moving average period Positions of price according to bounce and confirm percentage exponential moving averages and directions of bounce and confirm percentage exponential moving average shows buy and sell signals, which are drawn as green and magenta arrows respecti
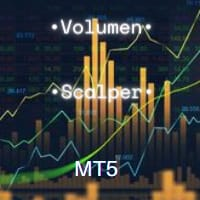
Volumen del especulador Es un indicador que captura la fuerza del volumen de compra y venta. donde es muy fácil de usar, mostrándote la fuerza alcista y la fuerza bajista. En este gráfico está el claro ejemplo de cómo se utiliza, en el par VOLATILITY 75 donde esta la tea verde junto con la flecha que indica la compra, y ahí está la vela roja con la flecha marcando la venta del par, los parámetros a utilizar son Volumen : 5 Tiempo : 1000 para que capte toda la tendencia y se note mejor cuando co
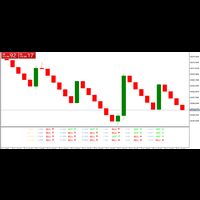
ZZA TRADE ASSISTANT This ZAA trade assistant indicator is very powerful. Here you can use this as your trading assistant . So while applying this use money management . This indicator can be use on 5 minutes timeframe, 15 minutes timeframe, 1 hour minutes timeframe and above . Try practice this on your demo account before using on real account . This indicator should apply on meta trader 5 .

The "RMA Signal Indicator MT5" refers to an indicator called "RMA" (Running Moving Average) Signal Indicator designed specifically for the MetaTrader 5 (MT5) trading platform. The RMA is a variation of the Moving Average indicator that emphasizes recent price data. The specific details and functionality of the "RMA Signal Indicator MT5" may depend on the developer or the version you are using. However, in general, here is a general approach to using a signal indicator like RMA on the MT5 platfor
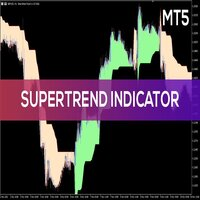
The "Super Trend Alert MT5" is an indicator designed for the MetaTrader 5 (MT5) trading platform. The specific details and functionality of this indicator may depend on the version or settings you are using. The Super Trend indicator is a popular technical analysis tool that helps identify the direction of the current market trend. It is displayed as a line on the price chart and is accompanied by alerts to notify traders of potential trend changes. To use the "Super Trend Alert MT5" indicator i
Automated Supply and Demand Tracker MT5. The following videos demonstrate how we use the system for trade setups and analysis.US PPI, Fed Interest Rates, and FOMC Trade Setup Time Lapse: U.S. dollar(DXY) and Australian dollar vs U.S. dollar(AUD/USD) https://youtu.be/XVJqdEWfv6s The EUR/USD Trade Setup time lapse 8/6/23. https://youtu.be/UDrBAbOqkMY . US 500 Cash Trade Setup time lapse 8/6/23 https://youtu.be/jpQ6h9qjVcU . https://youtu.be/JJanqcNzLGM , https://youtu.be/MnuStQGjMyg, ;
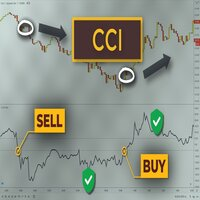
CCI Indicator Super is based on Pending Position strategy ( PPS ) and a very advanced secretive trading algorithm. The strategy of CCI Indicator Super is a combination of a secretive custom indicator, Trendlines, Support & Resistance levels ( Price Action ) and most important secretive trading algorithm mentioned above. DON'T BUY AN EA WITHOUT ANY REAL MONEY TEST OF MORE THAN 3 MONTHS, IT TOOK ME MORE THAN 100 WEEKS(MORE THAN 2 YEARS) TO TEST BONNITTA EA ON REAL MONEY AND SEE THE RESULT
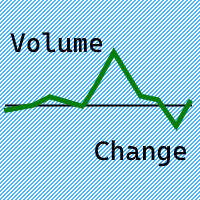
Индикатор Volume Change отображает в отдельном окне изменение объема и направление движения цены в виде линии.
Параметры индикатора: VolumeTimeframe - таймфрейм на котором индикатор берет данные . VolumeApplied - тип объема: Tick volume/Real volume. VolumePeriod - период скользящей средней на таймфрейме VolumeTimeframe, относительно которой рассчитывается изменение объема.
Данный индикатор может использоваться для построения торговой системы, основанной на отслеживании движени
Представляем индикатор Draw On Chart: раскройте свою креативность на графиках!
Устали бороться с проблемами аннотирования ваших торговых графиков, пытаясь понять свои анализы или эффективно передать свои идеи? Вам больше не придется искать решение! Мы рады представить индикатор Draw On Chart - революционное средство, позволяющее легко рисовать и аннотировать непосредственно на графиках всего лишь несколькими щелчками или движениями вашего пера.
Наш инновационный индикатор Draw On Chart разр
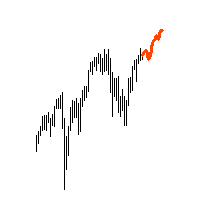
"AV Forecast MT5" is a preview or forecast indicator for MetaTrader 5, which draws forecast future price changes on the chart based on historical data. To do this, it primarily uses the everyday rhythm and the seasonality of the year. For timeframes below H1 closer dates can be selected. The lines for calculation can be made visible.
Settings:
- Draw line for x candles: draw x candles in the future
- Show all lines: yes/no
- Look back years or mixed (> H1 same): one year back or less b

Индикатор Point Trend Point был создан на основе оригинальных индикаторов поиска экстремумов, индикатор хорошо подходит для определения разворота или большого резкого рывка в одну из сторон благодаря ему вы будете знать когда такое произойдет он вас уведомит появлением точки синего цвета на покупку красного на продажу. Это фундаментальный технический индикатор, который позволяет дать оценку текущей рыночной ситуации, чтобы в войти в рынок выбранной валютной пары в тренд и с минимальным риском.

Moving Average Band is a tool designed to provide traders with a more comprehensive and realistic perspective when using moving averages in their technical analysis. Unlike conventional moving averages plotted as lines, Moving Average Band introduces a unique approach by representing the moving average as a dynamically adjusting band based on market volatility.
Volatility is an intrinsic characteristic of financial markets, and understanding how it impacts trends and price movements is essent

Victory Channel это трендовый стрелочный индикатор форекс для определения потенциальный точек входа. Нравится он, прежде всего, тем, что в нём заложен простой механизм работы, адаптация ко всем временным периодам и торговым тактикам. Создан на основе канала регрессии с фильрами. Отображаем сигналы индикатора Victory Channel на графике функции цены используя математический подход.
Принцип работы - при пробитии цены в зоне перекупленности/перепроданности (уровней канала) генерируется сигнал на
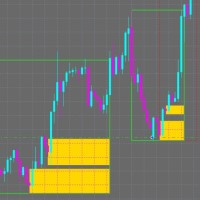
When it comes to trading in the financial markets, there's no question that the banks have a major advantage. They have access to vast amounts of resources, including high-powered trading algorithms, in-depth market research, and teams of experienced traders. But what if you could level the playing field and trade like the banks do? That's exactly what our Smart Money Indicator allows you to do. By providing you with critical insights into market structure and supply and demand zones, you can ma

The MultiTimeframe Volume Zones Indicator is a powerful tool designed to provide traders with comprehensive insights into market dynamics. It combines several essential features, including volume analysis, Dow Zones, buy and sell arrows, candle timer, and market movement across different time frames. This all-in-one indicator equips traders with valuable information to make informed trading decisions. Key Features: Volume Analysis: Gain a deep understanding of market sentiment and strength by an

Вы устали упускать выгодные рыночные тренды? Вы хотели бы иметь надежный инструмент, который мог бы точно и точно определять продолжение тренда?
Не смотрите дальше! Наш индикатор продолжения тренда призван усилить вашу торговую стратегию и помочь вам опережать конкурентов.
Индикатор продолжения тренда — это мощный инструмент, специально созданный для помощи трейдерам в выявлении и подтверждении паттернов продолжения тренда на различных финансовых рынках.
Независимо от того, торгуете ли в
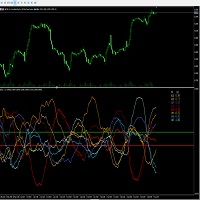
Качественный индикатор рассчитывает разницу между валютными парами USD, EUR, GBP, AUD, JPY, CHF, NZD, CAD. Расчёт ведётся в онлайн режиме вычисляет спрос и предложение между собой в различных связках. Отображение можно наблюдать в двух режимах общий всех восьми пар а также конкретно по выбранной паре. Важным показателем индикатора является нулевая ость что указывает общий тренд валют и их преимущество по отношению друг к другу. Индикатор работаем во всех режимах времени.
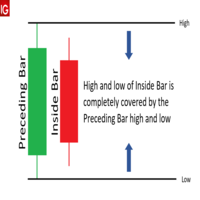
The Inside bar indicator can detect where inside bars occur in the charts and will change the color of the candle based on user inputs. Please note that the color can differ based on the current color of the candle due to supposition of the colors. Here are the characteristics of an inside bar pattern: High: The high of the bearish candle is lower than the high of the previous bullish candle. Low: The low of the bearish candle is higher than the low of the previous bullish candle. Body: The bo
Market screener: Spread and Swap, for selected Symbols. You can customize the list: set only the Symbols (currency pairs) that are needed. The number of Symbols is unlimited. The list can be sorted in ascending or descending order (Symbol name). The panel can be moved to any place on the chart. You can also minimize the panel. Displayed values: Current market price (BID); Spread size; Swap, for Long positions; Swap, for Short positions; Overall P/L of the entire account; My #1 Utility : includ

"Dragon's Tail" представляет собой интегрированную торговую систему, а не просто индикатор. Эта система анализирует каждую свечу по минутам, что особенно эффективно в условиях высокой волатильности рынка. Система "Dragon's Tail" определяет ключевые моменты на рынке, обозначенные как "сражения быков и медведей". Основываясь на этих "сражениях", система дает рекомендации по направлению сделки. В случае появления стрелки на графике, это сигнализирует о возможности открытия двух сделок в указанном н

To get access to MT4 version please click here . This is the exact conversion from TradingView: "[SHK] Schaff Trend Cycle (STC)" by "shayankm". This is a light-load processing indicator. This is a non-repaint indicator. Buffers are available for processing in EAs. All input fields are available. You can message in private chat for further changes you need. Thanks for downloading
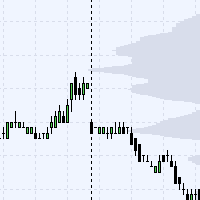
This indicator is showing level's density prices on background's graph.
Theses levels are showing the prices that are the most traded by the market. This means that these levels can be used in order to place stoploss or takeprofit for swing orders, or for scalping manually in short time periods. This gives a statistical advantage as these levels are more likelely to be reached or pullbacked by the market. It is also usefull on VIX for example to determine when to enter local low volatility.

Индикатор обнаруживает начало нового тренда не прямым способом, а сравнением двух прогнозных значений, построенных с учетом доступной истории. Его действие основано на предположении о том, что прогнозируемая (исторически нормальная) цена и реальная цена отличаются вследствие появления “новой” силы (несбалансированного воздействия на рынок), как правило такое воздействие при неустойчивом рынке приводит к существенной коррекции рынка. Устойчивость рынка индикатор не отслеживает, поэтому рекоме
The indicator is a gold mine that works with the MACDI strategy with alert supported by AI
it working on gold 5m time frame with 92% win
the stratige take 15 pip tp and 15 stop 1:1
follow us on telegram :
t.me/tuq98
youtube :
youtube.com/ssfx1
green color its buy with alert
red color its sell with alert
this indicator is one from top 10 in greece
and one from top 5 in iraq

Trend in Channel - это не обычный форекс канал. Этот коридор выстраивается на основании анализа нескольких свечей, начиная от последней, в результате чего определяются экстремумы исследуемого промежутка. Именно они и создают линии канала. Он как и все каналы имеет среднюю линию а также линию максимума и минимума. Этот канал стоит внимания из-за своего необычного поведения. Применение индикатора Trend in Channel позволяет трейдеру вовремя отреагировать на выход цены за границы установленного для
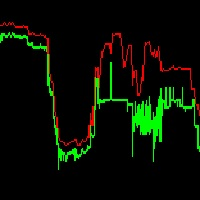
It is super imporant to know what the spread is on your charts!
This indicator displays the Ask High of the past bars, similar to that of the backtester. This allows you to see the spread of bars in real time.
The spread of the bar is the ask-bid price. The spread of a bar is the minimum spread of any ticks found within that bar. I hope this makes sense.
If you have any questions or feedback, let me know - thank you.

This is one of my preferred indicators where it plots on the chart Railroad Track candles, i.e. candles that have similar size. It is a very good indicator for trend direction. In the settings there is an option for Max candle size and Min candle size and also for the percentage for the tolerance between the Min and Max candle size. The candles values are calculated for High and Low. Have fun and enjoy trading! P.S. Please send me a message or leave a comment with any suggestions or improvements

XP Speed Meter the best indicator that measures the price/tick’s currency speed for you. It will give you the ability to know when the pair moving fast or slow . So, you can trade or not trade. It’s very important tool for scalper traders – news traders. Even for trend traders it will be useful to know if the market is trending fast or slow . XP Speed Meter is better than the volume type indicators of course. Because it shows the currency speed on the run-time without any lacking like what the v
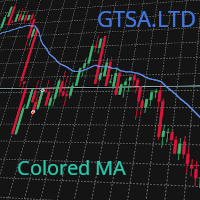
NOTE: Please don't forget to give us some stars, and keep following our work, there are more tools we are going to release. A simple colored MA that you can include in your EA for ease of reading/viewing, you can specify the line color and width during OnInit() and include it in your projects with ease, to include it just use iCustom instead of iMA:
int MyCustomMA; MyCustomMA = iCustom ( Symbol (), PERIOD_CURRENT , "Market/GTSA Colored MA" , 5 , 0 , MODE_SMA , clrCornflowerBlue , 2 , PRICE_CLOS

With Fixed Range Volume Profile,The traces left by the big players will not go unnoticed by you.
Professional Volume Profile Indicator reveals Institutional order flow. This advanced market indicator will teach you to spot the buying and selling. Dont want to say more because its well known by most professionals trader. This Indicator : - Quickly Identify the Strongest Institutional S/R Zones. - W orks with all Trading Instruments (Forex, Futures, Indexes, Commodities, Stocks, Cryptocur

This will find a possible reverse area and show entry signal and this strategy is using every candle and calculate them
buyer should us e with other indicators to get the best trade entry like Macd , RSI , or EMA . SMA.
Make sure try demo first it will supprise you all because how good it is
i hope you guy enjoy it but my coding is not good, so i cant code any EA for this , my own strategy
The RFOC draw smart money concepts assistant was created to assist traders who use the SMC as the basis for their buy and sell operations. With the RFOC Assistent you will have the options to draw: - Buy and Sell Order blocks, only indicating the reference candle; - Fair Value Gaps, only indicating the 2 reference Candles; - Indicate the best buying and selling regions after indicating the reference movement (60 to 80% of the fibonacci); - Draw the illustration of the market structure;
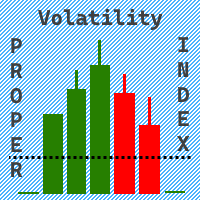
Индикатор Volatility Proper Index отображает в отдельном окне индекс волатильности торгового символа. Для расчета волатильности используется расчет отклонений цены от скользящей средней.
Параметры индикатора: Period - количество последних баров для которых производится расчет индекса волатильности . MinThreshold - минимальное отклонение цены от скользящей средней, при котором это отклонение учитывается в расчетах .
AveragePeriod - период скользящей средней , по умолчанию = 30 послед

Индикатор тренда Riko Trend - революционное решение для торговли по трендам и фильтрации со всеми важными функциями инструмента тренда, встроенными в один инструмент! Индикатор Riko Trend хорош для любого трейдера, подойдет любому трейдеру как для форекс так и для бинарных опционов. Ничего настраивать не нужно все отточено времинем и опытом, отлично работает на во время флета та и в тренде.
Индикатор тренда Riko Trend это инструмент технического анализа финансовых рынков, отражающий текущие о

To test the adviser, do you open a separate account for each of them? this is very inconvenient, but thanks to this indicator, this is no longer a problem!
Do not be too lazy to read the full description and do not close the page ahead of time, this indicator is needed by almost every trader, no matter if he trades with his hands or uses advisors.
Buying this indicator as a gift you will receive an adviser with not bad results.. if you have already received a gift from me from othe

Super Trend Plus is a trading system that uses four Supertrends set with different parameters. The idea behind this system is that when three Supertrends move in the same direction, there is a strong trend confirmation, but entry occurs only when the fourth Supertrend also moves in the same direction as the other three. For example, the first Supertrend could be used with a volatility multiplier of 3 and a period of 10, the second Supertrend with a volatility multiplier of 3 and a period of 12,

To get access to MT4 version please click here . This is the exact conversion from TradingView: "RedK_Supply/Demand Volume Viewer v3.0" by "RedKTrader" This is a light-load processing and non-repaint indicator. All input options are available. Buffers are available for processing in EAs. You can message in private chat for further changes you need. Thanks for downloading
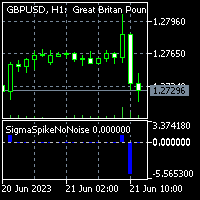
To get access to MT4 version please click here . This is the exact conversion from TradingView: "Sigma Spikes No Noise" by "irdoj75" This is a light-load processing and non-repaint indicator. All input options are available. Buffers are available for processing in EAs. You can message in private chat for further changes you need. Thanks for downloading...

Creating an Index: Importance, Customization, and Weighting Options for MT5 Trading Indicator Designing your index is crucial for efficient symbol tracking in the world of trading. With a powerful MT5 trading indicator, you gain the flexibility to construct an index that suits your preferences, whether it's an equal weighted or custom weighted one. Unlike widely-known indexes like the S&P 500, which heavily favor certain winners, this indicator empowers you to curate a basket of symbols and assi
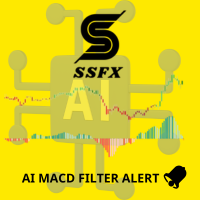
this indicator work with new MACD sittings from chatGPT coding and , You will get an alert through it in any change in the strength of sellers or buyers.
The indicator was tested on gold and gave great results, especially on the five-minute time frame.
It is recommended to use it two hours before the opening of the London markets and until the closing time of the London markets, because the liquidity will be high and you can reap good profits at this time for sure while avoiding staying in the

This indicator works on atr with some edited . The AI MACD FILTER indicator is used for confirmation.
Certainly, the indicator contains an alert when the signal appears, and you use the exit of the deal on the saturation that occurs at the AI MACD. The accuracy of the work is high on gold, the time frame is five minutes, while staying away from trading at the time of news that occurs on the US dollar.
And using high liquidity trading times, which are two hours before the opening of the Lo
MetaTrader Маркет - лучшее место для продажи торговых роботов и технических индикаторов.
Вам необходимо только написать востребованную программу для платформы MetaTrader, красиво оформить и добавить хорошее описание. Мы поможем вам опубликовать продукт в сервисе Маркет, где его могут купить миллионы пользователей MetaTrader. Так что занимайтесь только непосредственно своим делом - пишите программы для автотрейдинга.
Вы упускаете торговые возможности:
- Бесплатные приложения для трейдинга
- 8 000+ сигналов для копирования
- Экономические новости для анализа финансовых рынков
Регистрация
Вход
Если у вас нет учетной записи, зарегистрируйтесь
Для авторизации и пользования сайтом MQL5.com необходимо разрешить использование файлов Сookie.
Пожалуйста, включите в вашем браузере данную настройку, иначе вы не сможете авторизоваться.