Conheça o Mercado MQL5 no YouTube, assista aos vídeos tutoriais
Como comprar um robô de negociação ou indicador?
Execute seu EA na
hospedagem virtual
hospedagem virtual
Teste indicadores/robôs de negociação antes de comprá-los
Quer ganhar dinheiro no Mercado?
Como apresentar um produto para o consumidor final?
Pagamento de Indicadores Técnicos para MetaTrader 5 - 48
UR PulseScalp MT5 Um indicador de negociação calibrado para cambistas que buscam a vantagem máxima em mercados de ritmo acelerado
O UR PulseScalp MT5 é uma solução de negociação de ponta para cambistas que buscam a melhor vantagem em mercados de ritmo acelerado. Este indicador inovador é construído em uma fórmula cientificamente calibrada que combina o poder da Volatilidade, MoneyFlow e Força Relativa para criar um sinal altamente preciso e confiável.
Vantagens de usar o UR PulseScalp MT5:

Multi-Timeframe Moving Average Indicator Provides you a simple edge. How? Let me explain.. Have you ever tried using Moving Average Strategy to trade but you find those entries too late? Have you ever tried to trade with moving averages on 1 Timeframe chart (example 4h) and when i try to lower the timeframe, moving averages change position? If you answered Yes to Both questions , This indicator is the solution for you! 1- You can visualize lower timeframes moving averages on higher timeframes ex
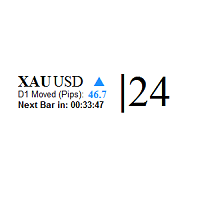
This indicator shows: The market spread Current candle time left to be closed and the pips of market movement from the beginning of the day play sound when candle is going to be closed This is an extremely useful tool for watching the spread rise and fall, allowing you to enter the market at just the right time. This indicator will help you stay out of the market when the spread begins to rise and help you get into the market as the spread begins to fall again.
very useful for day trading and
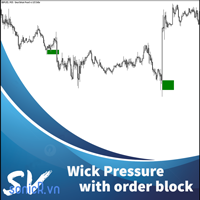
Multiple Wicks forming at OverSold & OverBought levels create Buying and Selling Pressure. This indicator tries to capture the essence of the buy and sell pressure created by those wicks. Wick pressure shows that the trend is Exhausted. Order block should display when buying or selling pressure wick. When price go inside buy order block and up to outside order block, trader should consider a buy order. If price go inside buy order block and down to outside order block, trader should consider a s

O ADN do preço é um indicador de tendência que faz uso de Médias Móveis Ponderadas de Rácio Composto para reduzir os atrasos e permitir a detecção precoce de tendências. O indicador não repintar e pode ser aplicado a qualquer instrumento financeiro em qualquer período de tempo.
Como funciona o ADN Price? O indicador exibirá múltiplas ondas no gráfico, que indicam a direcção do comércio actual. Cinco ondas verdes ou cinco vermelhas indicam uma forte tendência em alta ou em baixa, respectivament

Este indicador exibe informações de preço filtradas na forma de três histogramas coloridos e uma linha colorida comum. Este é um indicador muito colorido e bonito. Ótimo para determinar a força e a direção do movimento dos preços. Este indicador tem configurações muito simples: 1) escolha de três opções para o cálculo do indicador: - original, - demarcador, - volume de equilíbrio. 2) seleção de cinco períodos diferentes. 3) seleção da cor exibida. 4) escolha da precisão. ///////////////////////

Sniper Zones are our best kept secret for trading the forex markets profitably and extremely simple ! After years of profitable trading we are launching it to the public !
After thousands of hours of testing, we have developed an indicator that simplifies trading to the point where anyone can become a profitable trader. There exists certain zones and areas in the market that are used by institutions to move price and cause retail traders to lose their money ! We have done the hardwork and m
Hello all!
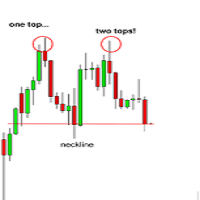
This is indicator 2 top and 2 bottom It will send alert to your phone when price hit top or bottom input uint InpMinHeight = 10; // Minumum Height/Depth input uint InpMaxDist = 20; // Maximum distance between the twin tops/bottoms input uint InpMinBars = 3; // Maximum number of bars after the top/bottom input string Inp_TOP_stringDOWN ="Signal Sell";// TOP: Level UP label input string Inp_BOTTOM_stringUP =

With dynamic Moving average, you can estimate the price movement, predict the next trend of price and have a better decision. Parameters setup: Period start <= Period Stop Period start >= 1
Maximum lines is 100 You can customize Moving average method: Simple averaging, Exponential averaging, Smoothed averaging, Linear-weighted averaging and price to apply: PRICE_CLOSE: Close price
PRICE_OPEN: Open price
PRICE_HIGH: The maximum price for the period
PRICE_LOW: The minimum price for the period
The Scalping Project EA follows a scalping breakout strategy. It trades the breakouts from relative highs and lows. For the entry stop orders are used for the fastest possible execution. Profits can be secured by the adjustable trailing stop. Since the strategy works with small average profits it is highly suggested to trade with a low spread and commission broker. Trading costs are crucial here! The backtests shown in the screenshots were done with the default settings. There might be better or
ONLY 3 COPIES OUT OF 10 LEFT AT $299! After that, the price will be raised to $349. IMPORTANT! Contact me immediately after the purchase to get instructions and a bonus! Advanced Fibo levels is a trading robot for the trading on forex. This is a Fibonacci system that designed to trade for most popular Fibonacci strategy that's completely automated. Warning:
I only sell EA's through MQL5.com. If someone contacts you saying it is me trying to sell you something, they are a Scammer. Block and rep

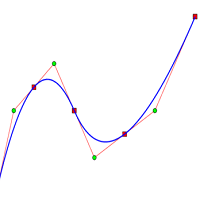
Fit line supports to extrapolation next movement of market, support for buy/sell decision. Indicator using spline algorithm to extrapolation. You can change number of spline with parameter "PointsNumber" and number of extrapolation point with "ExtrapolateBars". Eextrapolation points will be save into csv format, with prefix in parameter "PointsPrefix", and store in folder File of Data Folder.

Able Turn indicator.
Currency pairs never rise or fall in a straight line. Their ups and downs are interspersed with rollbacks and reversals. Every rise and fall is reflected in your emotional state: hope is replaced by fear, and when it passes, hope appears again. The market uses your fear to prevent you from taking advantage of a strong position. At such moments you are most vulnerable.
Everything will change if you use the Able Turn indicator.
The Able Turn indicator was created to neu

Your Helper is a global trend indicator. The indicator should be used on a period not less than H1, H4 and higher is recommended. Despite the apparent simplicity of the indicator, it has complex analytical algorithms inside, with the help of which the system determines the moments of entries. The indicator gives accurate and timely signals to enter and exit a trade that appear on the current candle.
The main purpose of this indicator is to determine the moments of entries and exits from trans

Crash Wizard Indicator funciona em 1 minuto de Crash 500 e Crash 1000 SOMENTE. Este indicador irá traçar um vermelho (x) na vela Drop. ele traçará setas verdes como sinal de entrada BUY e plotará laranja (x) como pontos de saída múltipla. Você o indicador é 85% preciso. você pode usá-lo junto com a ação Price.
OBSERVAÇÃO:
Para usar o indicador, certifique-se de ter uma conta na Deriv, a única corretora de índices sintéticos. NÃO o use em nenhum outro recurso.

The Trend A indicator is a forward-looking arrow indicator that reliably tracks the market trend, ignoring sharp market fluctuations and noise around the average price. It catches the trend and shows favorable moments of entering the market with arrows. The indicator can be used both for pipsing on short periods and for long-term trading. The indicator implements a kind of technical analysis based on the idea that the market is cyclical in nature.

Impulse Fibo indicator is used to determine price levels after some price impulse occurs. How to use it you can see in screenshots and video. In the indicator setup you can fix two different setups for two different patterns. For drawing convenience also two different rectangles can be easy put on the screen to draw support/resistance levels. .
Inputs Draw pattern 1 Line color - choose color from dropdown menu
Line style - choose style from dropdown menu
Line width - enter integer number 1,2

Signaling is a very interesting trend indicator. The Destroyer of Chaos indicator helps to identify either a new or an existing trend. One of the main definitions for monitoring the currency market is a trend, which is why this indicator was created. Its signals are based on a reliable algorithm. When used simultaneously on multiple timeframes, this indicator truly "makes the trend your friend". With it, you can follow trends on multiple timeframes in real time. One of the advantages of the indi

Provided Trend is a complex signal formation indicator. As a result of the work of internal algorithms, you can see only three types of signals on your chart. The first is a buy signal, the second is a sell signal, and the third is a market exit signal.
Options: CalcFlatSlow - The first parameter that controls the main function of splitting the price chart into waves. CalcFlatFast - The second parameter that controls the main function of splitting the price chart into waves. CalcFlatAvg - Par

We publish the indicator as a useful tool in trading and call this indicator the "Swiss Army Knife" because it provides many possibilities and combinations to help understand the material on the "Masters of Risk" trading system. The indicator itself is not part of the tools used in the "Masters of Risk" trading system.
The indicator consists of 3 separate multi-timeframe indicators, which in combination with each other help to reduce the "noise" of false signals. The first of the indicators ar

Perfect Sniper! is a triple indicator with support resistance detection, downtrend channel, uptrend channel Bands included! where he hunts the rebounds in the red lines for sale, in the green lines mark purchase, in the lower bands that are the breaks gives another second entry either buy or sell, perfect to take advantage of the double entrance, It is used in any temporality, It is used to scalp and long on h1 or h4 to D1. It works for Forex markets, All pairs. It is used for the synthetic inde

BandSniper! band indicator , programmed %100 to hunt rebounds on the bands both bounce for the downside and bounce for the upside,, It serves to hunt trends too! where you can see in the photo marked with arrows the buy and sell signals. can be used at any time, Ideal for scalping and long h1 or h4! works for all Forex pairs! and for all pairs of synthetic indices ! World Investor. Good profit
One of the basic needs of every trader is to have a checklist to enter every position. Of course, using pen and paper may not be convenient forever. With this indicator, you can have a small checklist next to the screen for each of your charts and use it for better use in your trades.
By pressing the r button, you can return everything to the original state.
MT4 Version
This indicator will have many updates and special settings will be added to it.
You can contact us via Instagram, Telegram
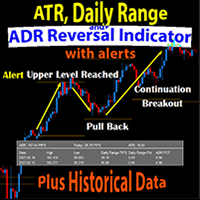
The Daily Range ATR ADR Reversal Indicator shows you where price is currently trading in relation to its normal average daily range. You will received alerts via pop-ups when price exceeds its average daily range. This will enable you to identify and trade pullbacks and reversals quickly.
The Indicator also shows you the Daily Range of Price for the current market session as well as previous market sessions. It shows you the ATR which is the average range of pips that a candle may move in that
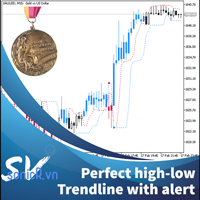
This indicator calculate trendline base on high, low of two period: fast and slow. From that, we have two line for fast signal and low signal. We tested many time on many assets, in most case, when fast signal crossup slow signal, price going up and vice verser. We also add alert function when two signal line crossed. For most effecient, user can change fast and slow period in setting. This indicator is good advice for price move. It better when combine with other trend indicator. For me, i us

The TrendChangeZone indicator displays global and local price highs and lows on the chart. The indicator also shows the global trend on the chart and corrective waves. This indicator is designed to determine the direction and change the trend. Most importantly, the indicator shows trend continuation or reversal zones. An indispensable assistant in trading. The indicator does not redraw. The indicator can work on all trading instruments.
Important !!! Top trend if 2 (two) or more b

An oscillator that shows price changes and identifies areas of overbought and oversold. It can also show trend reversal points. WaveTrend Oscillator is a port of a famous TS /MT indicator. When the oscillator is above the overbought band (red lines) and crosses down the signal (solid line), it is usually a good SELL signal. Similarly, when the oscillator crosses above the signal when below the Oversold band (green lines), it is a good BUY signal. Good luck.

Flags and pennants can be categorized as continuation patterns. They usually represent only brief pauses in a dynamic market. They are typically seen right after a big, quick move. The market then usually takes off again in the same direction. Research has shown that these patterns are some of the most reliable continuation patterns. Bullish flags are characterized by lower tops and lower bottoms, with the pattern slanting against the trend. But unlike wedges, their trendlines run parallel.

Este indicador é baseado no ZigZag original fornecido como um exemplo de código-fonte com as instalações do MetaTrader . Eu reescrevi-o com alguns recursos extras para exibir o canal da “profundidade” e os respectivos “break-outs”. Também permite observar os pontos anteriores do zig-zag. Opcionalmente, pode alertar o utilizador quando ocorrerem os “break-outs”. Os alertas podem ser simplesmente no terminal ou também via notificações “push” num dispositivo móvel, com o seu próprio texto personali

Máquina Trader Tendência
Conte com o nosso rastreador de tendências para realizar as suas operações no Mini Índice e no Mini Dólar!
Operacional
Verde é COMPRA e Rosa é VENDA!
Entrar na operação após fechar o primeiro bloco de cor!
Desenvolvido e Testado no Gráfico de 5 ou 15 minutos para Mini Índice e Mini Dólar!
Pode ser usado em qualquer gráfico!
Cores e Período editáveis!
“Todas as estratégias e investimentos envolvem risco de perda. Nenhuma informação contida neste canal deve
Accurate horizontal support and resistance levels Accurate for price action analysis. All Markets: forex, stocks, indices, metals, commodities ,and crypto Available for meta trader 5 Adjustable parameters I think that's it inputs: For multiple timeframe analysis: adjust "analysis_timeframe" accordingly "depth_of_retrenchments" represents how big the peaks or troughs are. "lookback " represents the most recent number of candlesticks to consider "linecolor " is the color of the lines "lineweig
Introducing the Advanced VWAP tool - an essential technical analysis indicator that can help you identify trend directions and locate price extremas with multipliers. Designed to suit the needs of both traders and EA developers, this tool features customizable parameters that allow you to tailor it to your specific trading style. With Advanced VWAP, you have the ability to customize the colors and styles of all bands to your liking. If you don't require any bands, you can simply set their values
This indicator will identify when Fast Moving Averages (EMA, SMA, or LW) cross Slow Moving Average lines on any timeframe and with any symbol.
When the moving averages cross and price close above or below the crossing, the User will receive an alert via pop-up, push, or email.
Choose any two Moving Averages to cross to receive an alert and the Indicator will also paint the Moving Average Lines and Arrows.
You can choose Exponential Moving Averages (EMA). Simple Moving Averages (SMA) or Lin
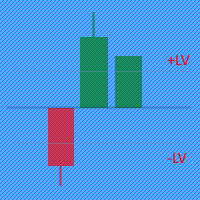
The Price Movement Strength indicator displays the direction and strength of the price change in the form of a candle on each price bar. If the indicator shows the closing level of the candle equal to zero on the current bar, then the price has not changed during bar. If the indicator shows a green candle, then the price of the trading instrument is growing, and vice versa, a red candle signals a price fall. Input parameters: The indicator has two parameters for setting buy/sell levels: BuyLevel

My candle foi criado pra traders avançados que pretendem criar seus próprios padrões de candle usando informações do mercado e algumas regras matemáticas, mas se você quer um indicador mais simples que contenha apenas os padrões de candlesticks tradicionais do mercado você pode baixar aqui esse indicador de padrões de candle para metatrader 5 Como os padrões de candle são criados A regra para um padrão de candle é definida usando as informações e mercado como Open, High, Low e Close junto co

Optimized Trend Tracker OTT is an indicator that provides traders to find an existing trend or in another words to ser which side of the current trend we are on.
We are under the effect of the uptrend in cases where the prices are above OTT ,
under the influence of a downward trend, when prices are below OTT
it is possible to say that we are.
The first parameter in the OTT indicator set by the two parameters is the period/length.
OTT will be much sensitive to trend movements if i
Unlike many other indicators including the moving average indicator, Pivot Point can be a leading indicator. In these systems, the price levels of the previous period are used to determine the critical points instead of relying on the current price performance. Such an approach provides a clear framework for traders to plan their trades in the best possible way.
You can use this method and its combination with the methods you want to build and use a powerful trading setup. MT4 version
Let us k
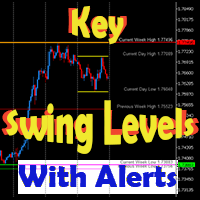
This dynamic indicator will draw the Key Swing High and Low Levels for any symbol on any timeframe!
User may Hide or Show any Level or Label and also Receive Alerts when price returns to that key level via Pop-Up, Push, Email or Sound.
Levels include Current Day High/Low, Previous Day High/Low, Current Week High/Low, Previous Week High/Low and Monthly High/Low.
The Levels are labeled with the Price Point Data Listed next to it for quick easy reference.
You can change the Style, Size an

El indicador "Mega Spike Boom and Crash" es una herramienta diseñada para su uso en los índices sintéticos, específicamente en los pares Boom y Crash. Su propósito principal es identificar y trazar zonas que funcionan como niveles de soporte y resistencia en distintas temporalidades. La temporalidad mas recomendada para usar este indicador es en el marco de tiempo de 5 minutos El precio de apertura de ( 1 H , 15 M , 30M ) horas son los niveles de precios más importante del día. Representa

The Advanced Momentum Trend indicator is an indicator used to determine trend directions. It determines the trends by considering many factors while calculating the trend. You can use this indicator as a trend indicator or in combination with other indicators that suit your strategy. You can also use it as a stand-alone trend filtering. Thanks to the alert feature, you can instantly learn about the new trends. To View Our Other Products Go to the link: Other Products
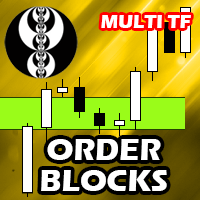
MT4 Version Kill Zones SMT Divergences Order Blocks ICT Multi TF
The Order Blocks ICT Multi TF indicator is a cutting-edge tool designed to help traders make better trading decisions based on order block analysis. Order blocks are key levels on a price chart where large institutional traders placed their orders. These levels tend to act as strong support or resistance zones and often signal a potential reversal or continuation of a trend. By identifying these order blocks, traders can gain

The Intra Daily Range Projection indicator forecasts the current day’s price range on the basis of the previous day data. All calculations are based on the book “New Science of Technical Analysis” by Thomas R. DeMark.
When you're analyzing investments, the trading range is a valuable analytical tool. The average trading range is the average distance between the high and the low over a specified period of time. You can calculate the average high-low range on a piece of paper, a spreadsheet, o

Phase accumulation adaptive bandpass filter MT5 Indicator is a Metatrader 5 (MT5) indicator and the essence of this technical indicator is to transform the accumulated history data. Phase accumulation adaptive bandpass filter MT5 Indicator provides for an opportunity to detect various peculiarities and patterns in price dynamics which are invisible to the naked eye. Based on this information, traders can assume further price movement and adjust their strategy accordingly.

This indicator closes the positions when Profit. This way you can achieve a goal without determine Take Profit.
Parameters: Profit: the amount of Dolllars you want to close when profit.
Just determine Profit section and open new positions. If Any of your positions reaches above Profit , Indicator will close automatically and you will recieve your Profit.
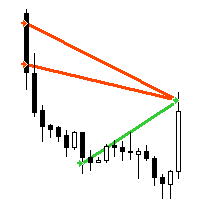
"AV Trade History MT5" is an indicator for MetaTrader 5, which similar to the "Trade History" or "Show trade history" setting, shows the closed trades on the chart. It also shows the orders history in the strategy tester, makes it easier to see them when testing expert advisors automated trading.
Improvements :
- Visibility is increased by line thickness and free choice of color.
- Additional information about the trade is visible when hovering over it, e.g. ticket, magic, comment, di

Gold Pointer é o melhor indicador de tendência. O algoritmo único do indicador analisa o movimento do preço do ativo, tendo em conta os factores de análise técnica e matemática, determina os pontos de entrada mais rentáveis e dá um sinal para abrir uma ordem de COMPRA ou VENDA.
Os melhores sinais do indicador:
- Para VENDER = linha de tendência vermelha + indicador TF vermelho + seta de sinal amarelo na mesma direção. - Para COMPRAR = linha de tendência azul + indicador TF azul + seta de si
The SD Indicator is a powerful tool in the world of Forex trading, that combines two classical strategies: Support/Resistance levels and Supply/Demand zones. The indicator helps traders to identify potential trading opportunities in the market with high accuracy.
Support and resistance levels are key price levels where buying and selling pressure converge, leading to potential price reversals. The SD Indicator identifies these levels in real-time and provides traders with a clear picture of wh

Correlation indicator is a trading indicator that compares price correlations on up to 8 different instruments simultaneously. This indicator is designed to be very versatile. It can be used to trade many different strategies from scalping to hedging to simple trend-following based on an average trend direction of multiple currency pairs or it can signal only when all the pairs correlate on the same side of a particular moving average. The indicator automatically applies the same moving average

"Scalper Channel MT5" is a modern channel indicator that shows the trader the direction of the trade. For work, the indicator uses built-in and proprietary technical means and a new secret formula. Load it on the chart and the indicator will show you the entry direction in color:
If the upper limit of the price channel of the indicator is blue, open a buy position. If the lower limit of the price channel of the indicator is red, open a sell position. If the border of the indicator is gray, ne

Detect divergence (classic, hidden) price and all oscillator indicator include: RSI, CCI, MACD, OSMA, Stochastic, Momentum, Awesome Oscillator (AO), Accelerator Oscillator (AC), Williams Percent Range (WPR), Relative Vigor Index (RVI), Rate of Change (ROC). Confirm reversal with dochian channel for to improve signal quality. Divergence is when the price of an asset is moving in the opposite direction of a technical indicator , such as an oscillator, or is moving contrary to other data. Diverge

This indicator is suitable for trading on the pair and many others. The indicator itself uses universal calculations of additional accuracy, but so far they are optimized for some currency pairs. Many settings can be configured on the main menu. He displays his calculations on the graph in the form of icons. There are two types of icons. In the tester, it works fine by default in the settings. You can specify a color for its icons. There is a panel. Happy trading.

Trend pyramid! is an indicator that meets the trend hunting strategy! where clearly mind gives the entry signal when it shows the light blue point hunting the trend with the blue line, for the purchase (BUY) where for sale (SELL) shows the red dot with the Yellow trend line can be used for any temporality, as long as you want to hunt a short trend or a long trend. Available for all Forex pairs and Synthetic Indices! Investor World.

Price Stellar! is a bot that has the strategy of grabbing rebounds on the roofs or floors of the Yellow channel, accompanying an ema to hunt the bullish or bearish trend, It can be seen very clearly in the photo what the strategy is about works for all seasons to scalp and long works for all forex pairs and for the pairs of synthetic indices ! from now to enjoy good profit World Investor.

Trend Uranus! It is an indicator that works in line with support and resistance, giving entrances with the roofs and floors Red (Sale) Green (Buy) to catch a better trend ideal for scalping in the Volatility 75! works for all synthetic index pairs ! and for all forex pairs! ideal for the pair Eur/Usd, Usd/Jpy! from now to enjoy good profit!!!!! World Investor.

Trend charges! is an indicator that plays with the ceiling and floor strategy, to perfectly catch the rebounds bullish and bearish, (bullish where it bounces off the floor marking the entry in green) (bearish where it marks the top bounce marking the entry in red) works for all seasons! Special for scalping 1 and 5 minutes! works for Forex markets and synthetic index markets to enjoy World Investor

Macd Neptune! It is a modified macd oscillator where it better captures sales and purchases the indicator clearly marks the crossing of moving averages, In addition to that, it marks the purchase and sale with each color, for sale marks the salmon line in the purchase mark the blue line where it gives you the signal changing color is giving you the entrance! It is used in any temporality, used for forex markets and synthetic indices good profit World Investor

Arrow Venus! is an oscillator that uses the strategy of crosses capturing the entry whether for sale or purchase where it can be seen in the photo, when the line crosses the blue line with the red one, marking the red arrow it's sale, when the blue line crosses the red one upwards and marks the blue arrow, it is a buy signal very good for scalping and long! used at any time for forex markets and synthetic indices

Fibo expert! It is an automatic fibonacci indicator. adapting to any temporality, to catch those rebounds, or the path of that trend, special to make longs in H1 or H4 clear the trend, but it also works for scalp in m1 up to m15 works for all forex pairs and for all pairs of synthetic indices, ideal for volatility 75 in synthetics no more to enjoy good profit World Investor.

Stock Mantra It is an oscillator that is used to hunt long trends, as can be seen in the mantra, it gives input when the lines are crossed, the blue line above crossing the red line gives entry for sale, When it is the other way around, crossing the blue line, the red one up gives a buy entry signal. super simple and effective! works for all forex pairs and synthetic indices! used in all seasons good profit World Investor

"AV Monitor MT5" is an indicator for MetaTrader 5, which alowes a history analysis of the closed orders. It helps to achieve a quick visual analysis of your own trading or different expert advisors among themselves. Compare and analyze your expert advisors: Which one is the best?
I use an "AV Monitor MT5" indicator per running expert advisor chart to track its performance split into long & short, as well as an index chart e.g. DOW with this indicator and the setting "Show Balance & Equity" to
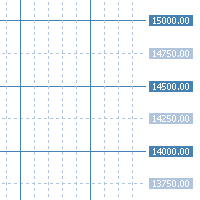
"AV Grid MT5" is an indicator for MetaTrader 5, which automatically displays round numbers as horizontal lines and a sensible period separation .
Round prices can be used as support and resistance in trading.
It is an improvement on the "Grid" setting, which also draws a grid on the chart.
Improvements :
- Round levels instead of arbitrary positioning of the horizontals
- Structure by highlighting all x lines (main lines, 2 or 5 makes sense)
- Vertical lines are each in two p

The Returns Momentum Oscillator (RMO) shows the difference of exponentially weighted volatility. It is used to find market tops and bottoms. Volatility comes in waves, and as the Returns often front run price action it gives directional prediction of market movement. The Oscillator signal is RMSed (root mean squared) to make the distribution closer to Gaussian distribution. While the traditional RSI indicators are often stuck in overbought or oversold areas for a long time, RMSing of the sign
O indicador "EMA43 vs EMA89" é uma poderosa ferramenta para traders que procuram identificar reversões de tendência e potenciais oportunidades de negociação. Este indicador exibe duas médias móveis, a EMA34 e EMA89, no gráfico. Quando essas médias móveis cruzam, um alerta de compra ou venda é gerado, indicando uma possível mudança na direção da tendência. Recursos: Fácil de usar: basta anexar o indicador ao seu gráfico e começar a receber alertas quando a EMA34 e EMA89 cruzarem. Períodos de médi
Máquina Trader Tendência
Conte com o nosso rastreador de tendências para realizar as suas operações no FOREX, Mini Índice e Mini Dólar!
Operacional
Verde é COMPRA e Rosa é VENDA!
Entrar na operação após fechar o primeiro bloco de cor!
Desenvolvido e Testado no Gráfico de 5 ou 15 minutos para Mini Índice e Mini Dólar!
Pode ser usado em qualquer gráfico!
Cores e Período editáveis!
“Todas as estratégias e investimentos envolvem risco de perda. Nenhuma informação contida neste canal

Welcome to the Ultimate Harmonic Patterns recognition indicator that is focused to detect advanced patterns. The Gartley pattern, Bat pattern, and Cypher pattern are popular technical analysis tools used by traders to identify potential reversal points in the market.
Our Ultimate Harmonic Patterns recognition Indicator is a powerful tool that uses advanced algorithms to scan the markets and identify these patterns in real-time.
With our Ultimate Harmonic Patterns recognition Indicator, you

Bollinger Bands based on Returns This indicator characterizes the price and volatility by providing a channel/band of standard deviations like the Bollinger Bands. In contrary to standard Bollinger Bands which uses price directly, this indicator uses returns due to normalization. The standard Bollinger Bands based on price directly, were one of the first quant or statistical methods for retail traders available. The issue with these bands, standard deviations can only be calculated, if the u

O WA Order Block FVG bos MT5 é um indicador com base no estudo de SMC (Smart Money Concepts) criado pelo ICT Inner Circle Trader, eleplota no seu gráfico as informações de Order Blocks em 3 tempos gráficos diferentes, fair Value Gaps e Regiões de Liquidez além do BOS ( Break os Structures), tudo em um só indicador. Dessa forma você não precisa colocar essas informações de forma manual. Agora você tem tudo isso de forma automática em seu gráfico.

OHLC Volume Histogram displays the difference between two streams of the OHLC Volume volume indicator as a colored histogram. There are no input parameters. Calculation: Histogram = StreamUP - StreamDN where: StreamUP = Volume * UP_Coeff / (UP_Coeff+DN_Coeff) StreamDN = Volume * DN_Coeff / (UP_Coeff+DN_Coeff) UP_Coeff = High-Open DN_Coeff = Close-Low Volume - tick volume

What Is Moving Average Convergence/Divergence (MACD)? Moving average convergence/divergence (MACD, or MAC-D) is a trend-following momentum indicator that shows the relationship between two exponential moving averages (EMAs) of a security’s price. The MACD line is calculated by subtracting the 26-period EMA from the 12-period EMA. The result of that calculation is the MACD line. A nine-day EMA of the MACD line is called the signal line, which is then plotted on top of the MACD line,

“Multi timeframe Slow Volume Strength Index” shows data of three SVSI indicators from different timeframes on the current chart. The indicator has nine adjustable parameters: EMA period – EMA SVSI calculation period Smoothing – SVSI smoothing period Overbought – overbought level Middle – middle line Oversold – oversold level Drawing mode – indicator drawing type Steps – as a ladder Slope – sloping lines First SVSI timeframe – the timeframe of the first SVSI Second SVSI timeframe – th
Você sabe por que o mercado MetaTrader é o melhor lugar para vender as estratégias de negociação e indicadores técnicos? Não há necessidade de propaganda ou software de proteção, muito menos problemas de pagamentos. Tudo é providenciado no mercado MetaTrader.
Você está perdendo oportunidades de negociação:
- Aplicativos de negociação gratuitos
- 8 000+ sinais para cópia
- Notícias econômicas para análise dos mercados financeiros
Registro
Login
Se você não tem uma conta, por favor registre-se
Para login e uso do site MQL5.com, você deve ativar o uso de cookies.
Ative esta opção no seu navegador, caso contrário você não poderá fazer login.