Conheça o Mercado MQL5 no YouTube, assista aos vídeos tutoriais
Como comprar um robô de negociação ou indicador?
Execute seu EA na
hospedagem virtual
hospedagem virtual
Teste indicadores/robôs de negociação antes de comprá-los
Quer ganhar dinheiro no Mercado?
Como apresentar um produto para o consumidor final?
Pagamento de Indicadores Técnicos para MetaTrader 5 - 58

The Trend Approximator indicator is a powerful trend indicator that helps traders identify turning points in the Forex market. Here are the main characteristics and parameters of this indicator:
Main characteristics:
Trend Indicator: Trend Approximator is a trend indicator that helps determine the direction of the current trend and identify potential reversal points.
Finding Pivot Points: It searches for and displays pivot points on a price chart, allowing traders to react to changes in t

Brief Description: Introducing the B4S BidLine CandleTimer – an insightful indicator. This innovative tool combines real-time bid line visualization with a dynamic countdown timer. Gain a competitive edge in your trading as you stay informed about the time remaining until the next candle starts, all displayed seamlessly on your chart. Why B4S BidLine CandleTimer? Unleash the potential of your trading strategy with the B4S BidLine CandleTimer. Here's why this indicator stands out: Real-Time Bid L

Brief Description: An advanced navigation and news display indicator designed to revolutionize your chart analysis experience. Seamlessly navigate through timeframes, dates, and times with an intuitive control panel, and stay informed with visually represented detailed news events. Key Features: 1. User-Friendly Control Panel: · Easily navigate through timeframes, dates, and times. · Enable or disable the display of news events with a simple checkbox control. 2.

Limited time offer, 30 usd only!!!
Discover the unparalleled capabilities of MentFX's structural rules , now optimized for MT5 ! Our state-of-the-art algorithm is engineered to commence calculations from a robust dataset spanning 1500 bars from the current position . This meticulous approach ensures unparalleled accuracy and dependability in your trading endeavors. Experience the seamless integration of MentFX with MT5 , empowering you to analyze markets with precision and confidence. With Me

O painel verifica as leituras de dois indicadores: ‘MACD’ e ‘Estocástico’. Exibe sinais em três colunas: para MACD, para Estocástico e a coluna resultante (se o sinal for o mesmo para ambos os indicadores). A digitalização pode ser selecionada em um ou mais períodos de tempo. Se você desabilitar todos os prazos, o painel ainda será carregado, mas com configurações específicas para esses casos. Os sinais são sempre verificados para a barra zero (a barra zero é a barra mais à direita do gráfico) d

The well-known ZigZag indicator that draws rays based on the "significant movement" specified by the pips parameter. If a ray appears, it will not disappear (the indicator is not redrawn), only its extremum will be updated until the opposite ray appears. You also can display text labels on each rays describing the width of the ray in bars and the length of the ray in points.
The set of most common indicators for day trading and long-term trading.
MAs Cross (Global Trend) ADX Based Candle Color (Local Trend) Pivot Points (Entry Levels) Kijun-Sen You can use this indicator in different ways, one of it is opening positions in trend direction on pivot points levels. Contact
If you have some questions or if you need help, contact me via Private Message.
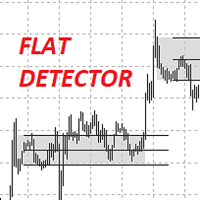
I present to you the IndFlatDetector indicator.
It belongs to the level indicators and shows the Trading Levels. This indicator combines the simplicity of intuitive settings and the accuracy of drawing levels.
Up count - the number of candlesticks up to determine the upper range
Down count - the number of candlesticks down to determine the lower range
Borders on the body or shadow - calculate the range by shadows or by body
Change the borders or not - change the boundaries of the orig

The market structure indicator helps traders easily read market trends, this indicator shows trend continuity and trend reversals, this tool will be very useful for beginners who are just getting to know market structure, the indicator will provide visualization of the patterns that occur
Key Features: 1. BOS pattern: The indicator will provide an overview of the Break Of Structure pattern, where the pattern will indicate the continuation of the trend 2. CHOCH Pattern: The indicator will prov

The ZigZag Wave Entry Alert** indicator, created by Azad Gorgis in 2024, is designed for MetaTrader 5 and aims to provide traders with entry signals based on ZigZag patterns. Here's a brief overview of its functionality and key features:
Functionality:
- Detection of ZigZag Patterns: The indicator identifies significant price movements and outlines potential ZigZag patterns on the chart. It detects new highs and lows based on user-defined parameters such as Depth, Deviation, and Backstep. -

The " Session Control " indicator is designed to display trading sessions on a price chart. This allows the trader to see at what points of activity the most important trading sessions occur: Pacific, European, American and Asian. Each of these sessions is characterized by a certain volatility and activity in the market, which is important for making trading decisions.
Peculiarities: Displaying sessions : The indicator shows time periods on the price chart corresponding to different trading s

"GoldenSwing" is a comprehensive MetaTrader 5 indicator meticulously crafted by Southern Star Trading, designed to enhance your trading strategies with precision swing high and swing low identification. Harnessing the power of swing analysis, this indicator provides traders with invaluable insights into market reversals and trend continuations, enabling them to make informed trading decisions.
With its advanced algorithm, GoldenSwing detects significant swing highs and swing lows in real-time

Description:
Heikin-Ashi-like swing oscillator candles. It can be used in the same way as RSI or Stochastic.
For example: Zero crossing. Above the zero line is bullish, below the zero line is bearish.
Overbought or oversold. 100 line is the extreme bought level, -100 line is the extreme sold level.
Divergences.
Time frame: Any time frame.
Instrument: Any instrument.

The " Vertical Levels " indicator for the Forex market is a tool for displaying vertical levels on a price chart. These levels can be useful for a trader, as they help identify significant points in price movement and potential reversal or trend continuation zones.
Peculiarities:
Vertical Levels: The "Vertical Levels" indicator allows you to display vertical lines on the chart, indicating certain levels. These levels can be adjusted using input parameters. Setting options: Length : Length o

This indicator is based on the mathematics of the great trader W.D. Ganna. With its help, you can easily find strong levels by analyzing swings to find the optimal entry point. The indicator works on all instruments and all timeframes. The indicator is fully manual and has control buttons. All you need to do is press the NEW button, a segment will appear, which you can place on any movement, swing or even 1 candle that you want to analyze. By placing the segment, press the OK button. A grid (th

The indicator is designed to work on any trading platform. The program is based on proprietary algorithms and W.D.Ganna's mathematics, allowing you to calculate target levels of price movement based on three points with the highest degree of certainty. It is a great tool for stock trading. The indicator has three buttons: NEW - call up a triangle for calculation. DEL - delete the selected triangle. DELS - completely remove all constructions. The probability of achieving the goals is more than 80

This indicator identifies and displays zones, as it were areas of strength, where the price will unfold. The indicator can work on any chart, any instrument, at any timeframe. The indicator has two modes. The indicator is equipped with a control panel with buttons for convenience and split into two modes. Manual mode: To work with manual mode, you need to press the NEW button, a segment will appear. This segment is stretched over the movement and the LVL button is pressed. The level is displayed
Este indicador é um oscilador de escala semilogarítmica ancorado. Uma escala logarítmica é amplamente utilizada por cientistas de dados profissionais para mapear com mais precisão as informações coletadas ao longo de um período de tempo, da mesma forma que o MT5 mapeia os dados de preços. Na verdade, a lógica subjacente a este indicador foi obtida gratuitamente de um cientista biotecnológico estrangeiro.
Um gráfico log-log exibe valores logarítmicos nos eixos x (horizontal) e y (vertical), o

Brief Description B4S Economic News Radar is designed to keep traders informed about upcoming and past news events directly on your trading chart. This indicator provides a comprehensive news dashboard, vertical lines marking news events, customizable reminders for upcoming news events and a unique persistence feature for your preferred settings. Why News Events Matter: Economic indicators, central bank decisions, and geopolitical events can trigger market volatility, influencing currency values

Brief Description: A powerful tool designed to display historical Open, High, Low, and Close (OHLC) price points for various essential time periods. Gain valuable insights into market behavior with a focus on yesterday, the day before yesterday, the previous week, and the previous month. The indicator not only provides a retrospective view of market dynamics but also serves as a powerful tool for recognizing liquidity zones. Features: 1. Comprehensive Timeframe Insights: · Visua
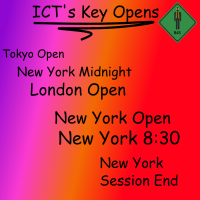
Brief Description The indicator is a powerful tool based on Inner Circle Trader's trading theory. It strategically plots lines at key prices relative to time, highlighting crucial market moments such as Tokyo Open, New York Midnight, London Open, New York Open, New York 8:30 AM, and New York Session End. The indicator is built on the foundation of Inner Circle Trader's trading theory, emphasizing the significance of key open times as liquidity and reference zones. These zones act as magnets for
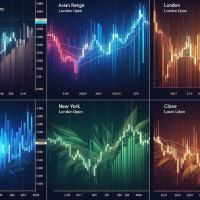
Brief Description The B4S_ICT_Killzones indicator is designed to enhance your trading strategy by highlighting key market times based on the Inner Circle Trader's (ICT) proven trading model. This indicator intelligently plots colored boxes around critical "killzone" periods, providing valuable insights into market behavior influenced by different geographical and time zone locations and time variations. Features / Indicator Settings 1. Killzone Identification Asian Range: Target the Asian trad

Brief Description: The B4S_Institutional_Round_Number_Prices indicator identifies and marks key price levels, known as round number prices or institutional price levels, renowned for their psychological significance. These levels often influence institutional activity, attracting attention and triggering significant market moves. Features: Round Number Price Identification: The indicator excels at identifying round number prices, providing you with crucial insights into potential market moveme

Brief Description The B4S PriceLevel Watcher is a useful indicator designed to empower traders with precise price level notifications. It allows users to set customizable notifications based on specific price types, such as close, high, low, ask, bid, or either ask or bid of the current candle. Problem being solved In the ever-evolving world of trading, staying attuned to price movements is paramount. Traders need to remain vigilant, ready to act swiftly as market conditions change. However, t

Introducing the Consecutive Green/Red Candle Alert Indicator for MT5 - Your Trend Spotting Companion!
Are you ready to take your trading to the next level? We present the Consecutive Green/Red Candle Alert Indicator, a powerful tool designed to help you spot trends and potential reversals with ease. Whether you're a new trader looking for clarity in the market or an experienced pro seeking additional confirmation, this indicator is your trusted companion.
Key Features of the Consecutive Gre

The Chapon Channel indicator is a classic channel indicator that allows a trader to react when the price goes beyond the boundaries of the established channel. This channel is formed based on the analysis of several candles, starting with the last one, in order to determine the extremes in the period under consideration. These extrema are then used to construct channel lines.
Channel trading is one of the most popular strategies in the Forex market and due to its simplicity, even beginners ca
Buy DEMA 3 Scalp Indicator, Signaling and Trend Finder for Forex DEMA 3 indicator is a professional indicator for finding trends as well as finding entry and exit points for a symbol. This indicator is designed based on the DEMA indicator, which can tell you the signals accurately and quickly. The DEMA 3 indicator can give you accurate and early entry points for swings. Features of the DEMA indicator 3
Receive signals as notifications on the Metatrader mobile application. Receive signals by em

About:
Introducing the "Median Proximity Percentile" developed by AlgoAlpha, a sophisticated trading indicator engineered to augment market analysis. This tool adeptly monitors the proximity of median prices over a designated historical period and delineates its percentile position amidst dynamically evolving standard deviation bands. It furnishes traders with invaluable insights essential for well-informed decision-making.
Features: Color-Coded Visuals: Facilitate intuitive comprehension o
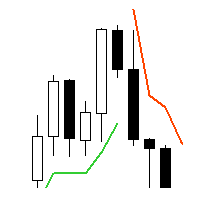
Supertrend - невероятно мощный и универсальный индикатор, предназначенный для помощи трейдерам в определении текущего тренда на конкретном торговом инструменте. С помощью двух встроенных индикаторов, Average True Range и Standard Deviation, трейдеры могут выбрать наиболее подходящий индикатор для своей стратегии торговли. Пользователи также могут настроить период этих индикаторов и выбрать цену (Close, High, Low, Open, Weighted), к которой он должен быть применен, с Typical price в качестве опци

Heikin Ashi Heikin Ashi is a charting technique that can be used to predict future price movements. It is similar to traditional candlestick charts. However, unlike a regular candlestick chart, the Heikin Ashi chart attempts to filter out some of the market noise by smoothing out strong price swings to better identify trend movements in the market.
To create Heiken Ashi, a formula is used in which price data is entered, while ordinary candles are built only on bare numbers, without using any

An invention that will turn your working principles upside down.
Especially in horizontal and stagnant markets, annoying losses can occur.
Besides, following trend lines, support and resistance can be tiring.
To put an end to all this, I decided to create a professional "moving average" indicator.
All you have to do is follow the colors.
If you need additional support, I recommend the "Heiken-Ashi" candle indicator in my profile.
I wish you lots of profit..

The RSI Advanced tool will help traders capture trends and optimal entry points by:
- Enter a Buy order when the green line crosses the yellow line. Provided that the yellow line is near line 32 or 20 - Enter a Sell order when the green line crosses the yellow line. Provided that the yellow line is near line 68 or 80
Additionally, you can combine it with the convergence divergence that occurs at the green line.
**When you purchase the Mastering the RSI MT4 or Mastering the RSI MT5 indicat

Description: Dimatis Watchtower is a powerful backtesting tool designed for traders seeking for an efficient way to test and optimize their trading strategies on the MetaTrader 5 platform. With a minimalist interface and advanced features, this tool provides an outstanding solution for evaluating the performance of your strategies in various market conditions. Key Features: Backtesting: Perform precise and reliable backtests of your strategies using historical data from your broker directly on M

Source Trend Indicator: A Powerful Tool for Market Analysis!
Advantages: Trend Detection: The Source Trend indicator will help you immediately identify the direction of price movement and understand the interaction between buyers and sellers. Versatility: Works on all time frames and with any currency pairs, providing flexibility and adaptation to different market conditions. Accurate Signals: Provides reliable signals in both trending and flat markets, helping you make informed decisions. Co

PricePulse Pro - Indicator of Simple Solutions! Using this indicator is very easy - just follow the colored arrows on the chart. The indicator algorithm takes into account daily price fluctuations and focuses on measuring the "candlestick" share in the trend.
This indicator uses an algorithm that considers price changes based on various parameters such as H/C (high price/close), H/O (high price/open), LC (low price/close), LO (low price/open). This allows for a more detailed analysis of price

Introducing the PriceStream Channel - a classic channel indicator that allows traders to timely react to price movements beyond the established channel boundaries. This corridor is built based on the analysis of several candles, starting from the last one, which helps identify the extremes of the studied period. These extremes then create the channel lines.
Trading within a channel is one of the most popular strategies in forex, and its simplicity makes it suitable even for beginners. The Pri

O indicador Spread Pulse MT5 é uma ferramenta eficaz que fornece aos traders informações sobre o spread atual no gráfico. Spread é a diferença entre o preço de compra e o preço de venda de um instrumento.
O indicador é apresentado na forma de texto exibido no gráfico. Isto permite ao trader rastrear facilmente o spread atual.
Uma das principais vantagens do indicador Spread Pulse é a visualização de cores. Dependendo do tamanho da página espelhada, a cor do texto muda. Por padrão, quand

Supertrend is a trend following indicator based on the Average True Range (ATR) . Calculating the odd line combines trend detection and volatility. It can be used to detect changes in trend direction and position stops.
Basic knowledge Supertrend is a trend following indicator. It takes up space on the main chart and its plots show the current trend. A Supertrend can be used for varying durations (daily, weekly, intraday, etc.) and varying instruments (stocks, futures or forex). Super
Introducing the Reversal and Breakout Signals
This innovative tool is crafted to enhance your chart analysis by identifying potential reversal and breakout opportunities directly on your charts. It's designed with both novice and experienced traders in mind, providing intuitive visual cues for better decision-making. Let's dive into the key features and how it operates:
### Key Features:
Dynamic Period Settings: Customize the sensitivity of the indicator with use

Indicator Price Pivot is an efficient tool for identifying trends in the Forex market. It serves as a reliable assistant to traders, helping to determine trend and range zones. Below are the characteristics and advantages of this indicator:
Features of the Price Pivot indicator:
Reliability and stability: The indicator does not repaint previous values, ensuring signal stability.
Quick reaction to trend changes: The indicator's algorithm allows for swift responses to market trend changes.

Paladin is a fundamental technical indicator specially designed for Forex traders. It is based on a unique algorithm that forecasts future prices by analyzing historical quote data over a specific user-defined time period set in the indicator's settings.
This indicator provides traders with valuable information about potential changes in price direction. Using a special formula at its core, Paladin accurately calculates signals. It effectively identifies reversal points or sharp price movemen

The PriceActionOracle indicator greatly simplifies your trading decision-making process by providing accurate signals about market reversals. It is based on a built-in algorithm that not only recognizes possible reversals, but also confirms them at support and resistance levels. This indicator embodies the concept of market cyclicality in a form of technical analysis.
PriceActionOracle tracks the market trend with a high degree of reliability, ignoring short-term fluctuations and noise around

Vanguard's Volatility indicator is based on the analysis of long and short price volatility. It helps to determine market entry points by displaying favorable entry points with arrows. This indicator can be used as a filter in trading or as a tool to show the exact direction of the trend. It is suitable for both scalping on small time intervals and long-term trading. It is important to remember that successful trading requires a comprehensive approach, and additional information is needed to en

The Pivot Point Pioneer indicator is based on unique indicators capable of detecting extreme points. It is ideal for identifying reversals or sharp price movements in one direction. Thanks to this indicator, you will be informed about upcoming events: a blue dot will appear for a buy signal, and a red dot for a sell signal.
This technical indicator allows you to assess the current state of the market and make a decision about entering a trend movement with minimal risk. It uses a process of a

Certainly! Let’s discuss the RSI Rush , an aggressive momentum indicator that combines weighted moving averages (WMAs) at lows, mid-price, and tight highs. Here are the key components: Weighted Moving Averages (WMAs) : The RSI Rush employs three WMAs: WMA at Lows : Calculated based on the lowest prices during a specific period. WMA at Mid-Price : Considers the average price (midway between highs and lows) during the same period. WMA at Tight Highs : Based on the highest prices during the speci
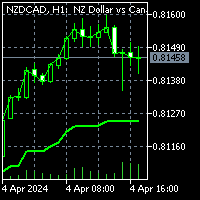
To get access to MT4 version please click here . This is the exact conversion from TradingView: "G-Channel Trend Detection" by "jaggedsoft". This is a light-load processing and non-repaint indicator. You can message in private chat for further changes you need. All input options are available. Buffers are available for processing within EAs. Highlight option is omitted as does not show good in Metatrader.
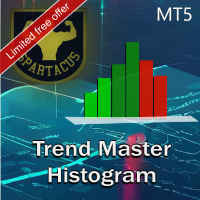
Trend Chart Histogram é um indicador baseado em um algoritmo que usa duas médias móveis e vários osciladores. Graças ao seu código de cores, permite identificar rapidamente a tendência e aproveitar os maiores impulsos do mercado.
As cores claras indicam a tendência, as escuras definem os impulsos e o cinza indica que você não deve entrar no mercado.
Versão MT4 aqui.
Parâmetros de entrada:
- Período 1 (período rápido)
- Período 2 (período lento)
- Período do oscilador
Você pode a

indicator seems to be a sophisticated tool for trend analysis in financial trading. It utilizes Bollinger Bands with an exponential method and color-coding to indicate the current trend direction—whether it's with the trend (bullish) or against it (bearish), as well as using the intermediate color, blue, to suggest a potential trend reversal.
Additionally, the indicator uses a total of six tracks—upper band, upper band EMA, middle band, middle band EMA, lower band, and lower band EMA—to asses

Higher Timeframe Chart Overlay will display higher timeframe candles, including the number of candles high/low you specify.
You no longer need to switch timeframes to check the candles. Everything can be shown in one chart. MT4 Version : https://www.mql5.com/en/market/product/115680 Almost everything can be change as you want. You can change/set:
- Choose different colors for the body and top/bottom wicks.
- Panel's height and width.
- The width of the body and wicks
- Change backgrou

1. CONSTITUTION Goby Momentum it consists of two oscillator and three dynamic bands (upper, middler, lower). The inputs can be used to adjust the oscillators, the dynamic bands and the alert signals. 2. UTILITY This indicator detects the exhaustion of correction movements within a trend, thus giving entry points for new trades. Entry signals can be generated for both smaller timeframes (>M5) and larger ones (<H1). 3. OPERATION CONDITIONS Buy signal: When the Waterfall [thick line] is above the u

Tired of information overload when analyzing forex currency strength? Introducing "All Currency Strength Live", the ultimate dashboard indicator for MetaTrader 5 that simplifies your trading life. This innovative tool provides a clear, concise overview of the strength of all major currencies, empowering you to make informed trading decisions with ease. With "All Currency Strength Live," you gain access to real-time insights into both price and volume strength across all major currencies. No mor

Apresentamos o Volatility Doctor RSI, uma ferramenta inovadora construída com base no confiável indicador RSI, projetada para elevar sua experiência de negociação como nunca antes.
Nosso indicador não apenas fornece leituras em tempo real do RSI, mas também oferece uma previsão precisa de onde a leitura do RSI estará em 10 etapas no futuro em qualquer intervalo de tempo escolhido e qualquer símbolo de negociação preferido.
Inteligência Adaptativa: Esta ferramenta aprende e se ajusta a qual

BS Time Band是一个很好的波段交易指示器,这个指标可以单独使用,但是最好是配合 StartPoint 一起使用效果更好,适用于任何时间框架,非常适合喜欢做波段交易的朋友。它能很好的体现出一个波段的完整信息,你可以很快的从这个指示器上寻找到最佳的预警区域,然后配合 StartPoint 找到最佳的buy位置和最佳的sell位置,也能很好根据指示器去坚守自己的持仓定订单。指标不含有未来函数,不会重新绘制,不仅能够应用到自己的手动交易过程中,还能完全可以写入到自己的EA中。(如果你感觉到这个指标能够帮助你进行更准确的交易,请帮忙给个好评,希望我的作品能够帮助更多有需要的人) =================参考使用方法=================== 此指标可以适用于任何交易品种。 做波段建议参数 timeFame:M5 如果配合 StartPoint 建议 StartPoint 的参数为(240,60)
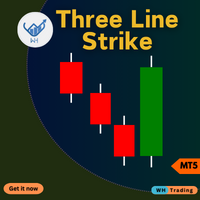
Indicador de greve de três linhas para MetaTrader 5 (MT5). Esta ferramenta avançada foi projetada para ajudá-lo a identificar possíveis reversões no mercado com precisão e facilidade.
Quer você seja um trader iniciante ou experiente, este indicador pode aprimorar suas decisões comerciais e maximizar seus lucros. Contact me after purchase for guidance Características principais: Sinais de reversão precisos : detecte possíveis reversões de tendência com base no padrão de ataque de três linha

Description of work
The 'MA7 Clover' indicator is based on candle shapes. Shows the 'Pin Bar' candle pattern. Detailed information about the 'MA7 Clover' indicator.
Indicator settings
General settings: Min body size ; Max body size ; Min nose size ; Max nose size .
Message settings: Send message to the terminal (Alert) – permission to send messages to the terminal using the Alert function; Send message to the mobile terminal (Push) – permission to send messages to the mobile terminal using
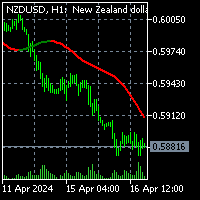
To download MT4 version please click here. - This is the exact conversion from TradingView: "Sentiment Range Ma" By "ChartPrime". - This is a non-repaint and light processing load indicator - You can message in private chat for further changes you need. - All input options are available. - Buffers are available for processing within EAs. - Highlight option is omitted as does not show good in Metatrader.

To download MT4 version please click here .
- This is the exact conversion from TradingView: " PA-Adaptive Hull Parabolic " By "Loxx".
- This is a non-repaint and light processing load indicator
- You can message in private chat for further changes you need.
- All input options are available.
- Buffers are available for processing within EAs.
- Highlight option is omitted as does not show good in Metatrader.

This DYJ PowerSignalSource is a complete trading system based on ATR technical indicators. This indicator will analyze and record the trend intensity of each cycle and current currency pair from M1-MN
DYJ PowerSignalSource creates a trend intensity and entry point signal list display by evaluating this data. When the trend percentage reaches 75% or greater, we consider it a strong currency. If the trend intensity percentage reaches 100%, we consider it the strongest, and a warning will pop up
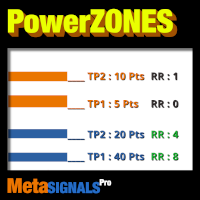
Zona estratégica tocada 3,4 ou 5 vezes que magnetizará o preço | TP1/TP2/TP3 em pontos ou valor de acordo com as PowerZONES | Verificar visualmente a segurança do seu rácio Risco/Recompensa Indicador não repintável e não atrasado | deal para trading manual e automatizado | adequado para todos os activos e todas as unidades de tempo Após a compra, por favor contacte-me neste canal para obter as definições recomendadas Versão MT4 Obter o nosso método completo com BladeSCALPER e T
Você quer ter sucesso no mercado Forex? Nosso inovador indicador AI Swing Trading é a sua chave secreta para negociações lucrativas e bem-sucedidas. Apresentamos a você esta ferramenta única:
Nosso indicador está equipado com uma rede neural integrada que permite analisar grandes quantidades de dados, identificar mudanças e prever movimentos de preços. Esta tecnologia permite que você tome decisões comerciais informadas com base em análises de mercado aprofundadas. O algoritmo do indicado

1. CONSTITUTION Salmon Momentum is an indicator consisting of two momentum oscillators (Waterfall and Salmon) and three dynamic bands (upper, middler and lower). 2. OPERATION CONDITIONS Buy signal: When the Waterfall [thick line] is above the upper band. Salmon [dotted line] crosses the upper band from the lower band. Sell signal: When the Waterfall [thick line] is below the lower band. Salmon [dotted line] crosses the lower band from the upper band. Use a trend filter, for example, EMA
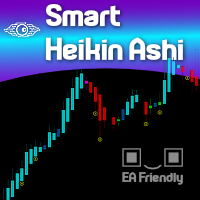
Os candlesticks Heikin Ashi suavizam os dados de preço para ajudar os traders a identificar tendências e padrões no mercado. Ao média os valores de preço, esses candlesticks fornecem uma representação visual mais clara, facilitando a identificação de tendências e a previsão de movimentos futuros sem o ruído dos candlesticks padrão. Nós, da Minions Labs, estamos revisitando este tópico por causa de nossos colegas Swing Trades, que adoram Heikin Ashi.
POR QUE EU DEVERIA ME IMPORTAR com o Smart
Welcome to the next level of trading sophistication with the Bollinger Bands Scanner for MT5! Elevate your trading experience and unlock enhanced insights and efficiency with our powerful MT5 indicator. Key Features: Effortless Bollinger Bands Scanning: Seamlessly harness the power of the Bollinger Bands Scanner to scan multiple assets effortlessly. Receive instant alerts when specific Bollinger Bands conditions are met, ensuring you're always ahead of market movements. Comprehensive Dashboard I
O indicador RSI Pro Analyzer é uma ferramenta poderosa projetada para traders que buscam tomar decisões informadas em vários intervalos de tempo simultaneamente. Este indicador utiliza o RSI para fornecer sinais de sobrecompra, sobrevenda e tendência , facilitando a identificação de oportunidades de entrada no mercado. Sua principal vantagem é a facilidade de leitura graças aos códigos de cores claros e distintos para indicar as diferentes condições do mercado.
O indicador exibe valores RSI e

Introducing the 'No Nonsense Reversal Megaprofits' indicator for MetaTrader 5 (MT5), your ultimate tool for identifying trend reversals with precision and confidence. This powerful indicator is designed to cut through the noise of the markets and pinpoint crucial turning points with ease. Powered by advanced algorithms, 'No Nonsense Reversal Megaprofits' analyzes price action and key market dynamics to accurately detect when a trend is about to reverse. Whether you're a novice trader or a season
Savia Forex Pro Indicator (MT5) The Savia Forex Solutions Forex Pro Indicator gives you highly accurate entries on all Forex/Currency pairs, Indices and Cryptocurrencies. The Forex Pro Indicator is dynamic and powerful and is optimized for all timeframes and ALL Currency pairs, Indices, Commodities, and Cryptocurrency pairs. Trade with improved confidence and maximize your success rate. Benefits Dynamic and Powerful. Forex Pro Indicator is fully optimized for all chart timeframes. Forex Pro Indi

Boom and Crash Pro Indicator The Savia Forex Solutions Boom and Crash Pro Indicator gives you highly accurate entries on all Boom and Crash Indices. The Boom and Crash Pro Indicator is dynamic and powerful and is optimized for all timeframes. Trade with improved confidence and maximize your success rate. Benefits Dynamic and Powerful. Boom and Crash Pro Indicator is fully optimized for all chart timeframes. Whether price action is an uptrend, downtrend or trading sideways, Boom and Crash Pro Ind
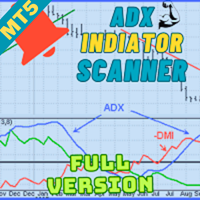
Welcome to advanced trading with the ADX Multicurrency Scanner for MT5! Elevate your trading experience with our powerful MT5 indicator, meticulously designed to offer seamless currency scanning and real-time insights. Key Features: Effortless Multicurrency Scanning: Unlock the full potential of the ADX Multicurrency Scanner for MT5 by effortlessly scanning multiple currencies. Receive instant alerts when specific conditions are met, ensuring you stay ahead of the market and capitalize on every
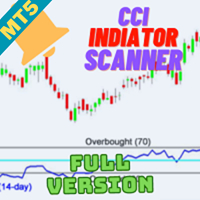
Welcome to the world of advanced trading with the CCI Multicurrency Scanner for MT5! Elevate your trading experience with our powerful MT5 indicator meticulously designed for seamless analysis and real-time insights. Key Features: Effortless CCI Scanning: Unlock the full potential of the CCI Multicurrency Scanner for MT5 by effortlessly scanning multiple currency pairs. Receive instant alerts when specific Commodity Channel Index (CCI) conditions are met, ensuring you stay ahead of market moveme

The DYJ StochasticSignalSource is displayed as two lines. The main line is called %K. The second line, called %D, is a Moving Average of %K. The %K line is usually displayed as a solid line and the %D line is usually displayed as a dotted line. There are several ways to interpret a Stochastic Oscillator. four popular methods include: Buy when the Oscillator (either %K or %D) falls below a specific level (for example, 20) . Sell when the Oscillator rises above a specific level (for example, 80)
O mercado MetaTrader é um espaço, sem precedentes, para negociar robôs e indicadores técnicos.
Leia o artigo Manual do usuário da MQL5.community para saber mais sobre os serviços exclusivos que oferecemos aos traders: cópia de sinais de negociação, aplicativos personalizados desenvolvidos por freelances, pagamentos automáticos através de sistema de pagamento e a rede em nuvem MQL5.
Você está perdendo oportunidades de negociação:
- Aplicativos de negociação gratuitos
- 8 000+ sinais para cópia
- Notícias econômicas para análise dos mercados financeiros
Registro
Login
Se você não tem uma conta, por favor registre-se
Para login e uso do site MQL5.com, você deve ativar o uso de cookies.
Ative esta opção no seu navegador, caso contrário você não poderá fazer login.