Conheça o Mercado MQL5 no YouTube, assista aos vídeos tutoriais
Como comprar um robô de negociação ou indicador?
Execute seu EA na
hospedagem virtual
hospedagem virtual
Teste indicadores/robôs de negociação antes de comprá-los
Quer ganhar dinheiro no Mercado?
Como apresentar um produto para o consumidor final?
Pagamento de Indicadores Técnicos para MetaTrader 4 - 60

The indicator displays the most important Price Action Patterns that indicate a potential reversal / continuation of the trend. My #1 Utility : includes 65+ functions | Contact me if you have any questions Avaliable Patterns: Pin bar; Engulfing; Inside bar (Harami); Morning star; Evening star; Dark Cloud Cover; Piercing Line; Features: You can select patterns to display and disable unnecessary patterns; Notifications : alerts in the terminal, Email and Push-notifications (to the mobil

The indicator displays the levels that are extremes for the specified time frames. Resistance level is the maximum price of the last closed bar; Support level is the minimum price of the last closed bar; My #1 Utility : includes 65+ functions | Contact me if you have any questions 2 operating modes: Real bodies: Open and Close prices will be used; Extremes: High and Low prices will be used;
This indicator: Helps to see potential reversal levels; Patterns formed near the levels have mo
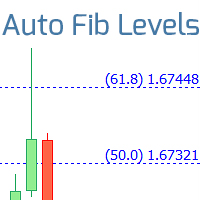
Automatically draws Fibonacci levels, basen on the last closed bar of the specified time frame. My #1 Utility : includes 65+ functions | Contact me if you have any questions helps to see potential reversal levels; patterns formed near the levels have more potential; significantly saves time spent on manual level plotting; Adjustable parameters:
The time frame used to plot the levels; Personalization of Fibonacci levels: main correction levels + extension levels; Line color, line width an

This may just look like another indicator for identifying and displaying supply and demand, but dig-in further and you will discover it has much more to offer. In addition to the complete flexibility for displaying zones, consider the identification of recent support or resistance, the back-testing capability to help you learn how to identify the best supply and demand zones to trader from, the continuously updated trend information for all time frames, times from around the world displayed on

FBO Impact is a professional yet simple to use trend following system. It detects the prevailing trend and gives entry points after pullbacks to significant price levels. To determine the trend it uses a unique filtering algorithm. Suitable for defining entry points for scalping as well as for intra-day trading. Features Works with the prevailing market trend. Suitable for all currency pairs. Ideal for all time frames but higher time frames are recommended. Does not redraw/repaint the arrows on

Finds bars that exceed the specified size
My #1 Utility : includes 65+ functions | Contact me if you have any questions 2 operating modes: Real body: the difference between the open and close prices will be used; Extremes: the difference between the maximum and minimum prices will be used;
This Indicator: Convenient for filter patterns in a period of low volatility; Indicates the beginning of a trend ; Helps to see the most significant bars ; Can be used when trading

Shows the direction of the bars on all major timeframes. My #1 Utility : 65+ functions | Version for MT5
The meaning of the visual signals ( squares):
Red : Close price is lower than the Open price: Close < Open; Green : Close price is higher than the Open price: Close > Open; Blue : Close price is equal to the Open price: Close = Open; You can set the Shift of the calculated bar, relative to the current bar: Shift = 0: the direction of the currenttly open (floating) bars, Shift

The falcon indicator works based on the innovative falcon strategy before me, as I used special numbers for the Moving Release indicator and the Bollinger Band, in addition to many indicators for filtering the signal, some numbers from the Nine Square and the Fibonacci numbers, where the results were impressive. We also have a free version for a month in the video description on Youtube download link Thanks

Trading is a trade war So traders are warriors. A warrior needs a weapon.
The Binary Galaxy A1 is a powerful weapon. Extremely accurate This tool can be customized as you like.
Who deserves such an accurate weapon? 1. People who want profits From binary options trading 2. Those who want to trade short, profit fast 3. People who want long-term can do it. 4. Beginners can use it. 5. Old hand works very well.
How it works It works very easy. For binary options Time frame M1 or M5 and expires

Trading is a trade war So traders are warriors. A warrior needs a weapon.
The Scalping One Plus A1 is a powerful weapon. Extremely accurate This tool can be customized as you like.
Who deserves such an accurate weapon? 1. People who want profits From binary options trading 2. Those who want to trade short, profit fast 3. People who want long-term can do it. 4. Beginners can use it. 5. Old hand works very well.
How it works It works very easy. For binary options Time frame M1 or M5 and exp
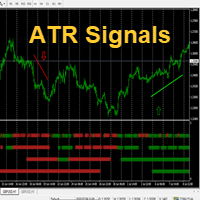
Hello This Indicator will draw Green (Up) and Red (Down) small arrows from Multi TimeFrames based in ( Average True Range ) to help you to take decision to buy or sell or waiting If there 4 green arrows in same vertical line that's mean (Up) and If there 4 Red arrows in same vertical line that's mean (Down) and the options contain (Alert and Mobile , Mail Notifications). Please watch our video for more details https://youtu.be/MVzDbFYPw1M and these is EA for it https://www.mql5.com/en/market/pr

The Dragon Trend indicator displays information in a visual form. The intelligent algorithm of the Dragon Trend indicator determines the trend with sufficient accuracy, filters out market noise and generates input signals.
One of the most beloved trends in price chart analysis is the use of chart analysis. The state of the market, the phase of its movement largely determines the success of the trader and the strategy he has chosen. The indicator uses color signaling: blue - when changing from

The key difference between the Trend Channel Generator indicator and other channel indicators is that the Trend Channel Generator takes into account not simple moving averages, but twice smoothed ones, which, on the one hand, makes it possible to more clearly determine the market movement, and on the other hand, makes the indicator less sensitive. Trend Channel Generator is a non-redrawing channel indicator based on moving averages.
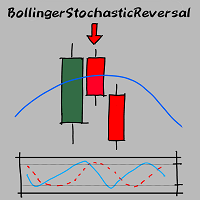
Hello Guys! I want to share with you a very simple but very effective indicator, which I use a lot in my daily trading. Bollinger bands are one of the most effective tools in trading, especially for those who like to operate on low time frames and prefer fast operations.
The indicator detects fast reversals: when the price close above or below the Bollinger Bands, but then re-enters in the Bands on the next candle, the indicator sends a signal and draws an arrow on the newly opened candle! It

Victory Price Direction I'm glad to present you my new indicator. This indicator includes all the best strategies that I have researched. When developing and optimizing, I used ML algorithms. The indicator is very easy to use.
Now the indicator has 3 basic strategies and the ability to customize your own strategy. I am constantly looking for better strategies.
You get: A simple and effective indicator of reversals. The indicator will help you place Take Profit correctly.

This indicator is an indicator that detects whether or not each moving average line is currently in the perfect order state. A perfect order is a state in which there are three moving averages on the FX chart, one for each of the short-term, medium-term, and long-term, lined up in the same direction in order to create a trend. The steeper the slope, the stronger the trend and the longer it tends to last. Many traders are aware of this perfect order. Perfect orders include uptrend perfect orders
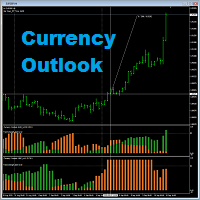
Currency Outlook is an indicator that can help us "Trade the right pair in the right direction and at the right time". This indicator analyzes prices of all cross currency pairs of the selected currency and report the result to us in form of double colours histogram diagram. The maximum height of the histogram diagram of the indicator is 100. The indicator is exclusively programming for AUD, CAD, CHF, EUR, GBP, JPY, NZD and USD. It can work in any timeframe in MT4. A feature for calculating trad
All moving averages in one indicator
Have you ever wanted an indicator which contains all types of moving averages and show you when they cross? And at the same time works on all timeframes and it's very simple to configure? Well, now it's your chance to have it , because I am very glad to bring you another of my best creations : ALL in one MA indicator
This indicator is the base indicator used for this strategy. https://www.mql5.com/en/market/product/54168#!tab=overview
Features

双均线报警,全中文参数,方便使用 -------------------------------------------------------------------------------------------------------------- 你可以在这里联系我 https://www.mql5.com/zh/users/chaoping0326 可以承接MT4,MT5的指标,EA定制 长期从事编程项目(MT4从2012年,MT5从2016年), 有很好的编程能力,参数设置合理,能很好地理解客户的要求。 请联系我,根据你的要求进行报价。 我对程序的逻辑负责,如果程序有问题,我可以免费修复,如果我不能修复,我可以全额退款。 增加和调整逻辑需要额外收费。 免费提供全英文或中文源代码。
The five guardians
This indicator is a combination of the next indicators, each with their own settings. CCI MACD ADX DMI STOCHASTIC
When all five of them align with the same movement we get a green color which represents the buy movement , and contrary we have a red color which represents a sell movement. If its gray, its undecided, and we have to wait until a better signal will appear.
Logo made by https://www.fiverr.com/aleksa19

The indicator of the indicators. The Most Powerful Technique to Determine Forex Trend Strength in 2023. We have perfected Supreme Commander that it calculates an average of the selected indicators (up to 16) and the selected timeframe (all) with the result of a single trend that indicates the potential of buying and selling. It includes the following indicators:
Accelerator/Decelerator oscillator Average Directional Movement Index Awesome oscillator; Bulls and Bears Commodity Channel Index; D
Features Beginner friendly tools that incorporates one of the most useful indicators into simple and efficient strategy. This oscillator merges MA of RSI and parabolic SAR based on MACD values. Compared to standard parabolic SAR you'll see it is smoother and it seems likely to identify better significant price breaks. You will also have histogram that shows price bias and to assist with making trading decisions based on alignment.
Market to run
It can be adapted to all type of trading style
Features A n indicator will be given if we have a break on high volume.
Up Arrow
Volume> Average_Volume * Multiplier
Price> Highest Price for Last N candle, plus set, Pip / Percentage Value
Down Arrow
Volume> Average_Volume * Multiplier
Price <Lowest Price for Last N candle, minus set, Pip / Percentage Value
Market to run
It can be adapted to all type of trading styles such as scalping, day trading or swing. It doesn't matter if its forex, stock , crypto and so on. It can be ad
DMI ADX Histogram Oscillator I present you one of the most precise and powerful indicator Its made of DMI Histogram together with ADX Oscillator. It has inside arrow to show a buy or sell setup.
Features The way it works its the next one : the histogram is a difference between DMI+ and DMI-. At the same time together we have the oscillator ADX for
Market to run
It can be adapted to all type of trading styles such as scalping, day trading or swing. It doesn't matter if its forex, st
The indicator is designed for trading binary options on small timeframes up to 15 m Easy to use does not need additional settings and can be used without additional filters Recommendations for trading When a signal appears (blue arrows pointing up), you need to consider the buy direction When a signal appears (the red line indicates the bottom), you need to consider the direction to sell To conclude a deal is on the candle where the signal for one candle came, if the signal turned out to be unpr

KDJ指标,从国内代码中转译而来,带有J线 -------------------------------------------------------------------------------------------------------------- 你可以在这里联系我 https://www.mql5.com/zh/users/chaoping0326 可以承接MT4,MT5的指标,EA定制 长期从事编程项目(MT4从2012年,MT5从2016年), 有很好的编程能力,参数设置合理,能很好地理解客户的要求。 请联系我,根据你的要求进行报价。 我对程序的逻辑负责,如果程序有问题,我可以免费修复,如果我不能修复,我可以全额退款。 增加和调整逻辑需要额外收费。 免费提供全英文或中文源代码。

双线MACD -------------------------------------------------------------------------------------------------------------- 你可以在这里联系我 https://www.mql5.com/zh/users/chaoping0326 可以承接MT4,MT5的指标,EA定制 长期从事编程项目(MT4从2012年,MT5从2016年), 有很好的编程能力,参数设置合理,能很好地理解客户的要求。 请联系我,根据你的要求进行报价。 我对程序的逻辑负责,如果程序有问题,我可以免费修复,如果我不能修复,我可以全额退款。 增加和调整逻辑需要额外收费。 免费提供全英文或中文源代码。

Escalpelador de Tendências Diárias (DTS) Este indicador faz parte dos sistemas RPTrade Pro Solutions.
DTS é um indicador de tendência diária usando Price Action, Dynamic Support e Resistances. Ele foi projetado para ser usado por qualquer pessoa, mesmo o iniciante absoluto na negociação pode usá-lo. NUNCA repinta. As indicações são dadas de perto para perto. Projetado para ser usado sozinho, nenhum outro indicador é necessário. Dá-lhe a tendência e potencial Take Profit no início do dia.
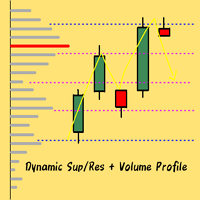
!!!REVISION 3 OF THE INDICATOR HAS BEEN RELEASED! IF YOU WANT TO TRY THE INDICATOR FOR 1 MONTH FOR FREE JUST WRITE ME NOW!!!
DYNAMIC LEVELS + VOLUME PROFILE + REGRESSION CHANNEL Hello Guys! Revision 3 of the indicator has been released! The indicator plots SUPPORTS AND RESISTANCES DYNAMICALLY on the chart, identifying different levels of interest based on the price action. Every trader knows that indicators are important, but they often provide the signal "with a candle of delay", therefore wh
Это стрелочный индикатор. Он выбирает данные от 23-х стандартных индикаторов и расчитывает уровень сигнала который показывает предполагаемое движение цены инструмента торговли. Минимальный уровень сигнала индикатора установлен в пределах -100 до +100%. Используйте усреднение для формирования сигнала.
Как работать с индикаторам.
Следим за сигналом и принимаем решения. Индикатор перерисовывается только на нулевой свечи, поэтому решения принимаются после закрытия свечи с новым сигналом, и сигн
Это линейный индикатор. Он выбирает данные от 23-х стандартных индикаторов и рассчитывает уровень сигнала, который показывает предполагаемое движение цены инструмента торговли. Минимальный уровень сигнала индикатора установлен в пределах -100 до +100%. Используйте усреднение для формирования сигнала.
Как работать с индикаторам.
Следим за сигналом и принимаем решения. При пересечении нулевого уровня индикатора снизу вверх можно рассматривать покупки. При пересечении нулевого уровня сверху
Это индикатор гистограмма. Он выбирает данные от 23-х стандартных индикаторов и расчитывает уровень сигнала который показывает предполагаемое движение цены инструмента торговли. Минимальный уровень сигнала индикатора установлен в пределах -100 до +100%. Используйте усреднение для формирования сигнала.
Как работать с индикаторам.
Следим за сигналом и принимаем решения, цвета гистограммы показывают когда возможны покупки а когда продажи, или нейтральный цвет - сделать паузу. Индикатор перерис

Stochastic force is an advanced version of the stochastic oscillator. Instead of using the regular price a more efficient price data is provided as an input for the oscillator which takes into account the price efficiency, volume and market noise. Also price is pre-filtered with the selected average type and then post-filtered by a hull moving average which provides a smooth transition of the oscillator. It eliminates maximum false signals and has the potential to become an integral part of any

Trend Harvester is yet another trend indicator with flat detection. It uses price series and Moving Average for detecting market trend.
For better result I would recomend to play with parameters.
Lower periods will force to react to short trends.
Higher periods will try to show longer trands.
You can set the same period for Price Series and Moving Average for quick test.
You can also choose Moving Average type between "Regular" and "Zero Lag".
"Zero Lag" type improves reaction to trend ch

VertexFilter - это индикатор соединивший в себе классический zig zag и осциллятор. Принцип действия следующий: когда регистрируется новый максимум или минимум, это делается с помощью индикатора zig zag, индикатор ждет смены направления движения цены, это делается с помощью осциллятора, в такие моменты появляются сигналы на покупку и продажу. Таким образом индикатор подает сигналы когда цена меняет направление движения вблизи экстремумов. Это позволяет отфильтровать ложные сигналы. Индикатор имее
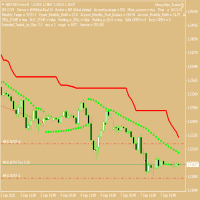
ATR Stops Attach to chart of any timescale Length = 10 ATR period = 9 kv = 6 I use this set up on a one hour chart, basically the blue line indicates an upward trend while the red line indicates a downward trend All setting can be used on any chart period, If you don't like the settings I use then just play around with the settings on any chosen time period until you find a setup which suites your trading style
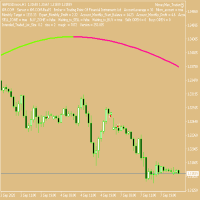
MA with Trend colour Attach to chart of any timescale MA period = 200 buffer = 1 I use this set up on a one hour chart, basically the green line indicates an upward trend while the red line indicates a downward trend All setting can be used on any chart period, If you don't like the settings I use, then just play around with the settings on any chosen time period until you find a setup which suites your trading style

O indicador permite determinar instantaneamente a tendência atual por cor e níveis de Fibonacci. O painel HTF mostra a tendência atual de períodos mais altos, ajudando a determinar a força da tendência. Negocie na tendência ao mudar a cor das velas ou negocie contra a tendência quando o preço rompe os níveis extremos do indicador FIBO Trend PRO Benefícios do FIBO Trend PRO: O indicador nunca repinta ou altera seus valores Muito fácil de usar e intuitivo Aplicável a qualquer símbolo: FX-moedas, a

The indicator allows you to trade binary options. The recommended time frame is М5 and the expiration time is 5 minutes. The indicator suitable for auto and manual trading. A possible signal is specified as a arrows above/under a candle. You should wait until the candle closes and entry the trade at new candle Arrows are not re-painted Trade sessions: Any Currency pairs: ( recommended) AUD/CAD Working time frame: M5 Expiration time: 5,10,15 minute Up buffer: 1, down buffer: 0 *** Use with bro

The indicator allows you to trade binary options. The recommended time frame is М5 and the expiration time is 5 minutes. The indicator suitable for auto and manual trading. A possible signal is specified as a arrows above/under a candle. You should wait until the candle closes and entry the trade at new candle Arrows are not re-painted Trade sessions: Any Currency pairs: ( recommended) EUR/AUD Working time frame: M5 Expiration time: 5,10,15 minute Up buffer: 1, down buffer: 0 *** Use with brok

The indicator allows you to trade binary options. The recommended time frame is М5 and the expiration time is 5 minutes. The indicator suitable for auto and manual trading. A possible signal is specified as a arrows above/under a candle. You should wait until the candle closes and entry the trade at new candle Arrows are not re-painted Trade sessions: Any Currency pairs: ( recommended) AUD/NZD Working time frame: M5 Expiration time: 5,10,15 minute Up buffer: 1, down buffer: 0 *** Use with brok
It is a judgment tool that judges trends in 1 minute and supports discretionary trading.
Various usages 1. It is used to recognize the environmental advantage of buying or selling with the color of the line. If the line is red, it is advantageous to buy. If it is blue, it is advantageous to sell. Neither if there is no line. 2. Used as a guide for entry by signing the entry. Red arrow long Blue arrow short 3.Used as a guide for closing (Even if there is no entry sign, the close point will be

This indicator is intended for professionals assessing fundamental market trends. This indicator calculates the index of any instrument and analyzes it. The index of the state currency shows the real purchasing power of this currency, and the dynamics of this index shows the dynamics of the economic state of the corresponding state. An analysis of the indices of both currencies included in a currency pair makes it much more reliable to identify the trend of this cur

EnkiSoft TrendWatch Indicator with Pips counter
Product blog page
Last version 1.63 (2021.06.27) With TrendWatch Indicator you will be able to identify trends on any symbol and any timeframe. Choose the easy way, use TrendWatch indicator, and find your settings on your favourite chart. The embedded pips counter helps you to find the best settings, that differ almost on every pair and timeframe. I will provide you some settings, so you can begin profitable trading. With many setting, y

Bearish/Bullish divergent bar . One of the signals of the "Trade Chaos" system of Bill Williams. (First wiseman)
When bar moving away from the "Alligator" indicator and there is divergence on the Awesome Oscillator indicator, it shows a potential point of movement change.
It is based on the opening/closing of the bar, the position relative to the previous ones, the Alligator and AO.
When trading, the entrance is at the breakthrough of the bar(short trade - low of bar, long trade high of bar)
The strategy works on the ECN account (5min and more)
Inside bar : with the direction of movement average 200 (you can change 200 it if you want). when the price is on the MA the indicator only gives the buy sign, and the opposite if the price is below the MA 1 Buy: The indicator draws a blue line, when a candle closes above that line and the price reverses towards the line, Buy from that blue line. Put the stop on the red line and the take profit on the yellow line TP1, or green line TP2
ATR on Chart has been made for anyone wants to easily analyze ATR from Price Chart. It will show ATR rang and you can apply with each bar or MA .
When price touches the line it means it is trending to that side .
Please be aware that this indicator DOES NOT point out the momentum of trending. I r ecommend to use this indicator to find : https://www.mql5.com/en/market/product/55009
Input d escription : ATRperiod = Setting of ATR period. ATRmulti = Multiply value from ATRperiod . Mode =

Indicator with the function of catching trees should Engulfing Pattern of all time frames 1. Engulfing identification indicator for multi timeframe. 2. Function backtest of Engulfing candlestick patterns 3. Announcements on MT4 and on mobile phones Please watch my movie on youtube for instructions. Subscribe my channel for free indicator. Thanks for your https://youtu.be/_Dg99o6I_m4

the indicator will show signal arrows on the graph at the crossing of a given level it has push and audible alerts. By crossing from low to high level 0.3, a blue arrow will come out for the purchase, at the same time an audible signal will sound. By crossing from low to high level 0.7, a red arrow will come out for the sale, at the same time an audible signal will sound. Possibility to deactivate push and audible alerts.
MT5 version : https://www.mql5.com/en/market/product/51968

The indicator allows you to trade binary options. The recommended time frame is М5 and the expiration time is 5 minutes. The indicator suitable for auto and manual trading. A possible signal is specified as a arrows above/under a candle. You should wait until the candle closes and entry the trade at new candle Arrows are not re-painted Trade sessions: Any Currency pairs: ( recommended) EUR/CAD Working time frame: M5 Expiration time: 5,10,15 minute Up buffer: 1, down buffer: 0 *** Use with brok

This indicator Super XT indicator.Indicator displays trend movement. Indicator calculates automatically line. Features
FiltPer - displays indicator period. Window - displays indicator trend (true/false).
Trend - displays indicator trend (true/false).
X - move the trend left and right. Y - move the trend up and down.
How to understand the status: If the Trend color is green, trend is up.
If the Trend color is red, trend is down.
///////////////////////////////////////////////

Mr Pip Trend indicator combines powerful price action analysis and sophisticated algorithmic data analysis to provide traders with high-accuracy chart analysis and support the decision-making process. You can use Mr Pip Trend Indicator to trade all the markets (all Forex pairs, all CFDs and Cryptocurrencies) on all timeframes! Mr Pip Trend Indicator provides chart analysis that is effective at detecting new trends but finds the exact sweet-spot between early and late entries. What is different
Nice Day! - A moving average candle indicates a high and low turn trend.
- MA_vonal_vastagsaga: MA_line_thickness. - MA_vonal_szine: MA_line_color. - MA_vonal_szine_long: MA_line_color_long. - MA_vonal_szine_short: MA_line_color_short. - mql5.com can also be used for my robots. Szép Napot! - Mozgó átlag gyertyájának magas (High) és alacsony (Low) fordulos trend jelzése. - mql5.com robotjaimhoz is használható.

What you can do with CandleStick CandleStick is a useful indicator for doing MTF analysis. This indicator displays the CandleStick of another time frame on the chart . By understanding the information in multiple time charts at the same time, it is easier to understand the overall market view. It is also a useful tool for validating and studying past quotes and trades. There are similar products made by others, but I designed and developed it so that it is easy for me to use.
Features of Candl

Indicator developed with precision algorithm that seeks moments of strong trend in the markets. Reconciled with an algorithm that seeks high volume moments in the market. I recommend using timeframes M15 to H1. I also recommend an optimization to your liking for your best currency pairs. Any questions, do not hesitate to ask. Buy EA based on this indicator CLICKING HERE This is an excellent trigger indicator for your trading system. If you already operate a trend and want an indicator to show y

Displays the appearance of a gap on the chart (when the closing price of the previous bar differs from the opening price of the new bar). My #1 Utility: includes 65+ functions | Contact me if you have any questions In the initial settings you can configure: The size of the gap (in points): only gaps that exceed this value will be displayed. Arrow color : separate for up and down gaps. When you hover the mouse over the gap arrows on the chart, their size will be displayed ; I recommend ch

The indicator allows you to trade binary options. The recommended time frame is М5 and the expiration time is 5 minutes. The indicator suitable for auto and manual trading. A possible signal is specified as a arrows above/under a candle. You should wait until the candle closes and entry the trade at new candle Arrows are not re-painted Trade sessions: Any Currency pairs: ( recommended) EUR/NZD Working time frame: M5 Expiration time: 5,10,15 minute Up buffer: 1, down buffer: 0 *** Use with b

We know for sure that The Fibonacci sequence is a science used to calculate or estimate target distances.
How does this indicator work? 1. Tell the spread status 2. Tell me the current price 3. Indicate whether the candlestick status is bullish or bearish on each time frame. 4. Indicates the status of the past 2 candles 5. Tell Pivot Point 6. Tell the Fibonacci sequence. 7.The Fibonacci measurement can be set. 8. Pivot can be set backward. 9. Look at support and resistance.
Suitable for 1.

TorN ( Trend or Not ) has been made from ADX problem on fixed level. Only fixed level is hard to find trending or not. Now I find the better method to analyze ADX with MA . You can use this signal to confirm your trending strategy. (Or use it to find Sideway)
The best signal is signal line get higher than MA line and fixed level. ( Recommend to use level value same as ADX period or higher ) If signal line lower than MA line on Any level is mean weakening trend.
Please be aware that t

This type of arrow indicator works without redrawing signals. The signal on the indicator is shown as arrows (in the direction of movement). It is very simple and effective to use in the Forex market. Type of trading: "Scalping" It is applicable and performs well in intraday trading, as well as long-term trading. Сигнал на индикаторе показан в виде стрелок ( по направлению движения).
Очень прост и эффективен в применении на рынке Форекс.
Вид торговли: " Скальпинг"
Применим и хорошо себя
The Icarus Signals Continuation(TM) Indicator is a simple, but highly effective tool for identifying strong price trends, both long and short, across all time-frames and instrument types. The Icarus Continuation Indicator allows users to plot individual markers for each bar, when price has extended into a high-probability trend area, after a set level of extension. The Continuation Indicator allows users to fully optimise each of the unique Icarus settings to best fit a particular trading s

The Knowledge of which Geometry aims is the knowledge of the Eternal - Plato Quant Stress Scanner is a Scientifically developed Stress detection algorithm along the geometrical lines on the price data which are quantified into Stress repulsion, fractures and clusters in a easily understandable signal form. Each signal are displayed in well-arranged with currency pairs in row-wise and timeframes in column-wise manner. Explanation of signal and plotting stress levels with trendlines are shown in

Description
Range Detector is an indicator that identifies impulses in the market and displays their slope angles on the chart.
Recommendations
You can use this indicator to determine a trend and, accordingly, to determine the direction of opening a position or closing an opposite position.
Parameters
===== _INDICATOR_SETTINGS_ ===== - indicator settings
Maximum History Bars - maximum number of history bars for calculating the indicator. Average True Range Period - ATR indic

This is an alert for when price is above the 200 ema, macd is below its zero line and the slow ma crosses above the fast ma and vice versa for sells. It has been tested 100 times as seen on youtube and has a 65% win rate on the 30 minute time frame.
I've attached a video to explain how to use it. Under the vuideo is a link to Trading Rush video where he tests the strategy 100 times on 30 minute.
(1) INDICATOR PARAMETERS
MA Period . Default is 200 MA Type . Defaul

Market Calculator is a powerful tool that allows you to easily and quickly calculate the main parameters of a trade: Lot size, StopLoss and TakeProfit, as well as estimate the amount of funds (required Margin) to open a position. The program has a very convenient and intuitive control, because implemented in OS Windows style. There are many interesting and handy features - just watch the video: youtu.be/FG2qqTJTIhE All program data are sorted into sections in the form of tabs: " Lot Calculator "

The original BoomTroom trend indicator. With this indicator, you do not need to sit near the computer and wait for the inflection point to appear day and night.
How important it is to determine the trend in the stock market or the Forex market! Still not sure how to determine the inflection point of a trend? Are you still worried about how to draw short-term and long-term trend lines? Run this smart utility. You will see pivot points of varying strength, as well as long-term and short-term tr

The Unique Trend indicator tracks market trends, ignoring sharp fluctuations and market noise. The indicator is suitable for trading on small timeframes because it ignores sudden price jumps or price corrections due to the reduction of market noise around the average price.
The scan at minima and maxima forms the internal boundaries (channel) when calculating the indicator signals. The channel allows you to remove market noise. iMA and iATR are used to generate signals using the author's algo

Implementation of indication of trend movement with moments for potential stops in the Cloud Power indicator.
The transition to the shadow warns of a possible reversal. The entry of the price inside the shadow speaks of a flat movement. The indicator tracks the market trend with unmatched reliability, ignoring sharp market fluctuations and noise around the average price. Simple, visual and efficient use. The indicator does not redraw and does not lag.
It can be easily used as an independent

The Forex market can go through many different price paths to reach a point in the future. The future is dynamic. Therefore, planning a trade with a possible future scenario is an essential step for your success. For these purposes, we present to your attention Trend Units.
A unique author's strategy that simultaneously determines the strength of trends and points of entry into the market, visualizing it using arrows on the chart. The indicator is optimally adapted for trading on time periods
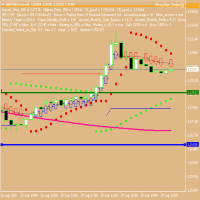
My Trend Finder
//**************************** FREE signal that uses all three of my indicators feel free to copy see link below https://www.mql5.com/en/signals/1318509?source=Site +Signals+My //**************************** period is the only setting basically number of bars on your chosen timeframe, Attach to chart of any timescale Period in bars = 7 which is a short monitoring period, 100 would be longer monitoring I use this set up on a one hour chart, basically No arrow means not s
Saiba como comprar um robô de negociação na AppStore do MetaTrader, a loja de aplicativos para a plataforma MetaTrader.
O Sistema de Pagamento MQL5.community permite transações através WebMoney, PayPay, ePayments e sistemas de pagamento populares. Nós recomendamos que você teste o robô de negociação antes de comprá-lo para uma melhor experiência como cliente.
Você está perdendo oportunidades de negociação:
- Aplicativos de negociação gratuitos
- 8 000+ sinais para cópia
- Notícias econômicas para análise dos mercados financeiros
Registro
Login
Se você não tem uma conta, por favor registre-se
Para login e uso do site MQL5.com, você deve ativar o uso de cookies.
Ative esta opção no seu navegador, caso contrário você não poderá fazer login.