Conheça o Mercado MQL5 no YouTube, assista aos vídeos tutoriais
Como comprar um robô de negociação ou indicador?
Execute seu EA na
hospedagem virtual
hospedagem virtual
Teste indicadores/robôs de negociação antes de comprá-los
Quer ganhar dinheiro no Mercado?
Como apresentar um produto para o consumidor final?
Pagamento de Indicadores Técnicos para MetaTrader 4 - 59

The indicator scans for stop grabber (special pattern of Joe Dinapoli which gives very high probability buy / sell signals and does not repaint ) signals in multiple timeframes for the all markets filtered and shows the results on Dashboard.
Key Features Dashboard can be used for all markets It can scan for stop grabber pattern on MN1, W1, D1, H4, H1, M30, M15 ,M5, M1 timeframes Parameters UseMarketWatch: Set true to copy all symbols available in market watch MarketWatchCount : Set the numbe

The Squat is a function of the range of a given price bar and the volume, or TIC volume, that occurs while that range is being created. The basic idea is that high volume and little price movement indicate substantial support or resistance. The idea behind the approach to this indicator is to first look for likely Fibonacci support and resistance and then see if Squat manifests when that point is reached. The indicator determines one of the high probability patterns of DiNapoli. It does not re
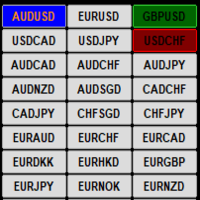
This indicator display current profit/loss status for each pair visually on a single chart. If the current open chart pair is selected and a trade/s are opened for that pair only the Symbol name is highlighted and the button color reflects the current trade/s status if the selected chart pair does not have any open trades then the button color is Blue. The input options are :
1/ Select Pairs automatically from the Market Watch
2/ Manually select your own Pairs
3/ Select all MT4 Timeframes

The indicator monitors the MACD trend in multiple timeframes for a specific market. No more shifting in between charts to check the trend direction while trading.
Key Features Indicator can be used for all markets Monitors every timeframe, from M1 to MN Able to move display label on chart by single click
Indicator Usage The dashboard appears to the left and upper part of the chart when attached. The shell encapsulating a timeframe goes red on a down trend, green on an up trend. If the defaul

The indicator monitors the Dinapoli MACD trend in multiple timeframes for the all markets filtered and shows the results on Dashboard.
Key Features Indicator can be used for all markets Monitors every timeframe, from 1 Min to Monthly
Parameters
UseMarketWatch: Set true to copy all symbols available in market watch MarketWatchCount : Set the number of symbols that you want to copy from the market watch list. CustomSymbols: Enter the custom symbols that you want to be available in dashboard.

The Vkids Trend indicator displays the trend direction with colored bars, works in a simple and visual way. It uses a combination of reliable and simple indicators for price analysis. The graph is presented in the form of blue and red histograms. Red bars indicate a buy signal, blue bars - a sell signal. The graph is not redrawn during operation.
The signals of the Vkids Trend indicator can be interpreted as follows: Buy when the bars are blue and sell when they are red. The advantage of the

The Dawn Trend indicator is not prone to redrawing or any other type of erroneous display. Sharp price fluctuations, as well as noise around average prices, are ignored.
Perhaps, trend indicators can be called the main ones, since classic trading involves looking for trends. Many classics of trading in financial markets have developed their systems specifically to search for market trends.
This indicator embodies the implementation of a trend indicator. Which fixes a certain direction of ch

Price Action Sniper is designed to trade the Price Action on the desired chart time frame. - Trend Reversals. - Trend Continuation. - Brekaouts. - Good tool for Binary Options
Price action forms the basis for all technical analysis of a currency pair, commodity or other asset chart. Many short-term traders rely exclusively on price action and the formations and trends extrapolated from it to make trading decisions. Technical analysis as a practice is a derivative of price action since it uses

The indicator scans for Dinapoli thrust pattern in multiple timeframes for a specific market. Key Features Indicator can be used for all markets It can scan for thrust pattern on W1, D1, H4, H1, M30, M15 and M5 timeframes Ability to choose number of bars required above/below displaced moving average to define thrust Able to move display label on chart by single click Parameters Minimum Bars: Least amount of bars to account for Thrust DMA Period: Moving average period DMA Shift: Number or bars re

The indicator scans for Dinapoli thrust pattern in multiple timeframes for the all markets filtered and shows the results on Dashboard. Key Features Dashboard can be used for all markets It can scan for thrust pattern on MN1, W1, D1, H4, H1, M30, M15 ,M5, M1 timeframes Ability to choose number of bars required above/below displaced moving average to define thrust Parameters
UseMarketWatch: Set true to copy all symbols available in market watch MarketWatchCount : Set the number of symbols that

The indicator is the advanced form of the MetaTrader 4 standard Fibonacci tool. It is unique and very reasonable for serious Fibonacci traders. Key Features Drawing of Fibonacci retracement and expansion levels in a few seconds by using hotkeys. Auto adjusting of retracement levels once the market makes new highs/lows. Ability to edit/remove any retracement & expansion levels on chart. Auto snap to exact high and low of bars while plotting on chart. Getting very clear charts even though many ret
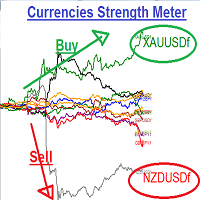
Currencies Strength Meters
:::: It is programmed to work on any M5 Chat windows !! Used to determine the Strongest currency pairs and the Weakest pairs also detect the peak of deviation of currencies strength IT CAN BE USED FOR INDICES AND STOCKS TOO !! Strategy one : It can be used in to BUY Strongest pair and SELL Weakest one Strategy two: It can be used on Daily basis to Hedge BUY Strongest pair with high % (ex: +1%) and BUY Weakest one with % lower(ex: -0.7%) the same with SELL Strategy

FINALMENTE! Um indicador estocástico para o MT4 que mostra vários períodos de tempo em um gráfico! Veja a posição real das linhas principal e de sinal em quatro períodos de tempo instantaneamente para ajudá-lo a tomar decisões comerciais fundamentadas.
Um verdadeiro indicador estocástico do MTF para os comerciantes que precisam ver visualmente o que o indicador está dizendo a eles em vários períodos de tempo, sem setas que aponte para cima ou para baixo ou números exibidos. Não há mais folga

Dollar mint indicator is a special workmanship with years of experience in forex.
Dollar mint ea is a fully non repaint indicator optimised with price action data such that once it gives you a signal t . The indicator can be used to trade anything on the mt4 with much ease.
Benefits ;
Fully non repaint Use in any timeframe Use in all the available tradable assets on mt4
Best to use on h4. It generates fully analysed buy and sell signals based on trend and also filters out retracement
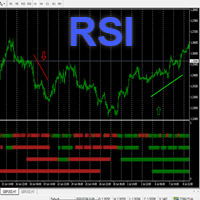
Hello This Indicator will draw Green (Up) and Red (Down) small arrows from Multi TimeFrames based in ( RSI ) to help you to take decision to buy or sell or waiting If there 4 green arrows in same vertical line that's mean (Up) and If there 4 Red arrows in same vertical line that's mean (Down) and the options contain (Alert and Mobile , Mail Notifications). Please watch our video for more details https://youtu.be/MVzDbFYPw1M and these is EA for it https://www.mql5.com/en/market/product/53352
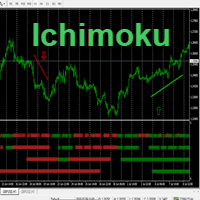
Hello This Indicator will draw Green (Up) and Red (Down) small arrows from Multi TimeFrames based in ( Ichimoku ) to help you to take decision to buy or sell or waiting If there 4 green arrows in same vertical line that's mean (Up) and If there 4 Red arrows in same vertical line that's mean (Down) and the options contain (Alert and Mobile , Mail Notifications). Please watch our video for more details https://youtu.be/MVzDbFYPw1M and these is EA for it https://www.mql5.com/en/market/product/533

Na terceira captura de tela (Modo Luz do Dia) marquei 7 elementos que vamos explicar passo a passo. 1 Três botões. a) Modo Noturno b) Modo Luz do Dia c) Escala fixa / Escala ajustada 2 Quatro botões. a) Desenhe uma seta de compra, compre linha e o Stop Loss correspondente com base no ATR. b) Feche a compra anteriormente desenhada e sonoridade uma marca de verificação. c) Desenhe uma seta de venda, venda de linha e o Stop Loss correspondente com base no ATR. d) Feche a venda anteriormente des
Are you tired of drawing Support & Resistance levels for your Quotes? Are you learning how to spot Support & Resistances? No matter what is your case, Auto Support & Resistances will draw those levels for you! AND, it can draw them from other timeframes, right into you current chart, no matter what timeframe you are using...
You can also Agglutinate regions/zones that are too much closer to each other and turning them into one single Support & Resistance Level. All configurable.

Indicator without redrawing Divergent MAX The DivirgentMAX indicator is a modification based on the MACD. The tool detects divergence based on OsMA and sends signals to buy or sell (buy|sell), taking into account the type of discrepancies detected.
Important!!!! In the DivirgentMAX indicator, the optimal entry points are drawn using arrows in the indicator's basement. Divergence is also displayed graphically. In this modification of the MACD, the lag problem characteristic of its predecessor

O MT4 ilimitado é um indicador universal que se adequa a todos os comerciantes iniciantes e experientes.
funciona em todos os pares de moedas, criptomoedas, ações em bruto
MT4 ilimitado - já configurado e não requer configuração adicional
E agora a principal coisa
Por que o MT4 ilimitado?
1 falta completa de redesenho
2 dois anos de testes pelos melhores especialistas em negociação
3 a precisão dos sinais corretos excede 80%
4 teve bom desempenho nas negociações durante os comun

Rebalance Overlay Technology (Rebolt) enables the trader to visualize the flow of money from one chart to another chart. Rebolt Probability indicates the probability that money has flowed from one chart to another chart for a specified length of time over a number of intervals specified by the user. When Rebolt reads Cyan or Blue these are buying signs good for the length of time specified by the user or until a conflicting signal arises.
When Rebolt reads Violet or Red there are selling signs

Planned Channel is a non-repainting channel indicator based on moving averages. The Planned Channel takes into account not simple moving averages, but double-smoothed ones, which, on the one hand, makes it possible to more clearly determine the market movement, and on the other hand, makes the indicator less sensitive. The key difference between the Planned Channel indicator and other channel indicators (for example, from the same Bollinger) is that the indicator displays more valuable signals f

The Reflex indicator is very easy to use, this is the key point. The indicator forms arrows (red and blue by default) and is installed in the usual way on any trading symbol with any time interval.
It is a trend and trading signal indicator based on the principle of combined analysis of calculated pivot points within a channel as well as overbought and oversold levels.
Indicator advantages High accuracy; Work with any trading symbols; Works at any time intervals; Not redrawn. Input paramete

Trend Power Indicator is an indicator which helps to identify trend direction and its power by using moving averages ZigZag pattern and correlations of tradable instruments. It provides trend power data with user-friendly interface which can be read easily and fast. This indicator by default is configured for trading of Adam Khoo's ( Piranhaprofit ) strategies. It saves mass of time for searching of tradable pairs by his strategies. It indicates when all required moving averages are align

All the points of intersection of the Troopers indicator will be points at which the trend direction changes. Sharp price fluctuations are ignored as well as noise around average prices. Signal points, where the color changes, can be used as potential market reversal points. The indicator tracks the market trend with very high reliability. This development can be used both for long-term trading and for pipsing on small periods. The indicator algorithm implements a kind of technical analysis base

Rebalance Overlay Technology (Rebolt) enables the trader to visualize the flow of money from one chart to another chart. Rebolt Delta (ReboltDelta) indicates the probable price change that will occur in the target chart based on changes in the source chart. ReboltDelta is designed for use in cooperation with Rebolt Probability. La tecnología de superposición de reequilibrio (Rebolt) permite al operador visualizar el flujo de dinero de un gráfico a otro gráfico. Rebolt Delta (ReboltDelta) indica
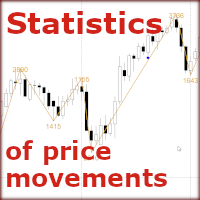
How to find out where to expect a price reversal with a probability of 80% - 90%?
The "Statistics of Price Movements" indicator collects statistics of significant price movements, skipping all small pullbacks, for a certain period of time and displays them in Excel file.
Sort the data in ascending order and get statistics of price reversals in 80%, 85%, 90%, 95% of all cases! (for example, in 2 years!)
After the reversal, the price will move from 1000 pips or more!
So...
Open the dail

FutureWave - индикатор строит предполагаемое будущее движение цены. В своих расчетах индикатор опирается на уровни поддержки и сопротивления, максимумы и минимумы, уровни Фибоначчи и волновой анализ. Индикатор прост в использовании, не требует дополнительных настроек и оптимизации. Работает на любой валютной паре и на любом таймфрейме.
Входные параметры: Wave Color - цвет волны
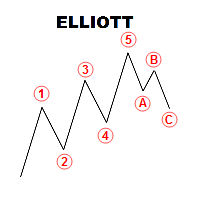
Panel with a set of labels for marking the Elliott wave structure
The panel is called using the Q key. if you click twice, you can move the panel along the schedule.
The panel consists of seven rows of three colored buttons, each of which creates 5 or 3 wave markings. Correction labels consist of 3 tags, or five by shift, you can break the chain of tags when installing by pressing the Esc key
.................... It is possible to disable the visibility of placemarks from lower timeframes

Inspired by high-level trading strategies from Jewish banks—strategies I first uncovered in a conversation on a leading traders' podcast—The Jewish Secret is your gateway to market mastery. The Jews are big players in the banking world, renowned for their market-making skills and keen understanding of market reactions, influenced the creation of this tool. With these strategies in mind, I've developed an indicator based on pure price action fundamentals. Its accuracy surpasses even my own expect

Multi Timeframe Moving Average Crossover Indicator With RSI Filter
Indicator gives buy/sell arrows on EMA Crossover. ( Fast EMA Crosses Slow EMA ) While your are monitoring the price in a certain timeframe, you can look for a EMA crossover in different time frames Indicator use RSI as a filter. ( Buy Confirmed when RSI crosses up 50, Sell Confirmed when RSI crosses down 50 ) No complicated settings. Good for pointing reversals on bigger timeframes while looking for a signal on smaller timefram

FXC iCorrelatioN MT4 Indicator (Specialized for DAX - Dow Jones)
The indicator shows the correlation soefficient between two assets. Correlations are useful because they can indicate a predictive relationship that can be exploited in practice. The correlation coefficient shows the relationship between the two symbols. When the correlation is near 1.0, the symbols are moving togerhet in the same direction. When the correlation is near -1.0, the symbols are moving in opposite direction. Important
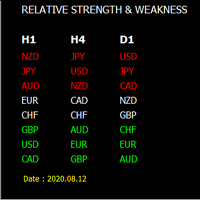
O Medidor de Força cambial é a forma mais fácil de identificar moedas fortes e fracas. Este indicador mostra a força relativa de 8 grandes moedas: AUD, CAD, CHF, EUR, GBP, JPY, NZD, USD.
Este Medidor de Força de Moeda é suportado por muitas funcionalidades poderosas: 1. Painel de contadores de força de moeda (mostra a força das moedas para qualquer prazo com classificação pelo nome ou valor num painel de instrumentos fácil de utilizar); 2. Permite calcular a força monetária média a partir de

O novo indicador é um preditor de tendência para o gráfico atual, bem como outros símbolos e prazos. Todos os botões do quadro são interativos. Por padrão, você tem 20 pares de moedas na lista de observação e três prazos (M5, H1, D1), mas você pode escolher os períodos e símbolos que deseja exibir no menu. Se o indicador for azul, indica o início de uma tendência de alta. Se for vermelho, indica o início de uma tendência de baixa. Na captura # 3 (modo Luz do dia) explicarei cada elemento em deta
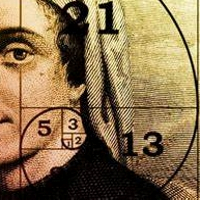
FTU Fibonacci
Este indicador desenha níveis fib para níveis de retração da ação do preço
Características:
Múltiplos níveis Fibo ajustáveis Altere a cor e a quantidade de barras do intervalo
2 linhas para o histórico de 50 barras, 2 linhas para o histórico de 20 barras, ambos mostrando 38 e 61 níveis Fib
Uso:
O objetivo é estudar ou medir a retração do preço Altere a cor e a quantidade de barras do intervalo Use em qualquer intervalo de tempo, produto/par, sem repintura, carr

This indicator gives you the strength of currencies according to multiple frames With this indicator, you can know the true direction of the currency pair This indicator gives you good advice to bet on the best fighter If you know how to use this indicator, you do not need any other indicators This indicator is suitable for working on long-term, short or medium-term trades. This indicator is your loyal friend

Description
Range Detector is an indicator that identifies ranges in the market and displays their presence on the price chart.
Recommendations
You can use this indicator to determine the flet and, accordingly, to determine the direction of opening a position or closing an opposite position.
Parameters
Maximum History Bars - maximum number of history bars for calculating the indicator. Average True Range Period - ATR indicator period (used to calculate the difference between mov
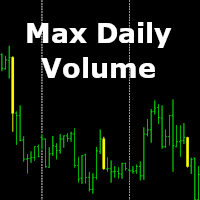
Do you want to trade like a pro? Buy where the professional buys and sell where the professional sells! Our indicator shows the most controversial and heated moment of the day! A moment of the day where a lot of money was loaded in the market and for this "Treasure" the further struggle will go!
And so, the indicator shows the bar in which there was the maximum struggle between the buyer and the seller for the past day, and it is this bar, or its extremes, or itself as a whole, becomes an imp

KT Renko Patterns scans the Renko chart brick by brick to find some famous chart patterns that are frequently used by traders across the various financial markets. Compared to the time-based charts, patterns based trading is easier and more evident on Renko charts due to their uncluttered appearance.
KT Renko Patterns features multiple Renko patterns, and many of these patterns are extensively explained in the book titled Profitable Trading with Renko Charts by Prashant Shah. A 100% automate
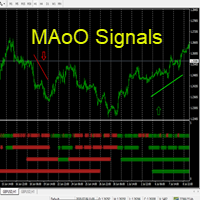
Hello This Indicator will draw Green (Up) and Red (Down) small arrows from Multi TimeFrames based in ( moving average of oscillator) to help you to take decision to buy or sell or waiting If there 4 green arrows in same vertical line that's mean (Up) and If there 4 Red arrows in same vertical line that's mean (Down) and the options contain (Alert and Mobile , Mail Notifications). Please watch our video for more details https://youtu.be/MVzDbFYPw1M and these is EA for it https://www.mql5.com/en/
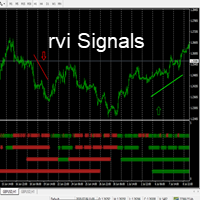
Hello This Indicator will draw Green (Up) and Red (Down) small arrows from Multi TimeFrames based in ( Relative Vigor Index ) to help you to take decision to buy or sell or waiting If there 4 green arrows in same vertical line that's mean (Up) and If there 4 Red arrows in same vertical line that's mean (Down) and the options contain (Alert and Mobile , Mail Notifications). Please watch our video for more details https://youtu.be/MVzDbFYPw1M and these is EA for it https://www.mql5.com/en/market/

Does your trading consist of Multiple EA's, Multiple time frames an no clear indication of how each individual strategy or time frame is performing, then this indicator will help. Assign the EA Magic number to this indicator and track it's performance on the chart by selecting on chart the period, today, week, month year or all history to view. Easy visual colour changing header to display the performance of the EA for the respective periods. Minimize the panel to reduce chart clutter. Add yo
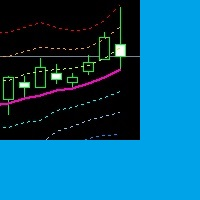
A Channel and Trend indicator. You set as you want. You can use at all timeframe. You can use for martingale,scalping and tunnel strategies. I set some number for me, but you can change this number as you want. You can use this indicator for your expert advisor apps. if you want another features i can do it for you.
Input Values: 1.) Last_Candle : Last candle for display indikator. 2.) X_Price : Price of indicator. 3.) MA_Period : Period for Moving Average. 4.) MA_Method : Method for Moving Av
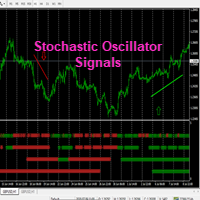
Hello This Indicator will draw Green (Up) and Red (Down) small arrows from Multi TimeFrames based in ( Stochastic oscillator ) to help you to take decision to buy or sell or waiting If there 4 green arrows in same vertical line that's mean (Up) and If there 4 Red arrows in same vertical line that's mean (Down) and the options contain (Alert and Mobile , Mail Notifications). Please watch our video for more details https://youtu.be/MVzDbFYPw1M and these is EA for it https://www.mql5.com/en/ma

An arrow is formed on the current candle and indicates the direction of the next candle and the possible direction of the trend in the future.
The signal can sometimes drop out.
The trade is entered at the Next candlestick. .
its advantages:
accuracy of signals. complete absence of redrawing. You can choose absolutely any tool. the indicator will provide many profitable and accurate signals there is alert, push, email of seeing ... no need to pile up a live chart with different indica
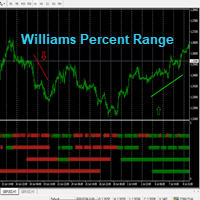
Hello This Indicator will draw Green (Up) and Red (Down) small arrows from Multi TimeFrames based in ( Williams Percent Range ) to help you to take decision to buy or sell or waiting If there 4 green arrows in same vertical line that's mean (Up) and If there 4 Red arrows in same vertical line that's mean (Down) and the options contain (Alert and Mobile , Mail Notifications). Please watch our video for more details https://youtu.be/MVzDbFYPw1M and these is EA for it https://www.mql5.com/e
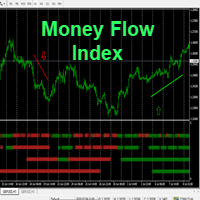
Hello This Indicator will draw Green (Up) and Red (Down) small arrows from Multi TimeFrames based in ( Money Flow Index ) to help you to take decision to buy or sell or waiting If there 4 green arrows in same vertical line that's mean (Up) and If there 4 Red arrows in same vertical line that's mean (Down) and the options contain (Alert and Mobile , Mail Notifications). Please watch our video for more details https://youtu.be/MVzDbFYPw1M and these is EA for it https://www.mql5.com/en/market/p

FXC iRSI-DivergencE MT4 Indicator
This is an advanced RSI indicator that finds trend-turn divergences on the current symbol. The indicator detects divergence between the RSI and the price movements as a strong trend-turn pattern.
Main features: Advanced divergence settings
Price based on Close, Open or High/Low prices Give Buy/Sell open signals PUSH notifications
E-mail sending Pop-up alert Customizeable Information panel Input parameters: RSI Period: The Period size of the RSI indicator.
R

This is simple profitable system I have been using to trade for over 10 years.
You do not need many indicators on your charts to be successful as a trader. Just find the right strategy that has been proven over time and stick to it. You are not only buying trading system when you buy my product but also mentorship. You will become one of the members of my close trading group on Telegram where you will learn how to manage your trading career and become a discipline trader who makes consistent

Negociar é esperar o momento certo. Esse indicador foi criado para saber o que está acontecendo em nossos gráficos sem ter que cobrir a tela com indicadores. Além disso, possui vários tipos de alertas que nos permitem dedicar nosso tempo a outras coisas até que algo interessante aconteça. Você pode usar vários alarmes ao mesmo tempo. Não é um problema. Por padrão, o AlterAlert nos oferece alertas quando os seguintes indicadores nos dão um sinal: ◾A média de tempo (cruzes de MA)
oscilador ◾Stoc

Индикатор ищет дивергенции по индикаторам: MACD, RSI,CCI,Stochastic,OsMA,RVI. По клику на сигнальную кнопку осуществляется переход на график с
сигналом. Для каждого индикатора применяется свой шаблон. Цифры на сигнальных кнопках указывают расстояние в барах от сигнала. Прокрутка
(scrolling) панели осуществляется клавишами "UP" "DOWN" на клавиатуре.
Входные параметры
Lists Of Currencies To Search For Divergences - Список торговых инструментов.
General Setting - Общие настройки панели.
T

There are 8 types of this indicator. Consisted of 1. Bullish and Bearish Engulfing 2. Morning and Evening Star 3. Three Green Soldiers and Three Red Crows 4. Three Inside Up and Down 5. Three Outside Up and Down 6. Bullish and Bearish Harami 7. Tweezers Top and Bottom 8. Piercing and Dark cloud cover
Signal Filter :: 1. The appearance of the candle stick 2. SMA 3. 2EMA :: EMA Fast and EMA Slow 4. RSI
N otification :: 1. Via screen 2. Email 2. Phone
For trading 1. Scaling 2. Binary options

The indicator identifies two most important patterns of technical analysis - Pin Bar and Engulfing. MT5-version https://www.mql5.com/en/market/product/53701 Settings: Mincandle size for PinBar - The minimum size of the Pin-Bar candlestick; Percentage of candle body on size - The percentage of the candle body in relation to its length; PinBar Alert - Alert when a Pin-Bar is detected; PinBar Mail - Sends an email when a Pin Bar is found; PinBar Notification - Sends a push notification when a Pin

Индикатор высчитывается по сложному авторскому алгоритму. Он строится с учетом тенденции по зонам перекупленности перепроданности объёмов . Это позволяет выявлять дивергенцию объёмов , выявить так называемые приседающие бары. Также он определяет уровни входа в рынок и цели. Средняя линия канала является предполагаемым уровнем отката.
RPeriod- период расчета индикатора
Indicator_Level - уровень зон перекупленности перепроданности
Draw Fibo Levels - отображаем целевые уровни
Fibo Level Col

[DESCRIÇÃO]
O indicador de Ponto de entrada mostra setas para cima / para baixo como um ponto de entrada para compra / venda. O sinal é baseado em EMA, MACD e Price Action.
Uma seta vermelha significa que é uma boa oportunidade para vender. Uma seta verde significa que é uma boa oportunidade para comprar. [AVISO E RECOMENDAÇÕES]
Negociar Forex e instrumentos financeiros alavancados envolve risco significativo e pode resultar na perda de seu capital investido. Você não deve investir mais do q
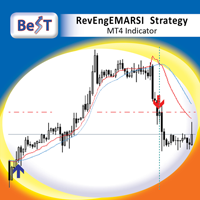
BeST_RevEngEMARSI Strategy is an MT4 Indicator that is based on the indicator RevEngEMARSI by Giorgos Siligardos that was presented in his article " Reverse Engineering RSI (II) " ( TASC_Aug 2003 ) as a new variation of his inverse-RSI indicator and which transforms the Exponential moving average of RSI into a curve in the price graph, simplifying the price projection method and improving its visual representation. BeST_RevEngEMARSI Strategy while implementing the crossings with its Moving Aver

Retracement Hunter This Indicator based on powerfull daily levels . support and resistance, Buy / Sell entries which is more based on low risk and high reward and winning ratio, Enter trade when you get popup alert , book profit on target1, target 2, target3 levels, most of the trending days it will hit target3, but its always safe to book partial at target1 or target2
Buy best entry when rule 1) look for Buy 2) Emas aligned less than 0.25 3) Main Ema aligned Buy , it will alert when all t

This indicator is an upgrade of traditional MACD on MT4. Macd Base line cross above Macd signal line the color of histogram change is red color and entry order Sell. Macd Base line cross below Macd signal line the color of histogram change is green color and entry order Buy.
For above histogram of Macd can change color to good looking by can change color above zero line and lower line.

Trading is a trade war. So a trader is a warrior. A warrior needs to be armed with a weapon
This Binary Star Wars Pro is your workout routine. That can accelerate the results precisely
Who deserves this kind of precision weapon? 1. People who want to profit. From binary options trading 2. Those who want to trade short, profit fast 3. People who want long-term Can be done 4. Newbie can use it. 5. Old hands can be used very well.
How it works It works very easy. For binary options Time fra
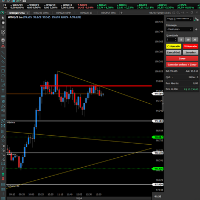
O indicador DonForex é uma das ferramentas mais utilizadas para traçar suporte e resistência automaticamente. Ele traça os melhores níveis de suporte e resistência do gráfico em qualquer tempo. Isso ajuda você a ter uma visão mais amplas para fazer suas operações
As linhas pontilhadas são os pontos mais tocados pelo preço formando assim uma região de suporte ou resistência. Ele também traça automaticamente linhas de tendências de alta (LTA) ou de baixa (LTB) nos dando oportunidade de compra e
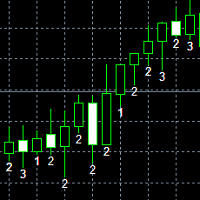
Rob Smith's is a trading method developed over a 30 year career in the market. TheSTRAT is a multi-timeframe strategy that has three major components: Inside Bars - Inside Bars occur when the current candle falls completely within the prior candle. Directional Bars - Directional Bars occur when the current candle takes out one side of the prior candle. Outside Bars - Outside Bars occur when the current candle takes out both sides of the prior candle. #thestrat

This advisor enters the market at the opening of London Market . It has a automatic function that give buy (arrow up green) and sell (arrow down red) signal when the indicator met high probabilities requirements.Once the signal is generated it is the trader discretions to start the order button and do trade manually. Stop loss are base on ATR. Recommended Take profit is 20pips. The trading system is suitable for both experienced traders and beginners.
Monitoring and proof of wins : https

For this set of indicators 1. General information - Calculates with high performance mathematical algorithms. - Calculated from the price of candles - The entry point of this order is filtered by the train EMA and the oscillator. - Calculate the integrity of the candle
2. How does it work? - You can see two types of order entry points: the notification on the monitor and the arrow. - You can trust 75-95 percent of this entry point.
3. Settings - A complete candle

For this set of indicators 1. General information - Calculates with high performance mathematical algorithms. - Calculated from the price of candles - The entry point of this order is filtered by the train EMA and the oscillator. - Calculate the integrity of the candle
2. How does it work? - You can see two types of order entry points: the notification on the monitor and the arrow. - You can trust 75-95 percent of this entry point.
3. Settings - Retracement is re

For this set of indicators 1. General information - Calculates with high performance mathematical algorithms. - Calculated from the price of candles - The entry point of this order is filtered by the train EMA and the oscillator. - Calculate the integrity of the candle
2. How does it work? - You can see two types of order entry points: the notification on the monitor and the arrow. - You can trust 75-95 percent of this entry point.
3. Settings - A complete candle

For this set of indicators 1. General information - Calculates with high performance mathematical algorithms. - Calculated from the price of candles - The entry point of this order is filtered by the train EMA and the oscillator. - Calculate the integrity of the candle
2. How does it work? - You can see two types of order entry points: the notification on the monitor and the arrow. - You can trust 75-95 percent of this entry point.
3. Settings - A complete candle

For this set of indicators 1. General information - Calculates with high performance mathematical algorithms. - Calculated from the price of candles - The entry point of this order is filtered by the train EMA and the oscillator. - Calculate the integrity of the candle
2. How does it work? - You can see two types of order entry points: the notification on the monitor and the arrow. - You can trust 75-95 percent of this entry point.
3. Settings - A complete candle
Saiba como comprar um robô de negociação na AppStore do MetaTrader, a loja de aplicativos para a plataforma MetaTrader.
O Sistema de Pagamento MQL5.community permite transações através WebMoney, PayPay, ePayments e sistemas de pagamento populares. Nós recomendamos que você teste o robô de negociação antes de comprá-lo para uma melhor experiência como cliente.
Você está perdendo oportunidades de negociação:
- Aplicativos de negociação gratuitos
- 8 000+ sinais para cópia
- Notícias econômicas para análise dos mercados financeiros
Registro
Login
Se você não tem uma conta, por favor registre-se
Para login e uso do site MQL5.com, você deve ativar o uso de cookies.
Ative esta opção no seu navegador, caso contrário você não poderá fazer login.