Volume Profile Chart
- 지표
- Makarii Gubaydullin
- 버전: 1.0
- 활성화: 20
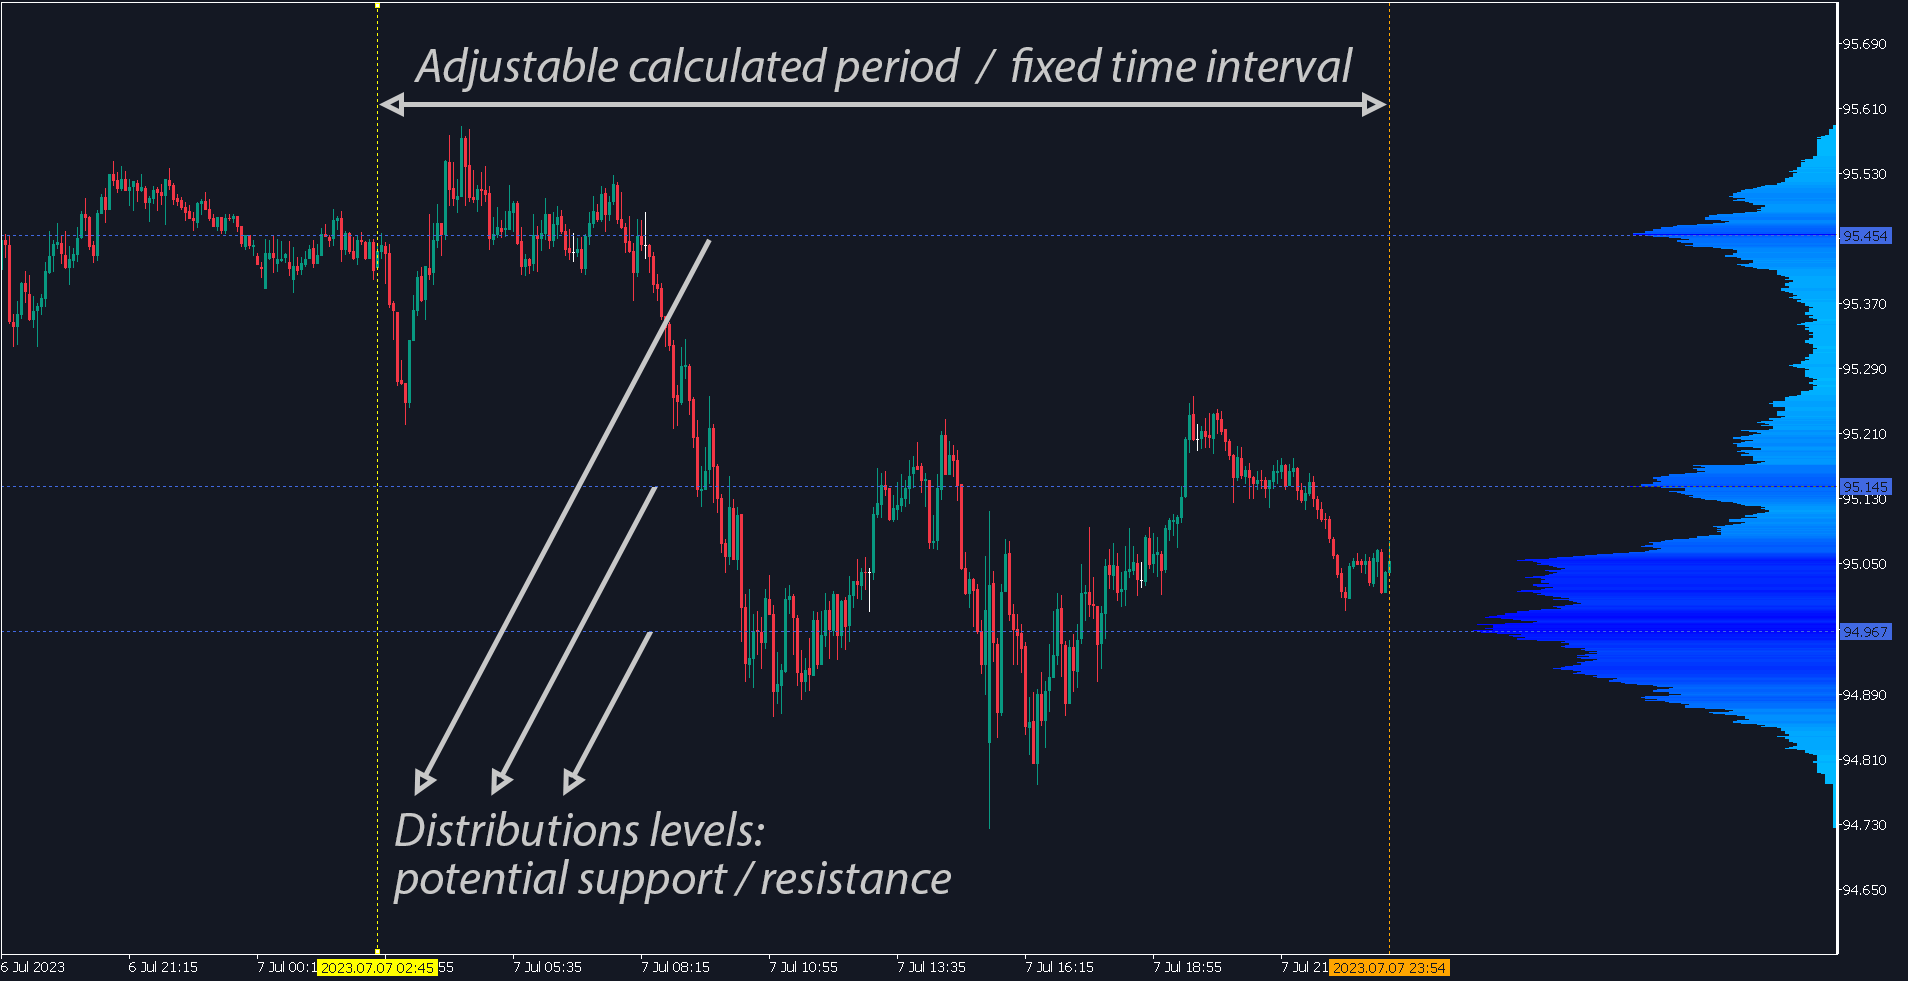
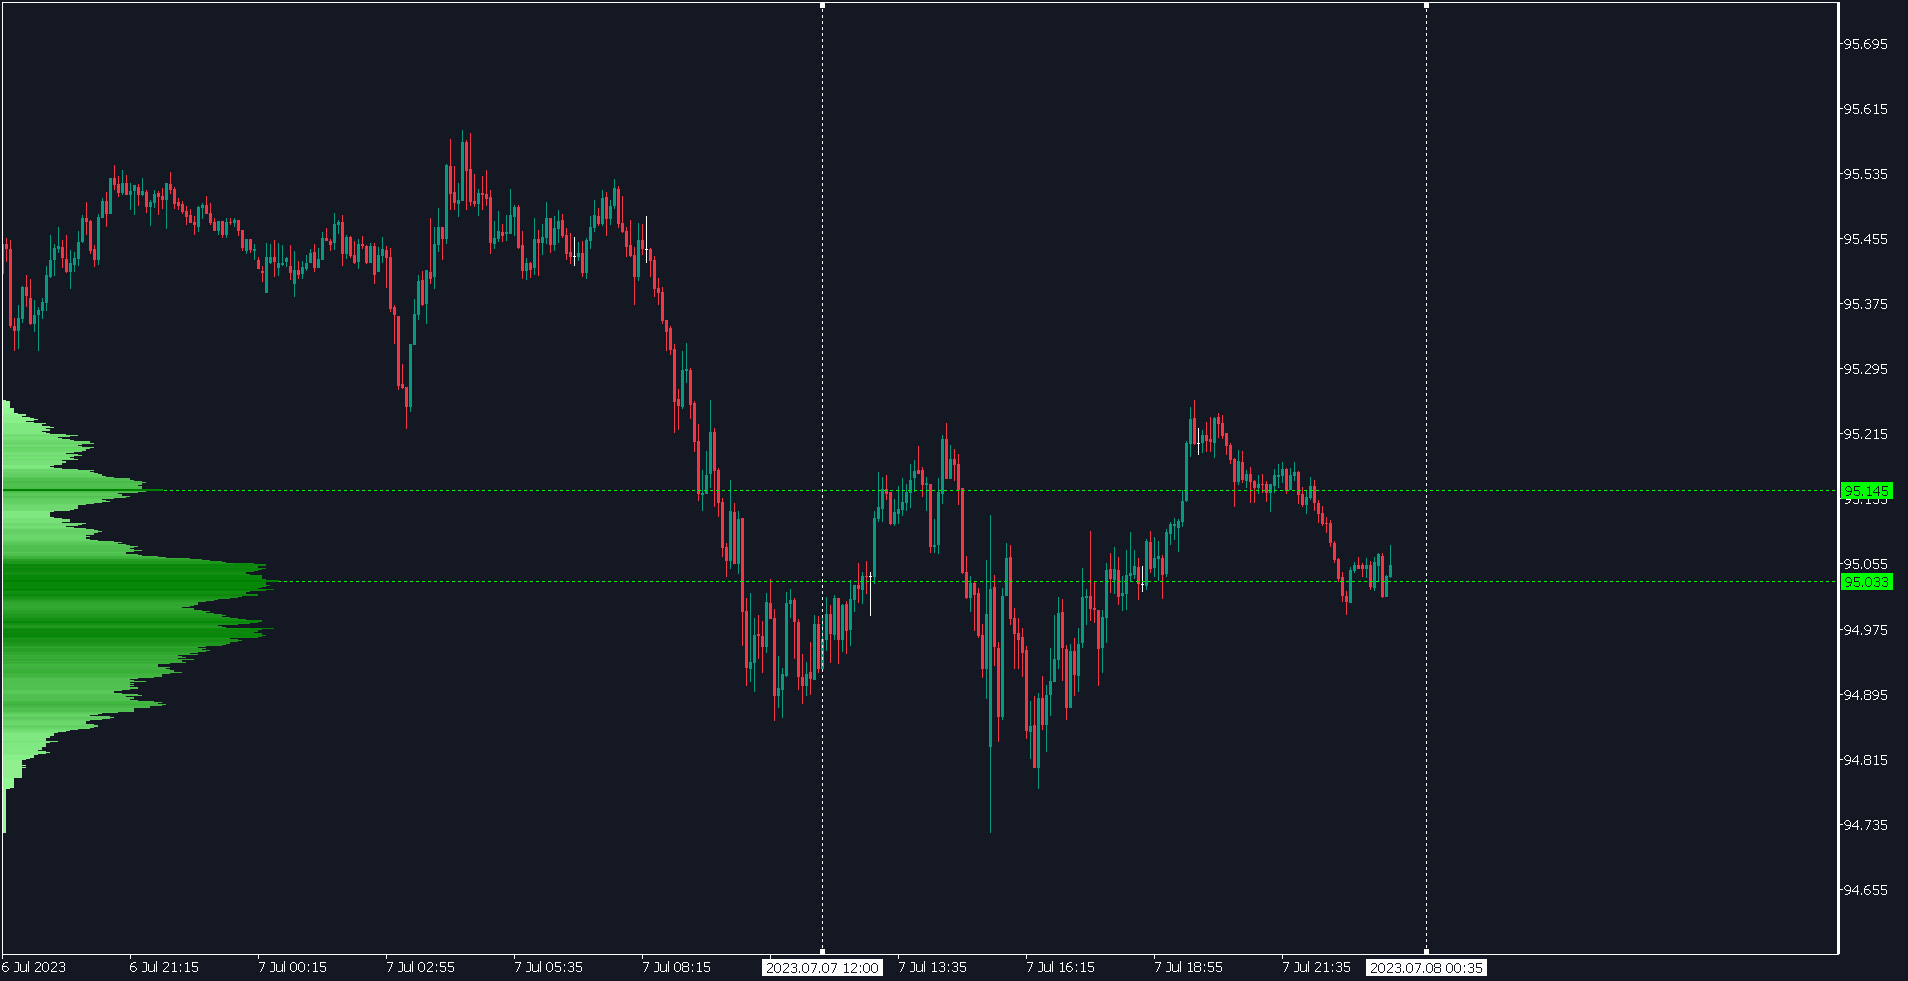
Visualization of the trade deals, distributed by price levels.
You can set any period for calculation: between 2 vertical lines, or set a fixed time interval.
The histogram levels are relative: a wider bar means more trading volume.
Distribution extremes can be used as a support and resistance levels.
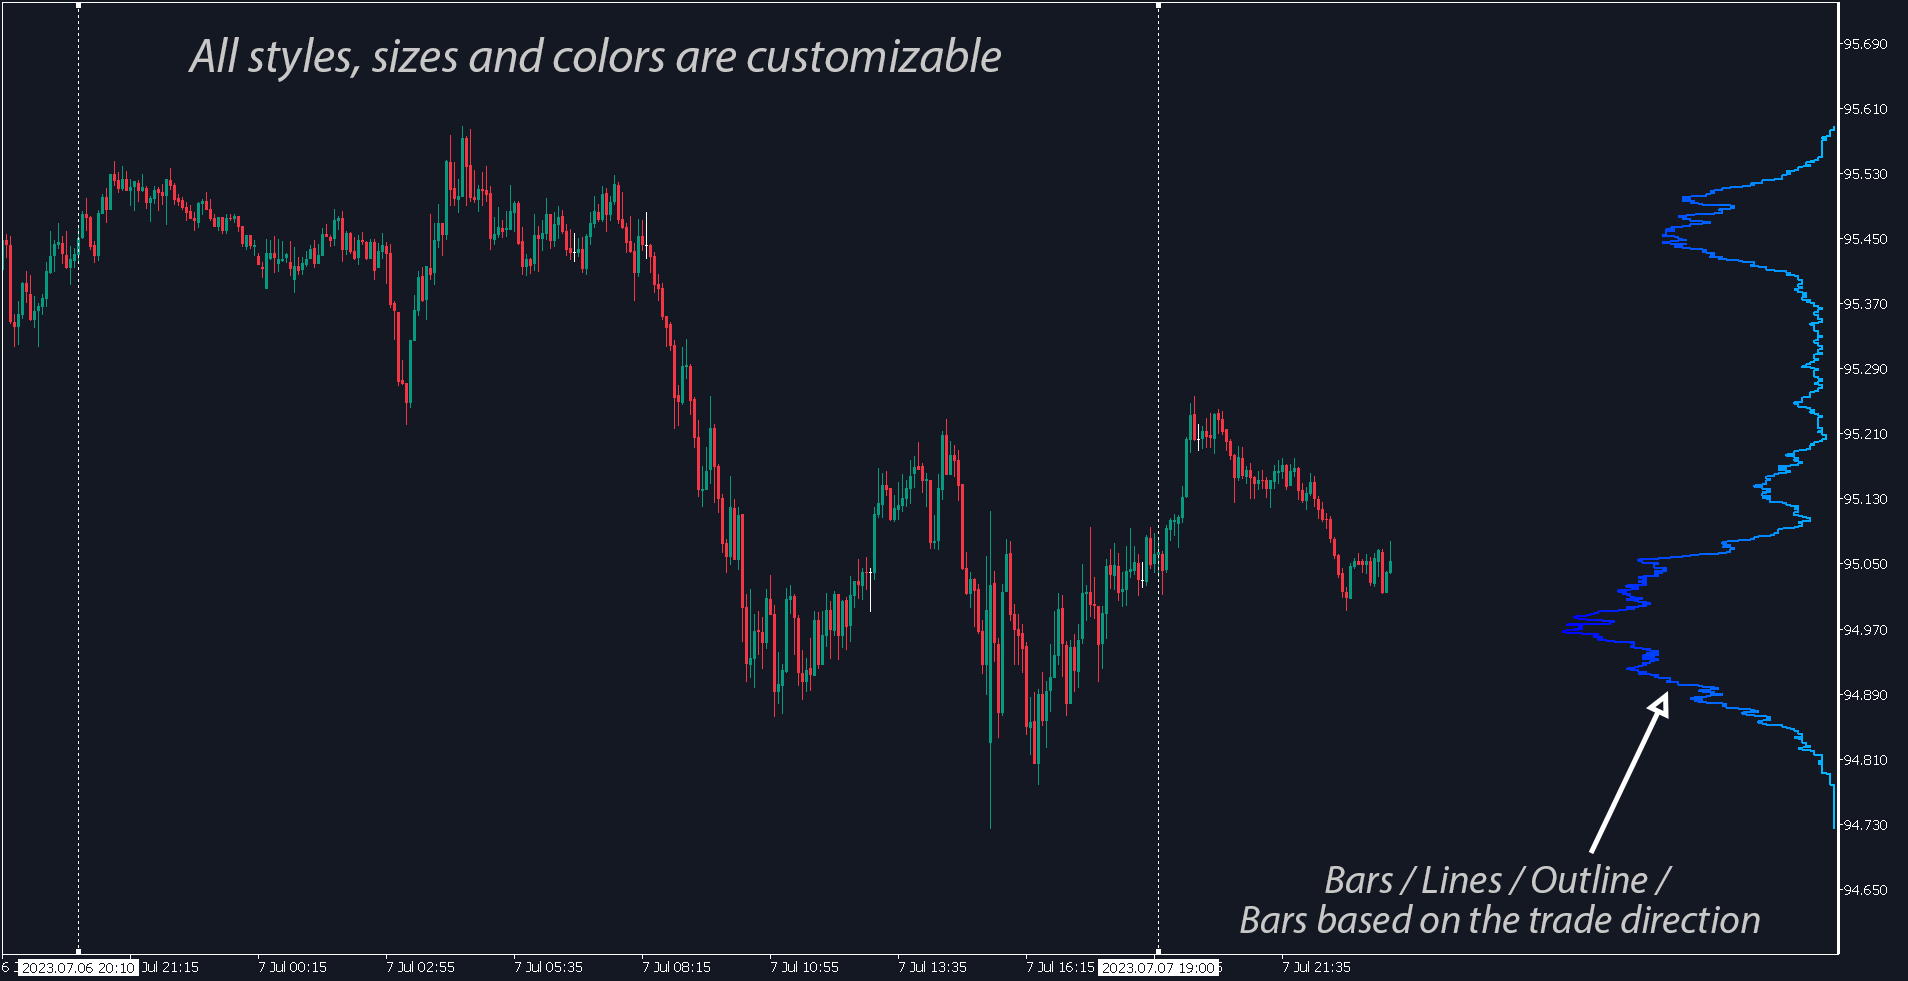
All styles, sizes and colors are customizable.
My #1 Utility: includes 65+ functions | Contact me if you have any questions | MT5 version
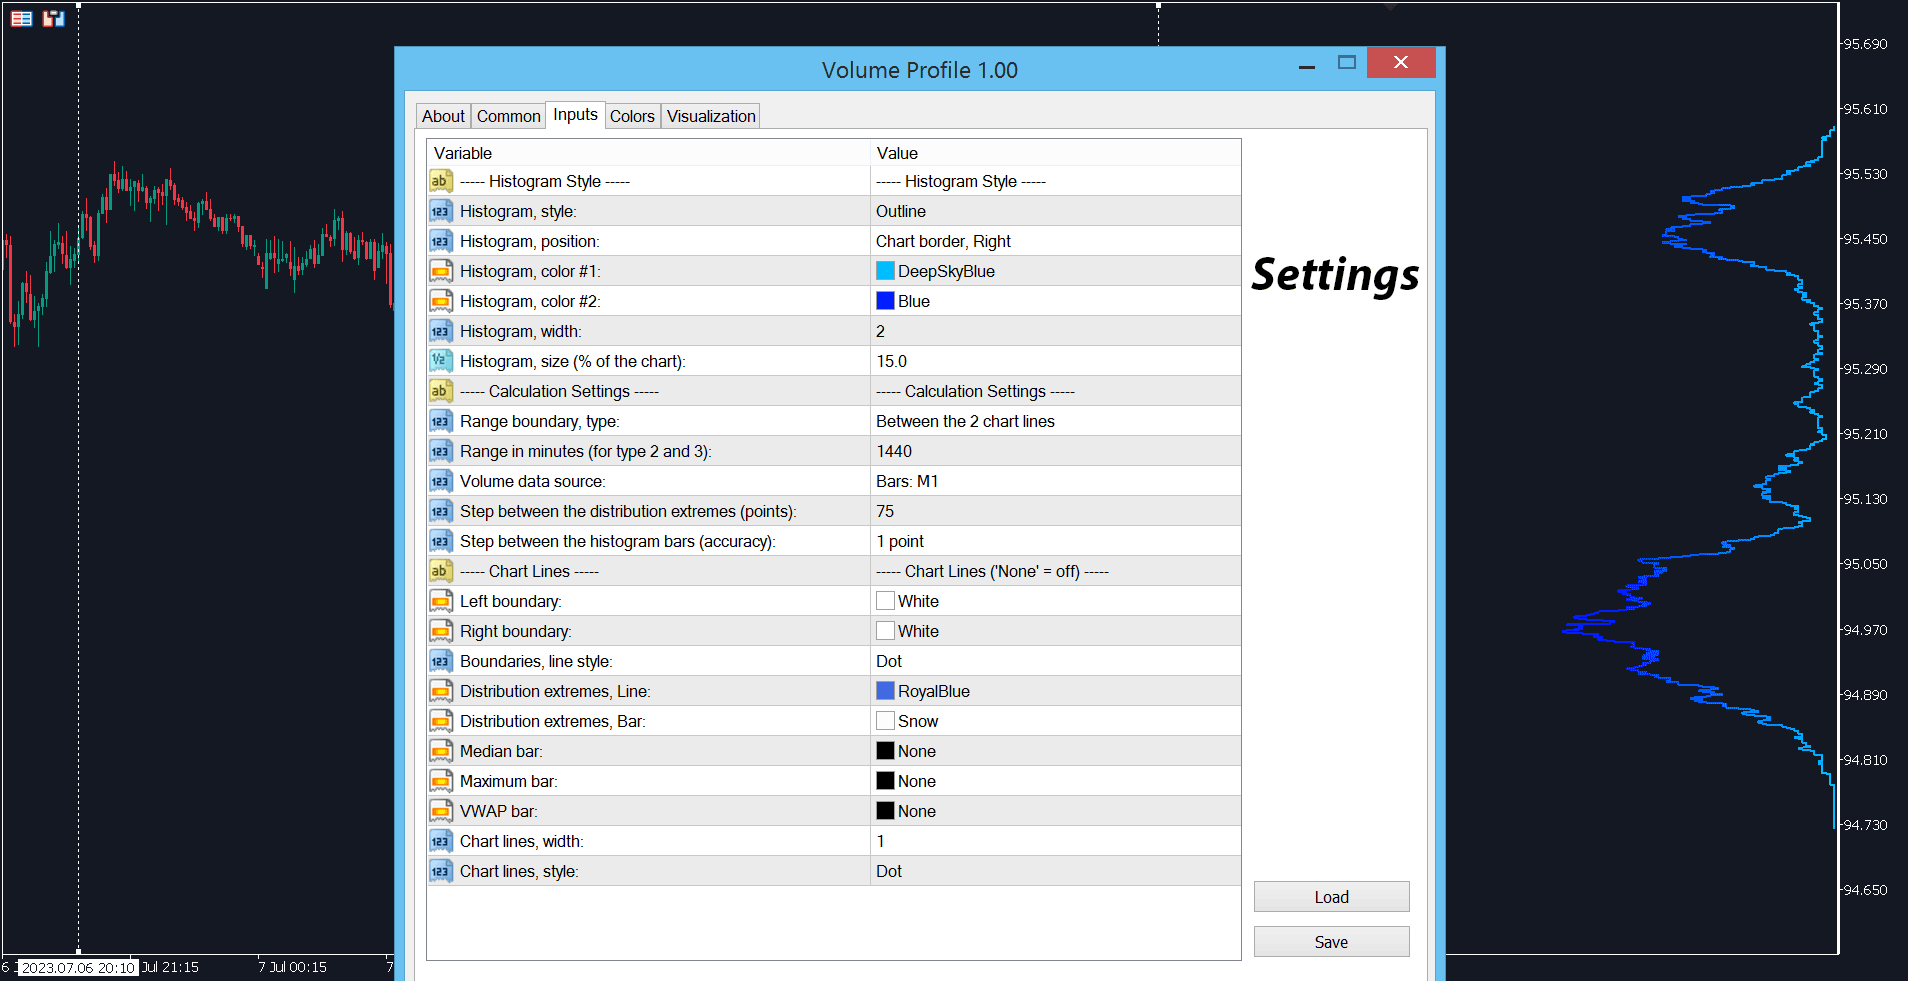
In the settings of the indicator, you can configure:
Histogram Style:
- Visual mode: Bars / Lines / Outline / Direction (bars whose color depends on the prevailing price direction at each level).
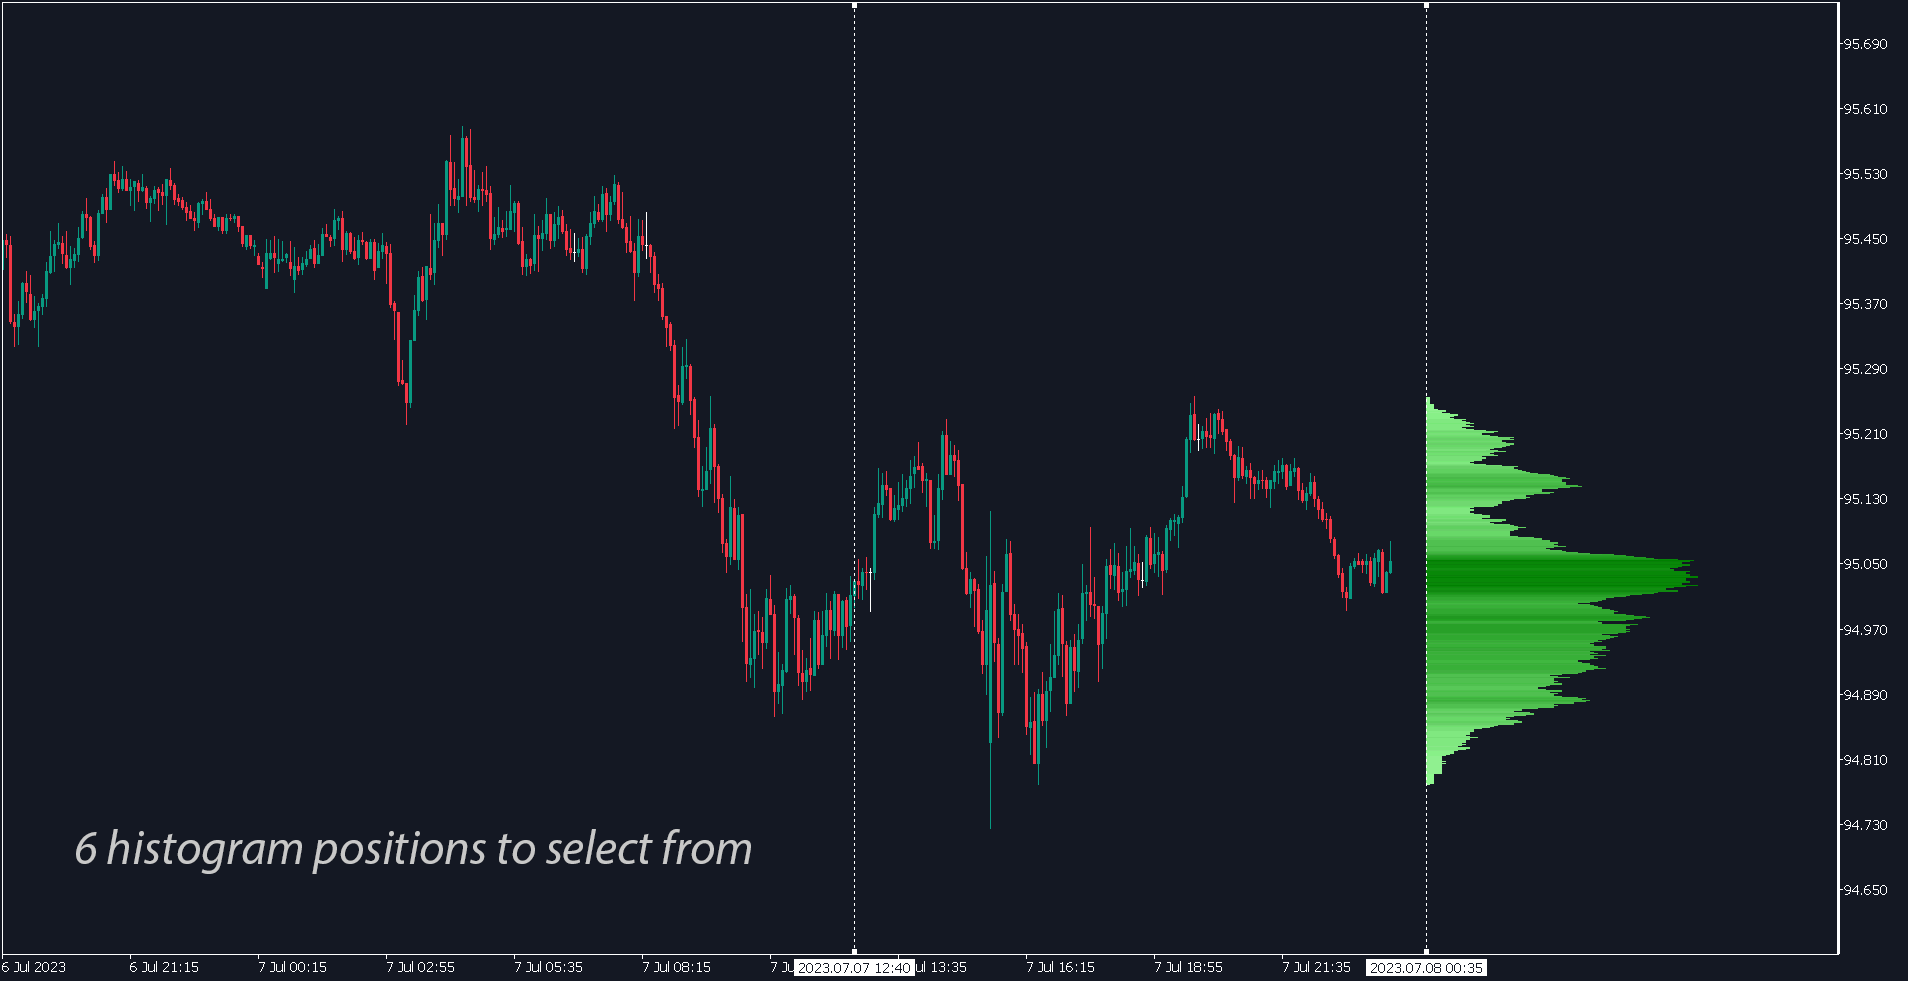
- Histogram position: At the chart border / Inside the time range / Outside the time range: left / right.
- 2 histogram colors.
- Histogram width.
- Histogram size (% of the chart width).
Calculation Settings:
- Type of the range boundary: Between the 2 chart lines / Specified recent minutes / Specified minutes prior to the right border.
- Range duration, in minutes (for type 2 and 3).
- Volume data source: Chart bars (M1 / M5 / M15 / M30).
- Step between the calculated distribution extremes (in points).
- Step between the visualized histogram bars (accuracy).
Styles of auxiliary chart levels: set 'None' as a color to turn off a certain level.
- Left and right time boundaries colors (vertical lines).
- The style of vertical time boundaries.
- Distribution extremes: line color.
- Distribution extremes: bar color.
- Median bar color.
- Maximum bar color.
- Volume-Weighted Average Price, bar color.
- Auxiliary chart lines: width and style.
The program file must be placed in the "Indicators" directory.