수직선.
선 대신 지그재그를 사용하면 작동합니다.
감사합니다. ZigZag를 파싱하고 선을 그리는 원리를 이해하려고 노력하겠습니다.
선 대신 지그재그를 사용하면 작동합니다.
지그재그 자체가 좀 복잡해서 파싱이 쉽지 않았다. 하지만 간단한 예를 준비했습니다... 마지막 막대에서 3개의 막대에 지그재그 조언에 따라 높음과 낮음 사이에 선이 있는 기능을 추가할 수 있습니까? 원리를 이해하고 나면 스스로 개발할 수 있습니다.
 #property indicator_chart_window
#property indicator_buffers 1
#property indicator_plots    1
//--- plot Support
#property indicator_label1    "Line"
#property indicator_type1    DRAW_LINE
#property indicator_color1    clrAqua
#property indicator_style1    STYLE_SOLID
#property indicator_width1    3

//--- indicator buffers
double          LineTest[];
double          HighMapBuffer[];     // highs
double          LowMapBuffer[];       // lows
//+------------------------------------------------------------------+
//| Custom indicator initialization function                         |
//+------------------------------------------------------------------+
int OnInit ()
  {
//--- indicator buffers mapping
   SetIndexBuffer ( 0 ,LineTest, INDICATOR_DATA );
   SetIndexBuffer ( 1 ,HighMapBuffer, INDICATOR_CALCULATIONS );
   SetIndexBuffer ( 2 ,LowMapBuffer, INDICATOR_CALCULATIONS );
   PlotIndexSetDouble ( 0 , PLOT_EMPTY_VALUE , EMPTY_VALUE );
//---
   return ( INIT_SUCCEEDED );
  }
//+------------------------------------------------------------------+
//| Custom indicator iteration function                              |
//+------------------------------------------------------------------+
int OnCalculate ( const int rates_total,
                 const int prev_calculated,
                 const datetime &time[],
                 const double &open[],
                 const double &high[],
                 const double &low[],
                 const double &close[],
                 const long &tick_volume[],
                 const long &volume[],
                 const int &spread[])
  {
//---
   int limit=prev_calculated;

   for ( int i2=limit;i2<rates_total;i2++) // New bar recalculate
     {
       if (limit<rates_total- 1 ) continue ; // New bar recalculate
       for ( int i= 0 ;i<rates_total;i++)
        {
         //if(i<rates_total-3 && i>rates_total-15) // H Line 3-15 bar
         //   LineTest[i]=high[rates_total-2]; // Price
         //else LineTest[i]=EMPTY_VALUE;

         HighMapBuffer[i]=high[rates_total- 3 ];
         LowMapBuffer[i]=low[rates_total- 3 ];
         LineTest[i]=                     // ???


        }
     }
   return (rates_total);
  }
//+------------------------------------------------------------------+
지그재그 자체가 좀 복잡해서 파싱이 쉽지 않았다. 하지만 간단한 예를 준비했습니다... 마지막 막대에서 3개의 막대에 지그재그 조언에 따라 높음과 낮음 사이에 선이 있는 기능을 추가할 수 있습니까? 원리를 이해하고 나면 스스로 개발할 수 있습니다.
https://www.mql5.com/ru/docs/customind/indicators_examples/draw_zigzag

- www.mql5.com
https://www.mql5.com/ru/docs/customind/indicators_examples/draw_zigzag
감사합니다. 여기에 이미 몇 가지 설명이 있으며 okozalos는 스타일이며 표시기가 아닙니다. :), 알아내려고 노력하겠습니다.
세로줄은 다 된것 같은데 세로줄 연결선 없애는 방법을 모르겠네요. 연결선이 사라지도록 누군가 내 예를 고칠 수 있습니까?
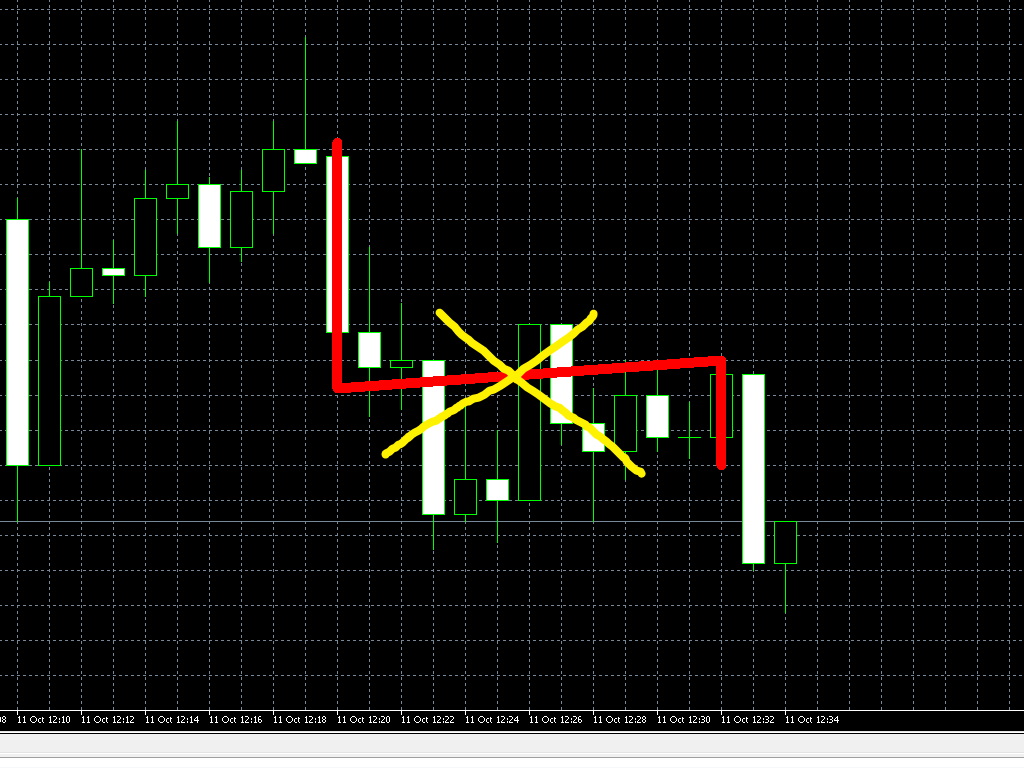
 #property indicator_chart_window
#property indicator_buffers 2
#property indicator_plots    1
//--- plot ZigZag
#property indicator_label1    "ZigZag"
#property indicator_type1    DRAW_ZIGZAG
#property indicator_color1    clrRed
#property indicator_style1    STYLE_SOLID
#property indicator_width1    10

//--- indicator buffers
double          ZigZagBuffer1[];
double          ZigZagBuffer2[];
//+------------------------------------------------------------------+
//| Custom indicator initialization function                         |
//+------------------------------------------------------------------+
int OnInit ()
  {
   SetIndexBuffer ( 0 ,ZigZagBuffer1, INDICATOR_DATA );
   SetIndexBuffer ( 1 ,ZigZagBuffer2, INDICATOR_DATA );

   return ( INIT_SUCCEEDED );
  }
//+------------------------------------------------------------------+
//| Custom indicator iteration function                              |
//+------------------------------------------------------------------+
int OnCalculate ( const int rates_total,
                 const int prev_calculated,
                 const datetime &time[],
                 const double &open[],
                 const double &high[],
                 const double &low[],
                 const double &close[],
                 const long &tick_volume[],
                 const long &volume[],
                 const int &spread[])
  {
   int limit=prev_calculated;
   if (prev_calculated== 0 )limit=rates_total- 1 ;

   for ( int i2=limit;i2<rates_total;i2++) // recalculate on new bar
     {

       for ( int i= 0 ;i<rates_total;i++)
        {
         if (i==rates_total- 3 || i==rates_total- 15 ) // should be VLine on 3th and 15th bar!
           {
            ZigZagBuffer1[i]=high[i];
           }
         else
           {
            ZigZagBuffer1[i]= EMPTY_VALUE ;
           }

         if (i==rates_total- 3 || i==rates_total- 15 ) // should be VLine on 3th and 15th bar !
           {
            ZigZagBuffer2[i]=low[i];
           }
         else
           {
            ZigZagBuffer2[i]= EMPTY_VALUE ;
           }

         if (ZigZagBuffer1[i]!= EMPTY_VALUE ) Print ( " ZigZagBuffer1[" ,i, "]: " ,ZigZagBuffer1[i]);
         if (ZigZagBuffer2[i]!= EMPTY_VALUE ) Print ( " ZigZagBuffer2[" ,i, "]: " ,ZigZagBuffer2[i]);

        }
     }
   return (rates_total);
  }
//+------------------------------------------------------------------+
세로줄은 다 된것 같은데 세로줄 연결선 없애는 방법을 모르겠네요. 연결선이 사라지도록 누군가 내 예를 고칠 수 있습니까?
글쎄, 그럼 내가 틀렸어. 요점을 이해하지 못했다...
이 경우 그래픽 구성 DRAW_HISTOGRAM2 를 사용하는 것이 필요하고 더 쉽습니다.

- www.mql5.com
모든 것이 괜찮지 만 때로는 포인트의 시간이 하나의 촛불에있을 수 있으며 수직선이 나타납니다. 내가 알기로는 SupportBuffer[w]를 세로로 만들 수 없습니까?