YouTubeにあるマーケットチュートリアルビデオをご覧ください
ロボットや指標を購入する
仮想ホスティングで
EAを実行
EAを実行
ロボットや指標を購入前にテストする
マーケットで収入を得る
販売のためにプロダクトをプレゼンテーションする方法
MetaTrader 4のためのテクニカル指標 - 123

外国為替矢印インジケーターは、通貨市場でスキャルピングを成功させるために不可欠なツールです。 これにより、トレーダーはいつ売買ポジションを開く価値があるかを簡単に判断できるため、チャート分析に時間を費やすことなく利益を上げることができます。 一種の信号機であるインジケータの赤と青の矢印は、トレンドの方向を簡単に判断できる視覚的なツールです。 赤い矢印はショート ポジションを開く、つまり通貨ペアを売る可能性を示し、青い矢印はロング ポジションを開く、つまり通貨ペアを買う可能性を示します。 しかし、重要なのは矢印の色だけではありません。 インジケーターには、トレーダーがいつポジションに出入りするかをより正確に判断するのに役立つ他のパラメーターもあります。 たとえば、矢印ごとに、インジケーターは価格レベルを表示でき、到達するとポジションを開く必要があります。 移動平均、ボラティリティ、時間間隔など、他のパラメータも設定できます。 - これらすべてが、トレーダーが市場の動きをより正確に予測するのに役立ちます。 外国為替矢印インジケーターは、トレンド、横方向の動き、ボラティリティの高低など、さ
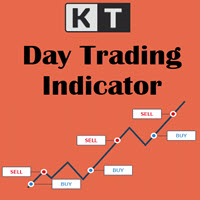
KT Day Trading MT4 provides simplified Buy and Sell signals using a combination of some specific candlestick patterns occurring in the market exhaustion zones.
These signals are designed to identify market reversals and entry/exit points. The indicator can be used to trade on any timeframe from the 1 Minute up to the Daily chart.
Features
Three types of entry signals according to the market structure i.e. Trend following, Range bound, and Counter trend signals. Crystal clear Entry, Stop-L

NATR - this is a normalized version of the ATR indicator Used to measure the level of volatility in % of the total volatility of the instrument, and not in points like a regular ATR For example NATR with a period of 10 will show the average size of a candle in % of the last 10 candles or how many percent an instrument passes in 1 candle on average This allows you to bring the values of any of the studied instruments to a common denominator. Has a simple and clear setup Visually shows
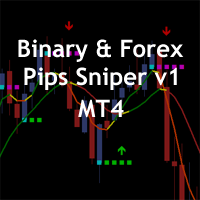
The Binary & Forex Pips Sniper MT4 indicator is based on technical analysis of two moving average and the slope of the slow moving average. The moving average helps to level the price data over a specified period by creating a constantly updated average price. Upward momentum is confirmed with a bullish crossover "Arrow UP", which occurs when a short-term moving average crosses above a longer-term moving average. Conversely, downward momentum is confirmed with a bearish crossover "Arrow Down", w

"AV Stop Hunter" is an indicator for MetaTrader 4, which draws entry arrows for long and short after so-called Stop Hunt candles and has several notifications about them. Since this is a smart money concept , the periods H1 and H4 are the best. Increasing volume improves the signal, lines and arrows are then thicker. The MQL5 variant has colored stop-hunting candles.
Definition :
Stop hunting, also known as stop running, is the practice of institutional traders (smart money) of driving t
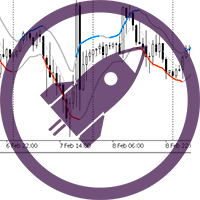
"Scalper Channel MT4" is a modern channel indicator that shows the trader the direction of the trade. For work, the indicator uses built-in and proprietary technical means and a new secret formula. Load it on the chart and the indicator will show you the entry direction in color:
If the upper limit of the price channel of the indicator is blue, open a buy position. If the lower limit of the price channel of the indicator is red, open a sell position. If the border of the indicator is gray, ne
Symbol Syncyro Switch - is a utility that allows you to switch a trading symbol on several charts at the same time. If you use several charts of the same symbol with different timeframes for analysis and want to change the symbol of a trading instrument, then this tool is just for you! With one click on the button with the inscription of the trading symbol, you can easily change it using this utility.
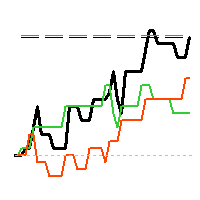
"AV Monitor" is an indicator for MetaTrader 4, which alowes a history analysis of the closed orders. It helps to achieve a quick visual analysis of your own trading or different expert advisors among themselves. Compare and analyze your expert advisors: Which one is the best?
I use an "AV Monitor MT5" indicator per running expert advisor chart to track its performance split into long & short, as well as an index chart e.g. DOW with this indicator and the setting "Show Balance & Equity" to tra

If you are a market operator looking for an advanced solution to identify trends and trend reversals in financial markets, the Weiss Wave indicator could be what you need. Based on the principle of Elliott wave analysis and combining multiple indicators, the indicator provides a comprehensive view of the market in an easy and intuitive way, even for less experienced traders. With clear and easy-to-interpret buy/sell signals, the indicator provides reliable guidance for identifying trends and tre

In case you get Laguerre S crat indicator, you will get Laguerre Scrat Ea as a Gift. To get Ea and det a iled m anu al PDF contact me PM. Default settings are for usd/cad H4 For St able Long term Profits Laguerre Scrat is a trading system based on 4 indicator combinations in the shape of one indicator. Laguerre indicator (upgraded), CCI, Bollinger bands and market volatility factor. It generates arrows in the indicator window and nuts on the price chart, doubling arrows for a better view where

if you want to put your "SL" in a safe place you should see the place of "SL" before opening the Order with this indicator no need to measure your "SL" on the chart many times please watch the video of this indicator:
you can change the style of this indicator: width, color, length, Time Frame, distance
if you need more info & video message me if you wanna see the video you should send me message Telegram ID: @forex_ex4 i also have other experts and indicators that will greatly improve your
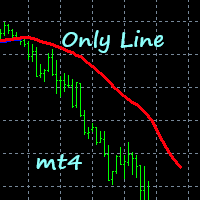
Use this indicator to help determine when to open buys or sells based on the color of the line. Excellent for scalping. Settings: Deviation. TrendPeriod.
Features Alerts. How to use: Simply attach to any chart with default settings. When used on lower timeframes (M1,M5,M30,H1), confirm on higher timeframes. Buy: Blue line below price. Best results when line is blue on multiple timeframes. Sell: Red line above price.
Best results when line is red on multiple timeframes.
Or change settin
RumahForexID Momentum Scalping Indicator is the best momentum indicator ever created, and why is that? The indicator works on all timeframes and assets, the indicator is made after 6 years of experience in forex. You know many momentum indicators on the internet are unhelpful, and difficult to trade, but RumahForexID Momentum Scalping Indicator is different , The indicator shows wave momentum, when the market is about to trend or consolidate, all that in one simple and clear indicator!
Ruma

Pinpoint Pro Indicator is a multi-time frames indicator, which uses more than five built-in MT4&MT5 indicator to generate trading signals. This indicator can perform several functions, such as: Send signals notification to mobile phone Gives precise signal entry upon following signal checklist points Can be used in all market such as currency pairs, stock market, metals, commodity, synthetic pairs and cryptocurrency pairs One built-in indicator can be used for signal verification before enterin

This indicator uses a special algorithm to plot the 4 lines for trading. Great for scalping. Does not feature any alerts and is best used manually after confirming the line displays. No need to set up the indicator. How to use: Attach to any chart. Can be used on any time frame. If used on lower time frames, check higher time frames for confirmation. Buy : - Wait for green and white lines to be above the level 50 dotted line, then open buys. - Buy when the green line crosses below the white line

Extreme Price Meter 過去の市場情報に基づいて、インディケータは反転の可能性が高い次の極端な価格を計算します。 売買の可能性が高い 2 つの価格帯を生成します。 ローソク足が確率バンドの外で閉じたときに配置される矢印を考慮すると、インジケーターの高い精度を簡単に確認できます。 デスクトップ、電話、電子メールの通知。
_________________________________________ _________________________________________ _________________________________________ _________________________________________
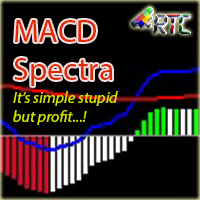
MACD Spectra 、シンプルだが収益性の高い取引指標! このインジケーターは、すべての時間枠とすべての通貨ペアで使用できます。 90% を超える精度で、このインジケーターは、取引活動を支援するための最良のインジケーターを探している初心者とプロのトレーダーの両方に最適です。 ヒストグラムの色、ヒストグラムの位置、シグナルと MACD ラインの位置に従うだけで、簡単に市場に出入りできます。 これ以上待たずに、MACD Spectral と一緒に安定した利益を獲得しましょう。
エントリーとエグジットの場合、インジケーターの読み取りは非常に簡単です。
青色の線が赤色の線と交差し、交点がゼロ ラインより下にあり、表示されるヒストグラムがバー 2 で赤色の場合、白いヒストグラムが表示されたときに売りエントリーと終了の強いシグナルです。 青色の線が赤色の線と交差し、交点がゼロ ラインの上にあり、表示されるヒストグラムがバー 2 で緑色の場合、白いヒストグラムが表示されたときに、買いエントリーとエグジットの強いシグナルです。 0 以下の赤のヒストグラムの後に白のヒストグラムが表示され

Fibonacci retracement is an object or function that is often used by traders to determine values of fibonacci levels. When to open position, where is the breakout or limit point, stop loss position and take profit position can be determined based on fibonacci levels. But commonly, this object only can be used manually in Metatrader 4 (MT4). Therefore we need an indicator of fibonacci retracement. The use of indicator will make decision making easier, faster, and more consistence. We recommend t
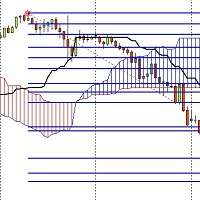
I have developed an indicator based on both the fibo musang strategy and the price breaking of the ichimoku cloud and it has amazing results
the features are:
1- Once activated it give you the trend where you are from the chart
2- After a trend change it gives you an alert on PC or notification on your phone if you are away.
3- It sends you the exact prices to take an order and 3 take profit levels and your stoploss.
4- It works on every timeframes from 1m to MN.
5- It works on pairs
Check My Product
Contact me to discover all my services
Pivot indicator is a tool used by many traders. It can be used by beginners and experts alike and allows you to identify support and resistance levels. Pivot indicator is a widely used tool because over the years it has shown the validity of the levels it calculates and can be easily integrated into your trading strategy. Pivot levels can be used on different timeframes and based on the chosen time duration, calculate levels using dail
Really simple tool that can be attached to any graph to keep an eye on the account status. It run as an indicator but actually is just a simple monitor. There are three sections: -account market status : infos about global open orders profit/loss, margin required, market status, etc. -account info: simple infos but good for setting lots amount, knowing contract size, server id, etc. -time data: in order not to get mad on time shifts, you have some info about local, broker, GMT time, plus winter/

This is an arrow formed by strong reversal candlesticks it is used on muti time frame or m15 and above for gold and h1 and above for currency pairs (can be used at m5 after strong volatile news) This indicator is 100% non-repain and non-repoint Have a success probability of bringing in more than 90% profit Your stop loss when entering your order is behind the arrow and will be very low it will only be 20 pips or 30 pips at m15 (note in larger timeframes it may be longer) How To USE When the
The "Stochastic Multi Period Buy Sell Alert" is a powerful technical indicator designed to analyze price momentum and trend strength across multiple timeframes. This indicator is a valuable tool for traders looking to identify profitable trading opportunities. With the indicator, you can monitor price movements in three different timeframes, namely M15, M30, and H1. The indicator calculates the Stochastic K value for each timeframe and determines whether the price is in an oversold or overbought

LINEAR REGREESION INDICATOR ==> The indicator represents the Linear Regression Line and the Support and Resistance lines, obtained based on the standard deviation with respect to the Linear Regression. Customization: The following values can be adjusted: Rango Tendencia: The number of bars or periods, within the considered time frame, taken as a reference for the indicator. AmpDesv: The amplitude or number of times to consider the standard deviation of the linear regression for its representatio
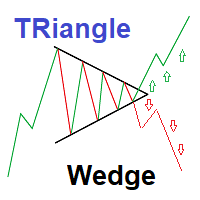
Strategy set to trade Triangle wedge break
This is a simple very effective strategy based on detecting and showing triangle wedges formation Strategy set to trade Triangle wedge break Red Arrows appears on crossing triangle down Green Arrows appears on crossing triangle Up You can also trade lower and upper triangle limit :(new version may be released to allow arrows for side ways trading) ---Sell on price declines from High triangle Level - Buy on increasing from Lower triangle level 2 inpu

Indicator customers will get Ea based on Fiter indicator for free as a Bonus. (watch video to see Ea in action) Fiter is EMA+ATR*RSI hibrid yellow line combined with Moving average red line, cross of which gives much smoother results than two simple Ma cross usage in trading. Effectiveness is proven by backtest and comparison with two simple Ma crosses. History shows that this method Fits with different market conditions and it can be boldly used in real manual trading for determining big trend

MT5 Version Order Blocks ICT Kill Zones SMT Divergences ICT Breakers
The ICT Breakers indicator is a powerful tool for traders looking to gain an edge in the market. This indicator is based on the order flow and volume analysis, which allows traders to see the buying and selling pressure behind the price action. This information can be extremely valuable in identifying key levels of support and resistance, as well as potential turning points in the market. Breaker blocks are areas where i

Осциллятор Чайкина ( Chaikin Oscillator ) — это индикатор импульса, созданный Марком Чайкиным , и, очевидно, индикатор назван в честь своего создателя. Он измеряет импульс линии распределения и накопления, используя формулу схождения-расхождения скользящих средних (MACD). На основе данных об этом импульсе мы можем получить представление о направленных изменениях в линии распределения и накопления.

This indicator is a supporting tool which helps you draw/update any chart object once. The additions or changes are automatically synchronized to all linked chart windows of the same instrument. Setup is simple. Open all required charts you want to work on, attach the indicator to each chart window and start using it.
Its only allowed to attach one indicator to each chart. Once attached, you can draw on any chart (as long as it has this tool attached as indicator) and the drawing will show up

This indicator was constructed using decision trees. I will only give a few insights into the algorithm since it is original. But there are 4 trees in the inputs and by default they are 10. The decision tree logic for buy signals is as follows: If the MACD line is less than certain bullish divergence (determined by the "BUY_TREE_1" and "BUY_TREE_2" variables) The decision tree logic for sell signals is as follows: If the MACD line is greater than certain bearish divergence (determined by the
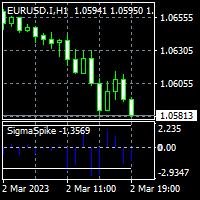
To get access to MT5 version please click here . - This is the exact conversion from TradingView: "SigmaSpikes(R) per Adam H. Grimes" by "irdoj75" - This is a light-load processing and non-repaint indicator. - All input options are available. - Buffers are available for processing in EAs. - You can message in private chat for further changes you need. Thanks for downloading
Transform indicators into trading signals JagzFX OnePin Basic allows a wide range of MT4 Custom Indicators to be transformed into multi-symbol trading signals without the need to write any code. You can use OnePin to create 'At A Glance' dashboards showing your preferred technical indicators and even send buy/sell signals to a PIN compatible dashboard just as JagzFX pinTrader. Whilst I have tried to limit the amount of technical jargon needed to use this PIN, there are a few terms that might nee

The Multi Channel Trend indicator was developed to help you determine the trend direction by drawing channels on the graphical screen. It draws all channels that can be trending autonomously. It helps you determine the direction of your trend. This indicator makes it easy for you to implement your strategies. The indicator has Down trend lines and Up trend lines. You can determine the price direction according to the multiplicity of the trend lines. For example , if the Down trend lines start to

The Hero Line Trend indicator was developed to help you determine the trend direction by drawing channels on the graphical screen. It draws all channels that can be trending autonomously. It helps you determine the direction of your trend. This indicator makes it easy for you to implement your strategies. The indicator has Down trend lines and Up trend lines. You can determine the price direction according to the multiplicity of the trend lines. For example , if the Down trend lines start to

The technical indicator "Reversal patterns" is a mathematical interpretation of the classic reversal patterns: Pin Bar, Harami and Engulfing. That is, the "reversal bar", "Harami" and "Absorption". This indicator allows you to determine the moment of reversal of quotes based on market dynamics and the winner between the "bulls" and "bears".
The indicator displays the moment of reversal at the local highs and lows of the chart of any timeframe, which allows you to increase the accuracy of the
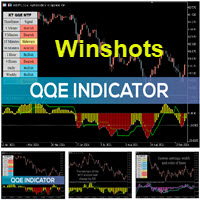
The Qualitative Quantitative Estimation (QQE) indicator is a technical analysis tool developed for the MetaTrader 4 (MT4) trading platform. It is designed to help traders identify potential trend reversals and to determine the strength of a current trend. The QQE indicator is calculated based on the Relative Strength Index (RSI) and Moving Average (MA) indicators. The RSI is used to determine the momentum of price movements, while the MA is used to smooth out the price data and identify trends.
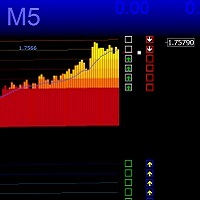
Канал TMA формирует расчёт зеркальным методом, что позволяет плавно компенсировать пробойные удары и точнее определять разворот, канал имеет дополнительную защиту от сужения, канал имеет ускоритель направляющей с заданными настройками, сигналы появляются на возврате направляющей линии, Версия MTF 2023 позволяет индивидуально настраивать канал на другие временные рамки и разные инструменты, возможны доработки, рекомендуется Gold M1 M5
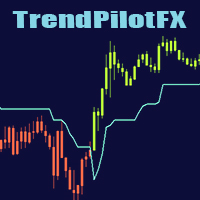
This Mql4 indicator smooths the trend by changing candle colors without altering their size, allowing for better price action reading. It also includes a trend line for trade entry and exit points. Smooth out market trends and improve your price action reading with this powerful Mql4 indicator. Unlike Heikin Ashi, this indicator changes candle colors without altering their size, providing you with a clearer picture of market movements. In addition, it includes a trend line that traders can rely

The product Divergence Macd Obv Rvi Ao Rsi is designed to find the differences between indicators and price. It allows you to open orders or set trends using these differences. The indicator has 4 different divergence features. To View Our Other Products Go to the link: Other Products
Divergence types Class A Divergence Class B Divergence Class C Divergence Hidden Divergence
Product Features and Rec ommendations There are 5 indicators on the indicator Indicators = Macd Obv Rvi Ao Rsi 4 dif
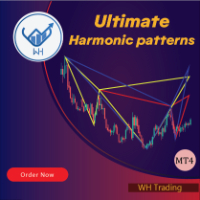
Ultimate Harmonic Patterns 認識インジケーターへようこそ Gartley パターン、Bat パターン、および Cypher パターンは、トレーダーが市場の潜在的な反転ポイントを特定するために使用する一般的なテクニカル分析ツールです。
当社の究極の調和パターン認識インジケーターは、高度なアルゴリズムを使用して市場をスキャンし、これらのパターンをリアルタイムで特定する強力なツールです。
当社の究極調和パターン認識インジケーターを使用すると、これらの人気のあるパターンに基づいて潜在的な取引機会を迅速かつ簡単に特定できます。
※購入後、 説明書と手順ガイドをお送りしますのでご連絡ください。
MT5バージョン: Ultimate Harmonic Patterns MT5 このインジケーターは、主要なフィボナッチ リトレースメント レベルとともにチャート上にパターンをプロットするため、潜在的なエントリー ポイントとエグジット ポイントを簡単に特定できます。
当社のインジケーターには幅広いカスタマイズ オプションも含まれており、特定の取引スタイルに合わせ
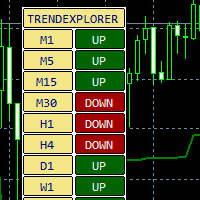
An indicator of the trend direction of a trading instrument on different timeframes. The author's method of calculating the trend is used.
You can enable and disable different timeframes.
Suitable for working with currency pairs, stocks, futures, cryptocurrencies.
Settings:
ATR Multiplier - ATR multiplier; ATR Period - ATR indicator period; ATR Max Bars (Max 10.000) - Number of bars to calculate; Candle shift to Calculate - Report start bar; On/Off Timeframe M1 - Enable differe

"Price reversal arrows" Forex indicator, which shows price reversal points on an hourly chart (PERIOD_H1) with arrows, is one of the most popular tools for traders in the Forex market. This indicator is used to identify the most likely price reversal points, which can help traders make better trading decisions. The "Price reversal arrows" indicator works on the basis of various mathematical algorithms and formulas that analyze data on previous price movements in the market. At the same time, th

This Indicator will notified you when time to entry into the market, build with double william percent range strategy. --> Buy Notification will flag with the blue arrow --> Sell Notification will flag with the red arrow After Flag Appear, the market usually explode but carefully you must performs double check because weakness of this indicator when in the end of the trend

This Indicator will notified you when market going to trend reversal, build with candlestick pattern strategy
--> Sell Reversal Notification will flag with the Yellow arrow
--> Buy Reversal Notification will flag with the Pink arrow
After Flag Appear, the market usually reverse but carefully you must performs double check because weakness of this indicator when market in the middle of the trend
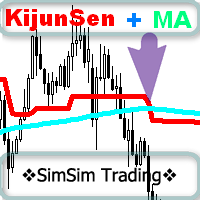
非常にシンプルですが効果的な指標です。
これは、一目インジケーターの KijunSen ラインと、このラインの構築平均 MA に基づいています。 売買シグナル: これは 2 本の線の交点です!!!
私自身、取引には一目指標の基準線をよく使用します。価格が高ければ購入のみを検討し、販売のみが低ければ購入を検討します。
そして、基準線を平均して基準線MAラインを形成した後、2つのラインの交点が現れました。これは、取引のシグナルの増幅として解釈できます。
インジケーターの MT5 バージョンへのリンク:
https://www.mql5.com/ru/market/product/96160
指標パラメータ:
基準線 - 基準線の計算期間。
KijunSen_MA - KijunSen MA の計算期間。
MethodMA - KijunSen MA の価格を計算する方法。
サウンド - 基準線と基準線MAの交差点警報音。
PushMobil - 携帯電話への通知。
エキスパートアドバイザーと通信するための指標バッファ。
バッファ番号で。

M1 GPT Scalping は、金融市場におけるスキャルピング戦略のためのターンキー取引ツールです。 この指標は、M1 (1 分) の期間でチャートのポジションのエントリー ポイントとエグジット ポイントを検出するために使用されます。
M1 GPT Scalping は、価格データの分析とテクニカル分析指標に基づいて機能します。 インジケータは、ポジションからのエントリーとエグジットのポイントを示すチャートに矢印を表示します. インジケーターの精度は 85 ~ 90% です。
M1 GPT Scalper を使用したスキャルピング戦略は、短時間 (数秒から数分) で注文をオープンすることです。 この戦略では、トレーダーは価格の動きに迅速に反応し、ポジションに正確に出入りする必要があります。
インジケーターの使用方法: H1 期間の青い線と M1 期間の赤い線が消え、青い線が表示されたときに、買いの取引を開始します。 赤い線が H1 期間になく、青い線が M1 期間に消え、赤い線が表示される場合、売り取引を開始します。 オプション: Periods - 指標期間

Real Pro Signal indicator is designed for signal trading. This indicator generates trend signals.
It uses many algorithms and indicators to generate this signal. It tries to generate a signal from the points with the highest trend potential.
This indicator is a complete trading product. This indicator does not need any additional indicators.
The indicator certainly does not repaint. The point at which the signal is given does not change.
Features and Suggestions Time Frame: H1 W
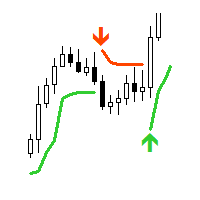
"AV SuperTrend" is an indicator for MetaTrader 4. The supertrend indicator is popular for determining the trend and positioning stops or as trailing support. I use this indicator in several expert advisors for trend analysis.
Supertrend indicator signals can be selected in the form of entry arrows and notifications, as well as various sounds.
Settings :
- Period
- Multiplier
- Alert buy signal: arrow color
- Alert sell signal: arrow color
- Alert yes/no
- Sound: choice or no
-

Binary Options Trading Indicator: A Reliable Tool for Your Trades This indicator is specifically designed for binary options trading and has proven to be a high-quality, reliable, and fairly accurate tool, depending on the chart's dynamics. Key Points: Signal Interpretation: When a blue cross signal appears, it indicates a potential trade entry, although it's considered a weak signal on its own. However, if the blue cross is accompanied by an arrow, it is considered a more reliable signal for b

Short-Term Trading Indicator: The Foundation of Your Successful Strategy This tool is designed for scalping or pip trading in financial markets. It can serve as an excellent starting point for creating your own trading strategy. Key Features: Non-repainting signals: The indicator provides reliable signals that do not change after their appearance. A signal appears on the next candle after the event that triggered it. Excellent signals in high volatility conditions: With good volatility on the ch

Simple supply and demand indicator which should help identify and visualize S&D zones. Settings:
Color for supply zones, color for demand zones - default colors are set for dark (black) background.
Number of how much zones should be created above and below current price - value "3" means there will be 3 zones above current price and 3 zones below current price. Principle:
When price creates "V", reversal zone is registered. Rectangle filled based on zone type (supply / demand) is drawn if pri
The indicator for binary options without repainting is a powerful tool for traders. It ensures signal reliability without altering them after their appearance. Features: Non-repainting signals: The indicator provides stable and reliable signals that do not change after formation. Expiration time: Signals appear at the candlestick opening and expire within one candlestick of the current timeframe. Overlay method: In the event of a losing trade, it is recommended to use the overlay method with an

Perfect Cross Arrows indicator is designed for signal trading. This indicator generates trend signals.
It uses many algorithms and indicators to generate this signal. It tries to generate a signal from the points with the highest trend potential.
This indicator is a complete trading product. This indicator does not need any additional indicators.
The indicator certainly does not repaint. The point at which the signal is given does not change. Signals are sent at the beginning of new can
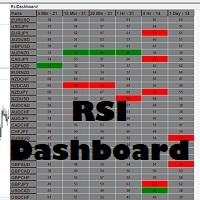
Never miss when a pair is being oversold or overbought again!! This RSI dashboard allows you to monitor RSI levels on 6 different time frames for up to 30 different currency pairs. This dashboard is packed with features including: 1. Monitoring of 6 customizable time frames (M1, M5, M15, M30, H1, H4, D1, W1, M1) 2. You can set the overbought/oversold levels you want for EACH time frame and they will be highlighted in the dashboard when a pair gets to that level
3. You can also set the RSI perio

この指標は、1 日のうちで最大の取引活動の時間を決定するように設計されています。 この計算の後、インジケーターは最も重要な取引レベルを構築します。 これらのレベルを実際の値動きと比較することで、市場トレンドの強さと方向性に関する情報を得ることができます。
指標の特徴 時間枠は D1 未満である必要があります。 推奨される時間枠: M15、M30、および H1。 H1 を超える時間枠は、非常に大まかな状況を示す可能性があります。 また、M15 未満の時間枠を使用すると、取引が短期間で急増する可能性があります。 指標は過去のデータに敏感です。 したがって、チャート ウィンドウに少なくとも 50,000 バーを設定することをお勧めします。
指標パラメータ 基準 - 取引活動を計算するための基準期間を設定します。 day - 取引活動は、時刻を考慮して計算されます。 week – 取引活動は、時刻と曜日を考慮して計算されます。
Width - 線幅。 ClrMean、ClrUp、および ClrDn は、中間、上位、および下位の取引レベルの色です。 Style1 - Style5

1. Strictly speaking, it is not an indicator because it is a real-time position of the main force. It is only displayed through indicators, as it is real-time. 2. There is no drift or future in the indicator. The indicator has a profit of over 300 W in three months, with a winning rate of 99%. The auxiliary arrow indicator was written by me with an old foreigner and spent $5000, which is free for everyone to test.
3. The indicator is applicable to the virtual currency index of gold, crude oil
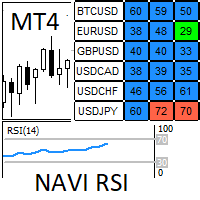
Navi RSI(ナビRSI): 各シンボルとそれぞれの時間枠で、Relative Strength Indexのオーバーバイトまたはオーバーセルのシグナルを探します。 私たちはグラフを非常に快適にナビゲーションし、多くの時間を節約します。 視覚的なシグナルとアラートは、RSIがこのオーバーバイトとオーバーセルの領域にあるときに発生します。 視覚的なシグナルとアラートは、シンボルとタイムフレームの両方で独立して発生し、私たちが不在のときに携帯電話のアラートを管理するのに非常に便利です。 入力パラメータ: 1)スケール&ポジション: 1.1)角を選択する- パネルを配置する画面の角。 1.2)位置X- 角からのX距離。 1.3)位置Y- 角からのY距離。 1.4)列の幅- 列の幅。 1.5)行の高さ- 行の高さ。 1.6)フォントサイズ- テキストのサイズ。 2)スキャン時間: 2.1)モード(onTick / onTime)- 新しいtickごとにデータを更新するか、時間サイクルごとに更新するか。 2.2)onTimeでの更新(秒)- モードがonTimeの場合、データを更新するため
What is the RVOL Indicator?
It is well established that volume (including tick volume) is a valuable indicator of trader commitment to a price movement. The challenge with using volume for intraday trading is that there is a general cycle of increasing and decreasing volume associated with the different regional trading sessions. The Relative Volume, or RVOL, indicator helps to overcome this by comparing the current volume with the average volume for that time of day, calculated over a period

Use my recommended broker: https://icmarkets.com/?camp=61478 You have most likely heard about the term "Less is more". I can tell you one thing that's also the case with the Monkey RSI on Bollinger indicator! One indicator will give you the best of both worlds, easy to determine trend, the strength of the trend and overbought and oversold levels. This indicator is very simple to follow: Green line uptrend Red line downtrend Above band overbought Below band oversold With this indicator you cou

Introducing Daily Hedge - Your Advanced Custom Hedge System for Forex Trading Unleash the Power of Daily Hedge - Your Ultimate Trading Companion Experience the next level of trading sophistication with Daily Hedge, an advanced custom hedge system designed to revolutionize your Forex trading experience. With its cutting-edge features and intelligent algorithms, Daily Hedge empowers you to make informed decisions and seize profitable opportunities like never before. Unlocking Advanced Trading Str

Great Strong System indicator is designed for signal trading. This indicator generates trend signals.
It uses many algorithms and indicators to generate this signal. It tries to generate a signal from the points with the highest trend potential.
This indicator is a complete trading product. This indicator does not need any additional indicators.
The indicator certainly does not repaint. The point at which the signal is given does not change.
Features and Suggestions Time Frame:

This Indicator is use the ZigZag to calculate the Upper and Lower Bound and the uptrend and the downtrned. Red for downtrend, Green for uptrend and Yellow is for the horizontal trend this horizontal trend also bookmarked the upper limited and the lower limited the the price swings. Or in simple the Support and the Resistance level. However, You may use the Heikin Ashi to confirm the trend of the buy sell signal above. I cannot guarantee the win rate, Nevertheless, you must study well the timef
Perhaps you have previously read in technical analysis books about such a concept as "market slope", or "trend slope". Metatrader has such a tool as "trend line by angle". But when working on auto-scaled charts, this tool becomes completely abstract, and as a consequence, useless. The idea of this new parameter, included in the AllAverages_Speed indicator, is to give such a concept as "trend slope" specific numerical values, as well as the further use of the new parameter in work.
Modific

このインジケーターで取引する方法: 赤い矢印が引かれたら、取引を開始します。 青い矢印が表示されたら、買い取引を開始します。
Master Trend Pro - 標準移動平均の回帰平滑化を使用して、価格の将来の方向性を予測します。 矢印の付いたインジケーターは、高い確率で価格が動く場所を示します。 この指標は、M1 および M5 時間枠でのスキャルピング戦略での取引に適しています。 インジケーターが青い矢印を描いてから赤い矢印を描き始めた場合 (またはその逆)、トレンド反転の可能性が高いことを意味します。 インジケーターは、実際の反転の 3 ~ 5 バー前に将来の価格反転を予測することがあります。 これにより、トレーダーは理想的なポジションエントリーの準備をすることができます.
インジケーターの利点: トレンドの変化が始まる 3 ~ 5 バー前の将来の価格変動を予測します。 現在の価格の方向性を示します。 スキャルピング戦略での取引に適しています。
インジケーターの設定: ma_period - 回帰平滑化を計算するための移動期間。

This is a simple arrow system based on MACD indicators Main/Base line and MACD Levels. It gives you alerts when MACD's Main Line crosses above/below certain level. Which type of alerts available? 1. It paints on chart Up/Down Arrows. 2. Popup message and sound alert in trading terminal window. 3. Push notification or Alert on your android and ios mobile phones (requires MT4 or MT5 app installed!)

This is a simple arrow system based on Engulfing Candlestick Pattern. It gives you alerts on your smartphone when there is an engulfing candlestick pattern happens. Which type of alerts available? 1. It paints on chart Up/Down Arrows. 2. Popup message and sound alert in trading terminal window. 3. Push notification or Alert on your Android and IOS mobile phones (requires MT4 or MT5 app installed!) *Note: Use it on higher timeframes like H4 (4 hours), D1 (1 Day) then find trade opportunities on s
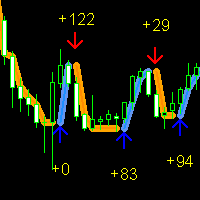
Forex Gump Signal は、ForexGump シリーズの新しいインジケーターです。 このインジケーターは、他のインジケーターとは異なり、標準移動平均の速度の数学的計算を使用して価格反転ポイントを決定します。 移動速度が遅くなると、インジケーターはこれをトレンド反転のシグナルと解釈します。 これにより、インジケーターは最小の価格反転ポイントでもキャプチャできます。 インディケータがより大きな反転ポイントの分析を開始するには、「first_slowdown」パラメータを減らし、「second_deceleration」パラメータの値を増やす必要があります。
利点: スキャルピングに適した すべての時間枠での価格反転ポイントをよく示しています すべての通貨ペアで動作します その値を再描画しません
インジケーターの設定: first_slowdown - 最初の範囲の速度。 second_deceleration - 2 番目の価格帯の速度。 バー - 計算が行われるバーの数とチャート上のインジケーターの表示。 Thickness_of_thick_line - 太い線
This is a MACD indicator which displays an up-arrow/down-arrow on the main chart window when MACD line cross zero and signal line. 1) The arrows on the main chart are very useful to traders because it will draw trader's attention to change of trend or momentum instantly. 2) It is definitely easier and faster than looking at the sub-window at the bottom of the screen. It is an important tool for MACD strategy. 3) User can opt for displaying the MACD cross Signal arrows which are in line with the
Amazing Pro Signal indicator is designed for signal trading. This indicator generates trend signals.
It uses many algorithms and indicators to generate this signal. It tries to generate a signal from the points with the highest trend potential.
This indicator is a complete trading product. This indicator does not need any additional indicators.
The indicator certainly does not repaint. The point at which the signal is given does not change.
Features and Suggestions Time Frame: H

Netsrac "Supply and Demand Easy" is a small but highly specialized tool for quickly finding supply & demand zones without frills. It shows the next supply and demand zone in the current timeframe. Highly efficient and fast. Works perfectly with the Netsrac "Supply and Demand Dashboard" (https://www.mql5.com/en/market/product/96511 ) Controls
Variable Description (SD01) Supply color Set your color for supply zones (default is LightCoral) (SD02) Demand color Set your color for demand zones (defa
MetaTraderマーケットは、開発者がトレーディングアプリを販売するシンプルで便利なサイトです。
プロダクトを投稿するのをお手伝いし、マーケットのためにプロダクト記載を準備する方法を説明します。マーケットのすべてのアプリは暗号化によって守られ、購入者のコンピュータでしか動作しません。違法なコピーは不可能です。
取引の機会を逃しています。
- 無料取引アプリ
- 8千を超えるシグナルをコピー
- 金融ニュースで金融マーケットを探索
新規登録
ログイン