YouTubeにあるマーケットチュートリアルビデオをご覧ください
ロボットや指標を購入する
仮想ホスティングで
EAを実行
EAを実行
ロボットや指標を購入前にテストする
マーケットで収入を得る
販売のためにプロダクトをプレゼンテーションする方法
MetaTrader 4のためのテクニカル指標 - 118

MMDによるダイヤモンド
Diamond by MMD は、価格動向にとって重要な場所を特定する高度な指標です。 このインジケーターは、任意の時間枠で、チャート上の価格反応ゾーンを検出してマークします。 ダイヤモンド - MMD 方法論の知識ピラミッドの要素の 1 つ - は、非常に厳しい条件を満たすキャンドルです。 ダイヤモンドには主に 2 つのタイプがあります。 - 標準ダイヤモンド - 逆認知症。 これらのモデルはどちらも自動的に識別され、チャート上でマークされます。 インジケータは、たとえば H1 間隔の M5 間隔から、ダイヤモンドをマークできます。 インジケーターのデフォルト設定では、現在チャートを開いている時間枠にひし形が表示されます。
指標パラメータの説明。 標準ダイヤモンドを使用 - モデル 00100 のダイヤモンドを表示/非表示にします 逆ひし形を使用 - モデル 0010100 のひし形を表示/非表示にします ダイヤモンドの時間枠 - ダイヤモンドを表示する間隔を指定できるオプション。 たとえば、M1 または H1 ローソク足でチャートの M5 間隔の
Time Line by MMD is a simple indicator that supports historical data analysis and trading on statistical models that follow the MMD methodology.
Start Time - specifying the time when we start analyzing and playing the MMD statistical model Time Duration in minutes - duration of the model and its highest effectiveness (after the end of the line, the price returns - statistically - to the set level) Lookback days - the number of days back, subjected to historical analysis Base Time Frame - the

The Squeezer indicator simply draws ascending lines with Sell signal in the downtrend and descending lines with Buy signal in the uptrend to catch the pullbacks and sniper entries. This is a common successful trading strategy being used by many successful traders, and the good thing about this strategy is that it works with all time frames. The difference is in the take profit level between them. Buy / Sell signals are triggered at the close of the current candles above / below the ascending or
The Bollinger Band is a strategy that has become one of the most useful tools for spotlighting extreme short-term price moves. Bollinger Bands consist of a centerline and two price channels or bands above and below it. The centerline is typically a simple moving average while the price channels are the standard deviations of the stock being studied. The bands expand and contract as the price action of an issue becomes volatile (expansion) or becomes bound into a tight trading pattern (c
Shows price reversal points on the chart. Works on a period of 1 minute. The red arrow indicates that the price will go down now, and the blue arrow shows that the price will go up now. The accuracy of the signals is up to 93% depending on the currency pair. Works on all currency pairs, including the metals gold and silver. The indicator analyzes the current price position relative to the price range for a certain period in the past. The indicator optimizes its data using mathematical modules a
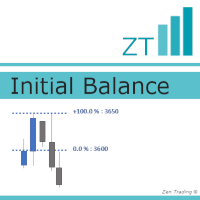
Initial Balance is a concept for the first hour of a trading session, lowest(starting) to highest point, that often determines important support / resistance for the next hours. It is based on Fibonacci levels and offers very relevant levels of reaction. Nowadays, it's mainly used for the first hour BEFORE the open. --------------- The advantage of this indicator lies here : - you could define by yourself the period for YOUR Initial Balance (first hour of a trading session, one hour before the o
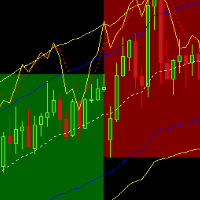
This indicator allows to observe the larger time trends and the stochastic channel on the chart
Indicator Parameters KPeriod - %K period. This is the number of time periods used in the stochastic calculation; DPeriod - %D calculation period Slowing - Slow K calculation period maPeriod - Averaging period maMethod - Averaging method maPrice - Averaging Price LineoverBought2 - line over bought 2 LineoverBought1 - line over bought 1 LineMidle - line midle LineOverSold1 - line over sold 1 LineOv
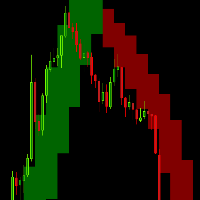
Anyone who is experienced in trading knows that longer time signals are trend signals. That's why it's always good to follow the trends of longer times to make a good trade.
With that in mind, I created the trend indicator in the background
Indicator Parameters TFBar - TimeFrame BackgroundEnabled - Enable Background NumbersOfBars - Numbers of Bar draw ColorUp - Color Up ColorDown - Color Down Smoothing - Heiken-Ashi Smoothing Average

Forex Flow Equalizer is an indicator that helps to reduce 'noise' in forex price movements. Visit https://www.mql5.com/en/blogs/post/751167 for more detailed explanation. It is programmed to enhance traders' focus, and capacity to monitor or manage multiple instruments of interest on preferred timeframe without their minds being over loaded with data or information, thereby, saving them the mental strength for more important trading decision making. Range Mode: is for traders who like to trade

ニューラル バンドはスキャルピング インジケーターです。 売られ過ぎと買われ過ぎのレベルには、2 つの異なる偏差バンドがあります。 色ろうそくは、偏差を通過して強いトレンドを示している場合、または色ろうそくが偏差で停止して平均に戻った場合にトレンドを決定します。 この EA は、価格の範囲とブレイクアウトを取引する回帰指標の一種です。
Neural Bands 2.0 には、再描画矢印が追加されていません。 ニューラル バンドはスキャルピング インジケーターです。 売られ過ぎと買われ過ぎのレベルには、2 つの異なる偏差バンドがあります。 色ろうそくは、偏差を通過して強いトレンドを示している場合、または色ろうそくが偏差で停止して平均に戻った場合にトレンドを決定します。 この EA は、価格の範囲とブレイクアウトを取引する回帰指標の一種です。
Neural Bands 2.0 には、再描画矢印が追加されていません。
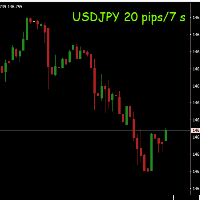
This indicator allows you to view the speed of price movement based on the time set in seconds
Indicator Parameters VisorVelocity_Price_Up_Color - Color to UP price VisorVelocity_Price_Down_Color - Color to Down price VisorVelocity_Price_Zero_Color - Color to Zero VisorVelocity_Price_X_Position - Posicion horizontal in chart VisorVelocity_Price_Y_Position - Posicion vertical in chart VisorVelocity_Price_Size - Size price font VisorVelocityTime - Time to calcule
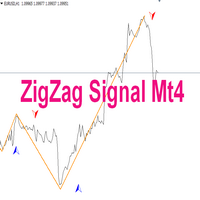
Indicator description: Indicator - ZigZag Signal is created on the basis of a well-known and popular indicator - ZigZag. The indicator can be used for manual or automatic trading by Expert Advisors. 1. The ZigZag Signal indicator has alerts of different notifications for manual trading. 2. If used in Expert Advisors, the indicator has signal buffers for buying and selling. You can also prescribe and call the indicator as an external resource and other settings and applications: (email me in a

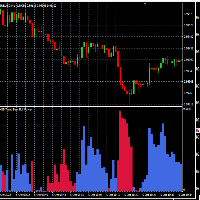
This indicator uses 2 trend filters. Great for scalping. Features alerts Settings: TrendFilterPeriod1 TrendFilterPeriod2 How to use: Attach to any chart with default settings, or set to your preference. Can be used on any time frame. If used on lower time frames, check higher time frames too. Buy : - Blue histo color. Sell : - Red histo color. Or backtest and use as you see fit for your strategy. Best results on Major Pairs, but can also be used on other pairs (Metals, Minors).
Important to no

This tool draws all the pivot point lines on chart. It is important to remind/tell you that there are 5 pivot method according to BabyPips website. All these methods have their unique mathematical formula. 1. Floor Method. 2. Woodie Method. 3. Camarilla Method. 4. DeMark Method. 5. Fibonacci Method. What makes this pivot tool unique is that you can click the "Fibonacci" button to select the pivot method you want. You can click the "Monthly" button to select the Period you want to use for the piv

FX アロー リバーサルは、スキャルピング トレンド向けの単純で複雑でない矢印インジケーターです。 取引選択の任意の方法が使用されます。 トレンドライン、オシレータ、移動平均、チャネル、またはトレーダーが望むその他の方法。 インジケーターは、任意の時間枠と任意の資産で機能します。 資本を維持するためにストップロスを使用します。
インジケーターが機能する方法は、収束と発散、およびトレンドの勢いから導き出されます。 インジケーターがすべての資産で機能するように、ATR が使用されます。 インジケータにはアラートがあります。 FX アロー リバーサルは、スキャルピング トレンド向けの単純で複雑でない矢印インジケーターです。 取引選択の任意の方法が使用されます。 トレンドライン、オシレータ、移動平均、チャネル、またはトレーダーが望むその他の方法。 インジケーターは、任意の時間枠と任意の資産で機能します。 資本を維持するためにストップロスを使用します。
インジケーターが機能する方法は、収束と発散、およびトレンドの勢いから導き出されます。 インジケーターがすべての資産で機
Promotion $66 lifetime for you.
The principle of this indicator is very simple: detecting the trend with Moving Average, then monitoring the return point of graph by using the crossing of Stochastic Oscillator and finally predicting BUY and SELL signal with arrows, alerts and notifications. The parameters are fixed and automatically calculated on each time frame. Example: If you install indicator on EURUSD, timeframe M5: the indicator will detect the main trend with the Moving Average on this

The Trend TRN trend indicator works using a special algorithm and a set of indicators. It finds the current trend based on many factors.
Trend TRN entry points should be used as potential market reversal points. The indicator works using the cyclic-wave dependence function. Thus, all entry points will be optimal points where the movement changes.
A simple and convenient indicator. The user can easily see the trends. You can use this indicator alone or in combination with other indicators ac

Introducing the trend indicator! Ready trading system. The principle of the indicator is to automatically determine the current state of the market when placed on a chart. The indicator analyzes market dynamics for pivot points. Shows the favorable moments of entering the market with stripes. Can be used as a channel indicator or level indicator! This indicator allows you to analyze historical data, and on their basis display instructions to the trader on further actions. To find out how to dete
This indicator allows the visualization of the price movement in multiple chart times, as well as the Bull Market and Bear Market period and its corresponding strength.
Indicator Parameters TimeFramePeriod : Time frame TimeFrameAuto: Auto set next time frame FastPeriodCalc: Averaging fast period for calcule SlowPeriodCalc : Averaging slow period for calcule MultipleForce: force multiplier

マーケット ダイナミクスは、トレンドのスキャルピング用です。 青が買い、赤が売りです。 ラインは価格統合の領域であり、通常のバー ローソク足は未定です。 価格はサポートラインとレジスタンスラインの間で統合され、その後、価格アクションが領域外にブレイクアウトします. 頭皮の上または下の部分をピックし、主なトレンドに従うか、頭皮のデイトレードを行います. マーケット ダイナミクスは、トレンドのスキャルピング用です。 青が買い、赤が売りです。 ラインは価格統合の領域であり、通常のバー ローソク足は未定です。 価格はサポートラインとレジスタンスラインの間で統合され、その後、価格アクションが領域外にブレイクアウトします. 頭皮の上または下の部分をピックし、主なトレンドに従うか、頭皮のデイトレードを行います.

A useful scanner/dashboard that shows the RSI values for multiple symbols and time-frames.
It can be easily hidden/displayed with a simple click on the scanner man top left of the dashboard.
You can input upper and lower RSI values and the colours can be set to show when above/below these values. The default values are 70 and 30. There are also input colours for when the RSI is above or below 50 (but not exceeding the upper/lower levels
Symbols and time-frames are input separated by comma
Dear Traders, check out my new multi level market liquidity indicator : https://www.mql5.com/en/market/product/73098
Many of you have been trading very good with this indicator, thanks for the support and positive feedbacks ! For more information about market liquidity, a manual on how to use this indicator please send me a message. A lot of information can be found on the net. (search liquidity trading/ inner circle trader)
https://www.youtube.com/watch?v=yUpDZCbNBRI
https://www.youtube.c

このソフトウェア ツールは、カスタマイズ可能な 5 色の選択で水平トレンド ラインと長方形を作成するプロセスを合理化するように設計されています。
MT5 で正確な水平トレンド ラインを描くのは難しい場合がありますが、このインジケーターを使用すると、好みに合った色で簡単に作成できます。
さらに、私たちのツールは、あなたが引いた水平線に関連する価格レベルを明確に表示します。
私たちは皆様からのフィードバックを大切にしており、このツールがお客様の取引ニーズにとって貴重な資産となることを願っています。
ぜひご意見をお聞かせください。 ........................................................
トレンドサイド - トレンドを決定するためのテクニカル指標。これは、いくつかの本格的な取引戦略のセットです。このインジケーターは、高度なトレンド フィルタリング システムを使用し、統計パネルを備え、エントリー レベルとエグジット レベルを計算し、動的トレーリング ストップ レベルを計算します。あらゆるタイプのシンボルに適しており、シグナルと結果を再描画しません。プロのトレンド取引のための包括的なツール。
トレンド サイド インディケータのセットには、Andrews トレンド スキャナも含まれています - マルチ通貨およびマルチタイムフレーム トレンド スキャナ、通貨強度アナライザ、可能な反転の分析を備えたマルチタイムフレーム トレンド アナライザ。 3 つのトレンド アナライザーが 1 つの製品に組み込まれています。 インジケーターを購入した後、私に連絡して無料のアンドリュース トレンド スキャナー インジケーター キットを入手してください。 インジケーターとすべての追加パネルについては、完全な説明で詳しく説明されています。このマニュアルでは、インディケータ、すべての入力変数、お
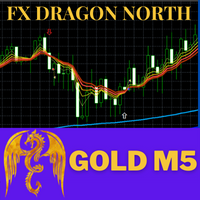
FX Dragon North Indicators is a trend indicator designed specifically for gold and can also be used on any financial instrument. Recommended time frame (XAUUSD:M5,M15,M30,H1,H4.) , (Forex: H1,H4,DAY) Can be combined with EA FX Dragon North X to increase the accuracy of EA FX Dragon North X and make more profit. ... SETTINGS Alerts - on off audible alerts. E-mail notification - on off. email notifications. Puch-notification - on off. Push notifications.

Please follow the "How To Trade" instructions exactly for best results Wycoff theory is vastly used by institutional traders but when it comes to retail traders the concept isn't well understood by most. It is even more difficult to implement in intraday & swing trading. This No REPAINT indicator helps you in analyzing the market cycles and plots buy/sell signals at the start of trending phase. It studies the market strength of bulls and bears and does a effort Vs reward matrix calculation befor

Offer 249 down from 350 for the next 3 copies. then back to 350 $
Are you tired of using outdated indicators that leave you guessing where to set your profit targets? Look no further than the AK CAP Opening Range Breakout Indicator. This powerful tool is backed by a US patent and has already helped countless traders pass funded challenges like FTMO. We use it daily on our prop traders and internal funds, and now it's available to you as well. The calculation behind the indicator is incredibly

Hello;
This indicator presents you with a power matrix of 28 cross pairs made up of the eight most voluminous currencies. Thanks to this power chart, it shows the pairs with the best trend strength and direction. The dashboard offers a basket trading method. So you can make an average profit by trading between pairs with certain correlations.
Input parameter descriptions:
Note_1: Indicates which method the dashboard will use to find the correlation.
Input parameter that allows you to se

Displays multiple trend indicators on the main chart. Great for scalping. Settings: LWMA SMA SSMA EMA ADX (red and blue dots), and PSar Alerts for ADX crosses. How to use: Can be used on any time frame. Buy : - Blue dot first. - Then PSar and 3 MAs cross below price. **Best results when confirming the higher time frames too.
Sell : - Red dot first. - Then PSar and 3 MAs cross above price. **Best results when confirming the higher time frames too. Or backtest and use as you see fit for your str

This indicator takes input from the RSI from multiple time frames (M/W/D/H4/H1/M30), and presents the output as lines above or below the price, on the main chart. Great for scalping. Features alerts for the current time frame's RSI (the Arrows). Settings: RSI period settings for M/W/D/H4/H1/M30/Current. (Set to your preference) PSar settings for trend determination; for current chart's time frame. How to use: Simply attach to M5 (Scalping - zoom chart out completely on M5) or use on higher time

TrendPanel is an indicator that allows you to know the trend of a pair in a given timeframe using 2 moving averages. You can modify the period of the moving averages. Allows you to select which pairs you want to monitor in the input parameters. You can choose as many pairs as you like. You also decide in what time period you want to follow up, there can be several at the same time. In short, TrendPanel gives you the possibility of knowing the trend of a pair in a certain period of time without h

Introduction In the fast-paced world of financial market trading, success often hinges on the ability to spot and leverage trends. Among the various strategies available, momentum trading stands out as a powerful tool for traders seeking to capitalize on market movements. In this article, we will delve into the concept of momentum, its significance in trading, and the numerous benefits it offers to traders. What is Momentum?
Momentum in trading refers to the tendency of assets to continue movin

This is the entry and settings for Pipsurfer EA Strategy 1 in an Indicator form. This was created to help users see the entries that Pipsurfer would take and for those who wish to manually trade the entries. Entry Strategies Strategy 1 - This strategy is a conservative strategy that incorporates trend market structure and momentum with each entry having to meet a large variety of market conditions. The goal of this entry is to buy at the lowest point of a trend pullback and sell at the highest

This indicator is Strategy 2 of the Pipsurfer EA so traders can see where the EA would enter trades at and manually trade with the EA A Smart Money trend continuation strategy that's more moderate but this strategy includes candlestick price action and smart money institutional concepts to find trend continuation moves and hopefully to catch the BIG move that the Banks enter at. There are a full clues that large institutions give before entering and Pipsurfer Strategy 2 is designed to look for

Hello ! If you scroll in one chart, all charts will be scrolled If you change the time frame in one chart, it will change in all charts Of course, you can turn this feature on or off All the charts in which you want changes to be applied are specified through ID in the indicator settings You can scroll the charts of different time frames in two ways at the same time 1: Coordinated based on time That is, 1 hour candle is 60 candles one minute back 2: scroll in the form of number of candles That i

This MT4 indicator has been designed to be used on any currency pair and any time frame . It has the scalper and swing trader in mind. The indicator looks for short-term high-probability reversals in price and will indicate to you to go long (buy) or short (sell) if you see a green or red arrow next to the current candlestick respectively. The indicator provides the best trading opportunities to you during the active trading hours of London and New York, but it will continue to give signals all

This MT4 indicator has been designed to be used on any currency pair or indices and on the daily time frame or higher . The indicator looks for medium-term high-probability continuations in price and will indicate you to go long (buy) or short (sell) if you see a green or red arrow next to the current candlestick respectively. The indicator paints an arrow when the specific criteria are met, however, you must wait until the current candlestick has closed until you enter a trade . Therefore you w

This MT4 indicator has been designed to be used on any currency pair, but not indices, on the ONE HOUR time frame only . This indicator has the highest win rate of all my indicators but it is not perfect and there is no holy grail in trading. The indicator looks for short-term high-probability trend continuations in price and will indicate you to go long (buy) or short (sell) if you see a green or red arrow next to the current candlestick respectively. The indicator paints an arrow when the spe
Simple Market Line Price Color
This indicator allows you to see the market's aggregation by buying or selling on the price line.
when it is attacked the sale turns into a color when it is attacked the purchase takes on another color
Indicator Parameters
indicator_colorUP - Color of UP price aggregation indicator_colorDown - Color of Down price aggregation indicator_WIDTH - WIDTH Line in chart
Good Trades
This indicator allows you to see the market's aggregation by buying or selling on the price .
when it is attacked the sale turns into a color when it is attacked the purchase takes on another color
Indicator Parameters Price_Up_Color - Color price to UP Price_Down_Color - Color price to Down Price_X_Position - Position Horizontal Price_Y_Position- Position Vertical Price_Size - Size font

The ASRS is a powerful support and resistance custom indicator that can help traders determine the level of support and resistance values. This indicator is built using the MQL4 programming language and is used in the MetaTrader 4 platform. Metatrader 4 (MT4) doesn't provide any support and resistance indicator, making ASRS an essential tool for traders. This indicator also suitable for all time frames and all markets, including indices, forex, and more. ASRS can works intelligently and accurat

Afidealn - インディケータはバイナリ オプション用に設計されています!
矢印インジケーター Afidealn は、期間で最良の結果を表示します。
M1 M5 M15 もういらない!
青い矢印を上に置きます
赤い矢印を下に置く
信号は、10 ~ 15 秒の遅延で現在のろうそくに表示されます。
Afidealn は、このような信号遅延のために、いくつかの指標に取り組んでいます。
マルチカレンシー!さまざまな通貨ペアで動作し、結果は優れていました。
また、おすすめインジケーターはニュースに非常に敏感です。
ニュース中に取引することはお勧めしません
最良の結果を得るには、2 分間取引を開始することをお勧めします
通貨ペアドルユーロは彼にとって最高です!
テストして結果を確認してください!
KFX RSI Dashboard uniquely monitors RSI levels on multiple currency pairs (selectable by you) at once and displays them in a two-column list of lower timeframe and higher timeframe (selectable by you). The currency pairs are the combinations of the major currencies (USD, EUR, GBP, CHF, JPY, CAD, AUD, and NZD). All the currency pairs are sorted automatically based on RSI Levels from this the indicator allows one of two output options:
1. Currency Strength OR 2. RSI Level
What's the Str

This Indicator is designed to show past trade entries and exits on calculations from level crossed. It can be used on any chart. It will show past losses, profits and profits minus losses. User can change indicator's basic settings and the results shown will change. Indicator will work on running charts too. Past no. of bars will enable indicator to calculate set no. of past period of candles.

Hi Trader, We are strategy development for Binary and Forex tools, our product have success for binary trading 1 min - 2 min experation. At the moment I build indicator for trading all day, not like Bonosu series with specific time. We launch A-Boss Stats Indicator for trading 1 minute to 5 minutes experation is mean can trade from 1 minutes - 5 minutes. Specification of A Boss Stats trading binary option: Work with all MT4 broker. Chart Time Frame M1 only, can use M5 Experation time for contact
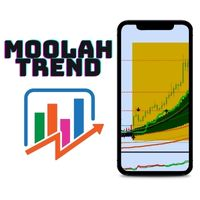
The Moolah Trend is a proven trading method that enables one trade the ranging market and the trend all on the right side of the market. The entire trading strategy is comprised of basically 5 mt4 plugins to support it. Send me a direct massage after purchase so I can forward you the bonus plugins and template file with a video for installation and how to trade the strategy.
The Cross Period Moving Average Support Resistant Map puts multiple latest updated MA value in the same window.
Useful for trend and breakout traders to identify support and resistance at a glance. Highlighted with multiple line width for each period. MA type : SMA MA price : candle close price MA periods: H1 , H4 , D1 , W1 , MN
**if you have any enquiry, contact me at : pipsstalker1507@gmail.com

Trend Lines contiuous Signal (FREE one WEEK) This indicator draws current trend line and provides Buy/Sell Signal based on calculations on Higher frame (Trend) and Lower frame(Entry signals)
* You should select the higher and lower frame for indicator calculations * You select the Trend line colors as you prefer * Enable or disable Alerts! Trend lines UP/Down are drawn when a trend is detected Wait for small arrows for entry : *Normally an UP arrow in an UP Trend is a BUY signal : ---you Clo
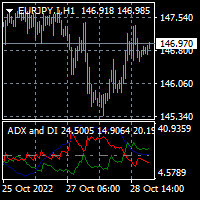
To download MT5 version please click here . This is the exact conversion from TradingView indicator: "ADX and DI" By " BeikabuOyaji". This is probably the most popular implementation of Average Directional Index available. This indicator lets you read the buffers as below: index 0: DIPlusBuffer ==> Green Line by default index 1: DIMinusBuffer ==> Red Line by default index 2: ADXBuffer ==> Navy Line by default - You can message in private chat for further changes you need. Note: This is a non-rep
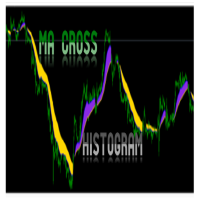
MA Histogram is MT4 Indicator for beginners which plot a histogram after Moving Average Crossover of 2 MAs. The Indicator does not have arrow or alert. It will simply plot on chart the potential Up and Down trend when trend is beginning or ending. It will show a Blue color for potential up trend and Gold color for potential down trend. Recommended pairs: All MT4 pairs including Indices You can change inputs to suit your Moving Average cross parameters and color for histogram.
Get for Forex MT
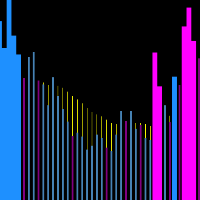
Trend Show Volume
This indicator allows you to visualize volume distortions. When the volume increases by x percent we have different colors and sizes plotted.
Indicator Parameters pPercentShow - Percentage of volume on which different colors and sizes will be plotted pLength - Average applied to volume [background bar] pModeMA - Type of media applied to the volume
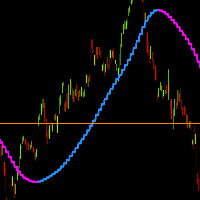
[Trend Price Actions ]
This indicator allows you to plot higher time moving averages on lower time charts with color trend change indicator.
[Indicator Parameters] [pTimeFrame] - [Timeframe for calcule moving average ] [pTrendPeriod] - [Period moving average] [pTrendPrice] - [Price of moving average] [pTrendPow] - [Power of the moving average movement]
...
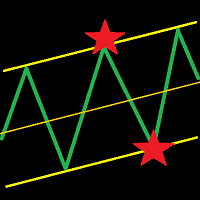
This indicator draws a trend line and a trend tunnel on the chart. You can choose several calculation methods, alerts, notifications, and other settings. It can also draw trendlines from another TimeFrame. You can also use this indicator for your ExpertAdvisor. The current values of the lines are stored in the memory buffer from where the EA can load them. You can trade the price bounce from the upper and lower lines . Settings TimeFrame – trend timeframe Description – show description of line

このインジケーターは、移動平均の組み合わせを使用します。
最初から、非常に簡単ですが収益性の高い戦略パターンを特定することができます (初心者のトレーダーでも見逃すことはありません)。
ユーザー用に定義済みの入力パラメーターが付属しています。 すでに定義されたパラメーターにもかかわらず、ユーザーは好みや好みに合わせて色のみを変更できます。
パラメータが組み込まれているため、移動平均パラメータの変更について心配する必要はもうありません。
あなたが使うすべてのペニーの価値があります.
更新されたバージョンの機能
1.移動平均線が交差した場合にアラートを送信します
2. 移動平均線のクロスでの売買のアラート
3.アラートが送信されると、注文する価格(アスクまたはビッド)が通知されます アップデート版をお楽しみください。 レビューとコメントを残してください。

CURRENTLY 20% OFF Pips breaker pro indicator MT4 Version and definitions : **Please contact us after your purchase and we will send you the complimentary indicators to complete the system.**
This indicator does not send any signal without a reason...You can observe and analyze the indicator and the signals it sends Cycle Sniper is not a holy grail but when you use it in a system which is explained in the videos, you will feel the difference. We recommend watching the videos about the india
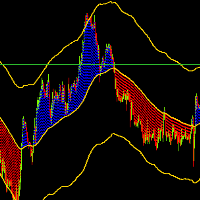
OrionZ
This indicator allows you to view the price trend and channel. When the price is above the average we have a trail color when the price is below we have another
Indicator Parameters [pTimeFrame] - [Timeframe for calcule moving average] [pPeriod] - [ Period moving average] [pMethod] - [ Method moving average] [pPrice] - [ Price applied moving average] [ChannelSpace] - [ Channel space between the average price]
This indicator will mirror the assets in use in another Metatrader, being able to choose the timeframe and a template. This is the Metatrader 4 Server, it can work with Metatrader 4 or 5 Client versions: Metatrader 4 Mirror Chart Client: https://www.mql5.com/en/market/product/88649
Metatrader 5 Mirror Chart Client: https://www.mql5.com/en/market/product/88650 Details of how it works in the video.
任意の通貨ペアと任意の時間枠のスキャルピング インジケーター。この指標は、市場の規則性の法則に基づいて、価格が反転する可能性のあるポイントを矢印で示します。インディケータはシグナルを再描画しません。矢印が表示されると、インジケーターは携帯電話や電子メールでトレーダーにシグナルを送信できます。インジケーターの設定は非常に簡単です。シグナル「期間」を設定するためのパラメーターは 1 つだけです。このパラメーターを変更することで、インジケーター信号と数値の精度を変更できます。
この指標で取引するための準備が整った取引戦略: 任意の通貨ペアにインジケーターをインストールします。 推奨期間 M5、M30、H1。 インジケーターの矢印が表示されるのを待っています. 青い矢印が表示されたら、買い注文を出します.赤い矢印が表示されたら、売り注文を出します。 TakeProfit は 25 ポイントに設定されています (主要通貨 GBPUSD、EURUSD で取引する場合)。 StopLoss は 55 ポイントを置きます。 ロットサイズは残高の大きさに応じて決定されます。 $200 の残高ごとに
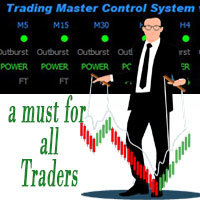
トレーディングマスターコントロールシステムの特徴
TMCS は、アセットのステータスを一度に表示するためのツールです。 TMCS はすべての時間枠を表示し、トレンド、取引力を示し、取引シグナルの取引力アラートに基づいて計算します。インジケーターは、ボリンジャー バンドからのブレイクアウトを計算します。また、非常に重要なことに、時間枠がフラットな場合、実際の取引力がないことを意味します。詳細については、スクリーンショットとビデオ チュートリアルの説明を参照してください。
プラットフォーム: Metatrader4
通貨ペア: 任意のペア、指数、金属 取引時間:24時間 時間枠: 任意の時間枠 指標のアルゴリズム
インジケーターは、ADX に基づいてすべての時間枠の全体的な傾向を計算します この指標は、Tickdata とビッド & アスク量に基づいて価格変動の力を計算します インディケータは、すべての時間枠のボリンジャー バンドからのブレイクアウトを計算し、非常に高いパワーでの爆発と反転の機会を示します。 インジケーターは、すべての情報に基づいて平均値を計算し、資

This indicator helps to identify market sessions, It's High/Low, Open Range (OR), range of the sessions in pips and percentage of previous day (change%) under OHLC.
It is also editable for any brokerage market watch time. For traders who use session trading strategies such as Mark B. Fisher ACD it can be super effective, where they can edit OR from the settings to either line or box. We tried to make the settings easier to edit, for traders' use on different markets, charts and brokerage time.
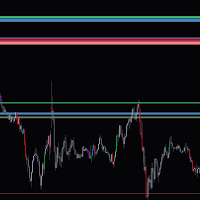
This indicator shows zones based on daily candles in the chart , Make sure you have enough daily bars in the chart before loading the indicator to the chart, These zones can act as both supply and demand zones. The zones are not subjected to repaint. If you have less zones or no zones for current prizes under the default inputs, try increasing the past days input and the zone sizes values gradually. If you have more zones than you need in chart try decreasing the past days and the zone size val
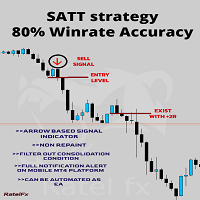
SAT strategy (Systematic Approach Trading Technique)
This is a revolutionary new way of trading the financial market.
This is the top indicator system that provides the most accurate trading signals for both entries and exits.
This system indicator algorithm provides the most accurate and precise signal only during the highly impulsive phase of the market.
This system indicator performs well during a high volume period, which is only the first three hours of a specific session, whethe
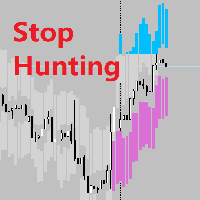
Realtime Stop Hunting Background What Is Stop Hunting? I refer to the definition of Stop Hunting from Investopedia, Stop hunting is a strategy that attempts to force some market participants out of their positions by driving the price of an asset to a level where many individuals have chosen to set stop-loss orders. The triggering of many stop losses at once typically creates high volatility and can present a unique opportunity for investors who seek to trade in this environment. Setting up the

The Qv² Histogram - Indicator developed for traders with advanced experience. This indicator has two purposes: 1-) Identify price normality patterns (green color) 2-) Identify abnormal price patterns “outliers” (red color) ====================================================================================================================================== Interpretation for trades in start trend: Histogram (Green color) crossing the zero line upside - uptrend. Histogram (Green color) crossing th

Современный индикатор паттернов PPR по торговой стратегии RAIT. Работает по тренду и без него. Имеет настройки таймфрейма для отображения. Можно настроить количество баров для отображения индикатора на графике. Используется несколько паттернов PPR. Индикатор предпочтительно использовать на часовом таймфрейме и выше, но работает и ниже . Паттерны: PPR, PinPPR, OutPPR. Отображаются одной стрелкой.

Buy and Sell Targets Indicator You can see the buying and selling goals in the box and they are inevitably achieved. It consists of three lines: the first green color sets buying targets, the second red color sets selling targets, and the third blue color is the average price. Trading Method For Buy Trade: The entry point will be where the wavy blue line (representing the average price) is 'broken' by the ascending 'Buy' candle from beneath Please wait until the next candle appears to enter int

ICT Core Content Concepts turned into indicator plus all previous tools known from the Position Smart Indicator . This makes it the Full PSI Private Version ( read more ) restricted up to now but available only after the Mentorship Core Content was made public on YouTube. You will find many price action study tools like: Central Bank Dealing Range - CBDR Asian Range FLOUT Profiles and SD targets on the CBRD, Asian Range and Flout both on the wicks and on the bodies Seek & Destroy Profil

平均価格バー (APB) は修正された平均足タイプのローソク足です。平均足は、「平均棒」として翻訳された日本語の用語です。したがって、名前は、Average Price Bars です。平均価格バーは、現在の高値、安値、および終値アクションの「チョッピネス」と呼ばれることが多い名目価格アクションの変動を排除または削減することにより、現在の市場をより適切に描写します。
平均価格バー (APB) は修正された平均足タイプのローソク足です。平均足は、「平均棒」として翻訳された日本語の用語です。したがって、名前は、Average Price Bars です。平均価格バーは、現在の高値、安値、および終値アクションの「チョッピネス」と呼ばれることが多い名目価格アクションの変動を排除または削減することにより、現在の市場をより適切に描写します。

Hi! Between the given time range. Adds profit and lot. This can be written on the charter in English and Hungarian. The name of the symbol must be entered exactly. Good used for it. :)
Szia! A meg adott idősáv között Összeadja a profitot és lot-ot. Ezt ki írathatjuk Angolul és Magyarul a chartra. Pontosan kell beírni a szimbólum nevét. Jó használatott hozzá. :)
Best Solution for any Newbie or Expert Trader!
Forex Support Resistance is a unique, high quality and affordable trading tool because we have incorporated a number of proprietary features. it calculate highest high and lowest low of Previous X bars with possibility to select timeframe as desired . also it display the values of highest high and lowest low of Previous bar as a comment at the main chart . Imagine how your trading will improve because you are able to pinpoint the exact trigger po
MetaTraderマーケットが取引戦略とテクニカル指標を販売するための最適な場所である理由をご存じですか?宣伝もソフトウェア保護も必要なく、支払いのトラブルもないことです。これらはすべて、MetaTraderマーケットで提供されます。
取引の機会を逃しています。
- 無料取引アプリ
- 8千を超えるシグナルをコピー
- 金融ニュースで金融マーケットを探索
新規登録
ログイン