Guarda i video tutorial del Market su YouTube
Come acquistare un Robot di Trading o un indicatore
Esegui il tuo EA
hosting virtuale
hosting virtuale
Prova un indicatore/robot di trading prima di acquistarlo
Vuoi guadagnare nel Market?
Come presentare un prodotto per venderlo con successo
Nuovi Expert Advisors e Indicatori per MetaTrader 4 - 237

The robot is intended for trading on a real account. Two channels are being constructed: Hilbert Raff and John Bollinger. The external Raff channel allows you to determine the direction of the global trend. Inside it, in the Bollinger channel, trade is conducted on a trend. Provision is made for disabling martingale and money management, transactions are protected by stop-loss. Features of the trading strategy The robot calculates two channels. The external channel is calculated by the method of
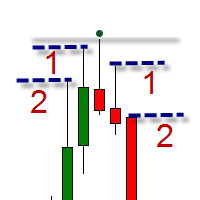
The indicator is intended for swing trading. The indicator is able to determine the trend and important trend peaks (swing), which will be important support / resistance levels. Features Simple visual displaying of 3 types of swings: Minor swings - do not affect the trend, but only on the movement within the trend Normal swings - can change the direction of the trend Strong swings - have a double confirmation of the importance of the level Visual displaying of the trend reversal Minimum of se

Market Skanner Baks is a new indicator of market scanner. This indicator is equipped with a new algorithm for determining the trend. Now the trader does not need to analyze dozens of different indicators to determine the direction of the price movement. It is enough to place on the Market Scanner Baks chart and see where the arrow shows on the big and small timeframes. Thus, one can understand the short-term and long-term potential price movement. In addition, the indicator on the completion of

Advanced indicator of a professional trader - is a professional indicator based on the popular Stochastic Oscillator. Advanced indicator of a professional trader is an oscillator with dynamic overbought and oversold levels, while in the standard Stochastic Oscillator, these levels are static and do not change. This allows Advanced indicator of a professional trader to adapt to the ever-changing market. When a buy or a sell signal appears, an arrow is drawn on the chart and an alert is trigge

MMM Relative Strength Index Strategy: The Expert Advisors uses its two built-in RSI indicators to determine the prices trends and calculates the signal to decide to open buy or sell positions. It sends an order, closes or moves the Trailing Stop loss position as the indicator works. You can define the time period of each day of the week the EA should not trade (the bad time to trade). Usually the period of day when the impact news are published. General Inputs Closes orders with any profit of va

This Expert Advisor is based on previous candlestick's price direction. Seven modes of operation with option to reverse signal. Assuming that current trend can be identified by checking status of one recent candlestick I have added additional strategies: 2/2, 2/3, 3/3, 3/5, 4/5, 5/5 candlesticks. For "1/1 Candles (Mode 1)": if previous candlestick's base currency has increased in value in reference to quote currency (close price is higher than open price) - uptrend is presumed and buy order is p

The expert uses several strategies of pending and market orders for trading. You can setup fully-automated mode or semi-automated mode (you open the trade and the expert manages the rest) . Expert uses advanced trading algorithm with flexible risk management settings.
The expert is applicable to all symbols and also works via the mobile app MT4 .
-- General settings -- Magic number - unique ID (number >=0) for expert transactions Lot size - lot size Stop Loss (0- disable )

The indicator is based on crosses of zeros, but their period is equated to the indicator ATR. An alternative to the XOATRHIST indicator with the channel display on the chart. More informative. Closing a bar outside the channel forms an x or O. The indicator turns on the Alert option. Options: ATRPeriod - period ATR for the calculation of steps. XOPips - manual pips
XOalert - output of the signal to the terminal. XOnotification - sending a signal to the mobile terminal. XOmail - send a

This highly informative indicator applies overbought/oversold levels for more accurate representation of the market situation. All moving average settings are available, including average type and price it is based on. It is also possible to change the appearance of the indicator - line or histogram. Additional parameters enable more fine-tuning, while trading can be inside the channel and along a trend.
Distinctive features Oversold/overbought levels; Does not redraw. Additional parameters fo

The Easy Strategy Builder (ESB) is a " Do It Yourself " solution that allows you to create a wide range of the automated trading strategies without any line of codes. This is the world’s easiest method to automate your strategies that can be used in STP, ECN and FIFO brokers. No drag and drop is needed. Just by set conditions of your trading strategy and change settings on desired values and let it work in your account. ESB has hundreds of modules to define unlimited possibilities of strategi

This indicator works periodically and continuously depends on the numbers only and some complex mathematical equations, will give you more than wonderful areas for sell and buy and middle line, which is for us the first goal and the second goal it’s other area . This indicator is easy to deal with and does not repaint itself that it is constant from the beginning of opening the market if it is daily, weekly or monthly This indicator gives you a very small stop loss for multiple and large Target

Primus Trading Engine is a trading system that combines price action,ratio based indicators & custom indicators to create this leading indicator with a multi-timeframe approach to give you high probability trade setups for forex,CFD cash/futures,metals & binary option to assist in making predictions on what is MOST likely to happen in the market Main Chart Features Price Action Signal-Arrow displayed on a specific bar;NOT buy/sell arrow;DOES NOT repaint;Bullish arrow on a bullish bar,price is l

Highly configurable Stochastic indicator.
Features: Highly customizable alert functions (at levels, crosses, direction changes via email, push, sound, popup) Multi timeframe ability Color customization (at levels, crosses, direction changes) Linear interpolation and histogram mode options Works on strategy tester in multi timeframe mode (at weekend without ticks also) Adjustable Levels Parameters:
Stochastic Timeframe: You can set the lower/higher timeframes for Stochastic. Stochastic Bar
FREE

This indicator is used to visualize the profit of closed and open orders on the symbol. To control using four buttons which are located on the chart after the indicator is started: Button "C" - show/hide on chart open and close points of closed orders from account history by current symbol; Button "O" - show/hide on chart open points of opened orders and distance between open point and current order close price point; Button "$" - show (if button "C" and/or button "O" activated) / hide every ord

Kappa Trender is a unique indicator that will recognize trend direction and give you dynamically changing values for stop loss accordingly to further market movements and unique target calculations (take profit or trailing stop loss) based on last market movements. Even if you miss the signal (or close last trade at TP), this tool will give you range of price where you can re-enter with good risk-to-reward relation or you can enter manually and use current stop loss and take profit values. How

Primus Smart Money is an indicator that shows the average of bulls and bears on an asset. Used as a confirmation indicator for bullish and bearish control to assist in predicting future price moves Advantages Used in ALL financial markets including binary options on ALL asset classes or instruments. To be used as a confirmation tool with other indicators Parameters Period - default set to 9 (Recommended) Entry requirements Focus on the clusters on the indicator - the height or depth of the bars

The block of bars is collected under condition of divergence . If the divergence conditions are not met, the block is deleted. More precisely, the condition is the transition of the block of bars from the state of divergence to the state of convergence . Blocks are formed selectively with gaps. Gaps are characterized by the state of convergence of bars. Before removing the block, we find the extreme bars inside the block (min, max). The line connects the extreme bars. The line is drawn only
FREE

The block of bars is collected under condition of convergence . If the convergence conditions are not met, the block is deleted. More precisely, the condition is the transition of the block of bars from the state of convergence to the state of divergence . Blocks are formed selectively with gaps. Gaps are characterized by the state of divergence of bars. Before removing the block, we find the extreme bars inside the block (min, max). The line connects the extreme bars. The line is drawn on
FREE

Magikarp Steady Flow EA is an intelligent fully automated robot that utilizes hedging, trending and martingale. This strategy uses Moving Average Convergence Divergence (MACD), Relative Strength Index (RSI) and Moving Averages (MA) for trends. Based on configurable lot values, the EA places orders by trend and Average True Range (ATR) data of the used symbol. The strategy is based on utilizing trend direction changes and optimizing order size and price placement. Whenever a trend direction chang

MathScalperPro
MathScalperPro is an automatic trend trading system based on mathematical calculations. The Advisor calculates the trading levels of price corrections and enters the transaction in the direction of the trend. Inputs on levels are possible in two ways. The first way is to enter the candlestick pattern 1-2-3, and the second way is to enter the change of direction of trade in the younger period. Each trading pair has its own settings, which you will get when buying this Expert Adv

Chicken peck rices This is a short-term EA what based on price breakthroughs,and the parameters are simple and adaptable. Requirements: Run timeframe: H1; The type of account:ECN,spread of currency≤3,for example,EURUSD,USDJPY,and others. The minimum spread for order modification:0,it means that the minimum distance is zero between setting stop loss or take profit and current price. You must use the required accounts to ensure the reliability of profit. Input parameters: explanation=chicken peck
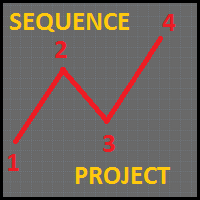
This Expert Advisor is a very advanced sequential tool that gives each user the possibility to program
the order of tasks according to specific conditions.
Everything can be done in a simple and intuitive way.
The sequencing of the EA's programming ensures that each operation is carried out one after another.
I present the method of operation in the attached movie.
EA global settings magic – individual EA number . For each EA attached on the same instrument, a different number must be ent

Skillfully run awayEA is a similar to Martin's EA, from Martin's theory, but the risk is far lower than Martin, built in risk control, so that you are not as open as pure Martin EA, after ten years of historical data retest, repeated modification of the strategy, so far, I have just released, in line with the responsibility of investors and users Prudence is prudent.
On the parameters If you want to hang this EA on different varieties, be sure to set the parameters "bm" and "sm" without interf
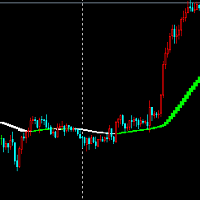
Look at the picture can see clearly, multi-space color index is very useful index.
Indicator parameters can be set at will, I usually use this indicator to measure the judgment of many and empty when trading.
Although the index is delayed, I think the performance and appearance of this index can make you judge the empty, I think the index is a trader's reference.
Color description in the index When the indicator turns green to white, it means that the price rise has ended, or falls or shoc

Панель предназначена для быстрого визуального нахождения и отображения пин-баров по всем периодам и на любых выбранных валютных парах одновременно. Цвет сигнальных кнопок, указывает на направление пин-бара. По клику на сигнальную кнопку, осуществляется открытие графика с данным паттерном. Отключить не используемые периоды, можно кликом по его заголовку. Имеется поиск в истории (по предыдущим барам). Прокрутка (scrolling) панели, осуществляется клавишами "UP" "DOWN" на клавиатуре. Имеется Push-ув
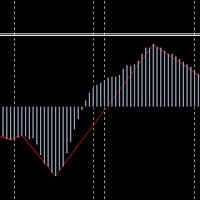
The translation of MACDbeili metrics into English means MACDdeviation. It is based on the requirement of the investor to write the high end EA's artifact, which can get a MACD deviation signal well according to this index. Some investors like to do MACD deviations, and use this index to write EA on the deviation of the MAcd.
Investors know that MACD deviation is a good way to operate, according to the signal of MACD deviation, the success rate is very high.
On the parameters of MACDbeili The

Homeopathic breakthroughs This EA is based on the homeopathic breakthrough principle, according to the wave theory, suitable for any time period of operation. Break through the high point, I write this EA's original intention is to be able to better serve the majority of investors, as long as you feel good is my greatest comfort. On the setting of parameters
This EA parameter is very simple, just use the initial parameters on the line, do not need any settings. EA settings: use the default sett

The advisor works on the basis of a strategy for determining the calm and volatile market conditions, as well as the phases of redistribution of trading activity.
In moments of increased volatility, the adviser analyzes similar price behavior (patterns) in the recent past, and if matches are found (the number of matches is configured by the user in the Strategy Accuracy parameter), the advisor decides to start trading.
Advisor does not use dangerous trading strategies based on lot increase a

Stochdeviation Stochdeviation index is what we usually call the KDJ deviation index, according to this index we can judge whether the market reversal, with my previous MACDbeili index, can effectively filter out some false signals, help investors effectively grasp the top or bottom of the market, deviation is divided into one deviation and two deviations. Deviation, the second deviation shows that the possibility of market reversal is still relatively large, can be very good to help investment t
The block of bars is collected under condition of convergence . If the convergence conditions are not met, the block is deleted. More precisely, the condition is the transition of the block of bars from the state of convergence to the state of divergence . Blocks are formed selectively with gaps. Gaps are characterized by the state of divergence of bars. The indicator shows the convergence value . If the indicator is below zero, the block is not formed and the bars are skipped. If the indicator
The block of bars is collected under condition of convergence . If the convergence conditions are not met, the block is deleted. More precisely, the condition is the transition of the block of bars from the state of convergence to the state of divergence . Blocks are formed selectively with gaps. Gaps are characterized by the state of divergence of bars. The indicator shows the value and direction of the price in the convergence block .
To determine the convergence value, see here , the line of
The block of bars is collected under condition of divergence . If the divergence conditions are not met, the block is deleted. More precisely, the condition is the transition of the block of bars from the state of divergence to the state of convergence . Blocks are formed selectively with gaps. Gaps are characterized by the state of convergence of bars. The indicator shows the di vergence value . If the indicator is higher zero, the block is not formed and the bars are skipped. If the indicator

The block of bars is collected under condition of divergence . If the divergence conditions are not met, the block is deleted. More precisely, the condition is the transition of the block of bars from the state of divergence to the state of convergence . Blocks are formed selectively with gaps. Gaps are characterized by the state of convergence of bars. The indicator shows the value and direction of the price in the divergence block .
To determine the divergence value, see here , the line of ex
AST_personov is an indicator, which presented of the arithmetic average of the ticks. Next to the current price, a line appears with the value of the AST deviation from the current price (in points). If the value is positive, it is green and if it is negative, it is red. What is the arithmetic average of the ticks ? This is the average of the last ticks that the price move. It has nothing to do with bars ( prices Open, Close, High and Low ). Calculations are carried out using ticks. The values c
Some traders don't like expose Take Profit/Stop Loss level in their positions, this Expert Advisor can help them.
Put it to chart and set Take Profit/Stop Loss pips (0 means ignore), it watch the price of the symbol on chart and close the position if price reach Hidden TP/SL level.
It hide user's TP/SL price in effect.
Welcome to contact me.
。。。。。。。。。。。。。。。。。。。。。。。。。。。。。

In indicators the positive scale often unreasonably is accepted though in fact they are the symmetric.
Such property has also standard RSI. The presented indicator works in the scale, symmetric concerning zero,
but at the same time completely repeats an original form. In this indicator important levels 20 and -20.
It is very convenient at its use in automatic trade as application of one threshold by optimization excludes overoptimization.
Besides, the algorithm of calculation of the indi

The advisor determines the candle formations of the two timeframes (current and one timeframe below) and starts working towards the most likely price move. Main analyzable ligaments: Head-shoulders + flag; Head-shoulders + double top; Flag + tapering triangle; Absorption + hammer. Each transaction has a Stop-loss and Take-Profit. Each transaction is independent. Hazardous methods of work are not used. It is recommended to use currency pairs for the default settings: GBPUSD 15m и EURUSD 15m. You

This scanner is a tool used to support trading. Scanner searches on a wide market, in real time setups, created by mutual arrangements of candles (candles pattern). Its basic features are: 8 implemented trading setups (it is possible to add further setups, additional versions of the scanner), the possibility of simultaneous scanning, all financial instruments available on the platform, the possibility of simultaneous scanning, in all timeframes available on the platform, the ability to manua

Simplicity is a necessary condition of beauty (c)
Leo Tolstoy
This expert was developed for the 2008 championship. In that year he took 25th place.
The recommended tool is GBP, timeframe M30.
Transactions are opened to return to the calculated midline.
Expert Options:
minlot - the minimum lot;
maxlot - the maximum lot;
UseEquityStop - use stop by equity;
TotalEquityRisk - percentage of drawdown;
slip - slippage.

The indicator defines the Bullish and Bearish Engulfing Bar. The pattern has greater reliability when the open price of the engulfing candle is well above the close of the first candle, and when the close of the engulfing candle is well below the open of the first candle. For an engulfing bar to be valid it must fully engulf at least one previous bar or candle - includes all the body and the wick. The engulfing bar can engulf more than one bar as long as it completely engulfs the previous bar.
FREE

Vertical time lines. A simple indicator that draws on the graph vertical lines of time. 1,3,5,10,12,15,20,30,60 minutes. You can change the line color, line style, select a time period from 1 to 60 minutes. Applies to any chart, timeframe. Incoming parameters: Minute_Num = 20; // step 3,5,12,10,20,15,30,60 minutes color Line_Color = clrYellow; // color line Line_Dash = 2; //0,1,2,3,4... solid, dash, dot, dash dot,dash dot dot
FREE

This EA keeps an eye on drawn lines and opens orders according to a specification. Together with the included tool Trendline-Architect, which calculates and draws lines over the chart, it is a fully automatic EA.
There are two types of trends:
Trend A: the line is drawn using local lows for uptrends and local highs for downtrends
Trend B: the line is drawn using local highs for uptrends and local lows for downtrends
A few conditions have to be fulfilled. To understand and change
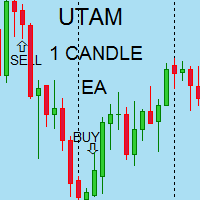
I speak in Hungarian. Magyarul beszélek benne. (Első felvétel. https://youtu.be/MapbQrJ0uPU Első felvétel. https://youtu.be/i2id5O1KPrI Második felvétel. https://youtu.be/Zp2i7QN-IMc Első felvétel. https://youtu.be/h7UbTWiM-Lw Második felvétel. https://youtu.be/y54q4Rasf2A Harmadik felvétel. https://youtu.be/13zYjsoe6ZQ Negyedik felvétel. https://youtu.be/NGiB1AnxxfU ) Nice Day Signalos! Positive building candle. If the previous body closes the candle over the candle. Buy takes. If the previous

PABT Pattern Indicator - it's classical system one of the signal patterns. Indicator logic - the Hi & Lo of the bar is fully within the range of the preceding bar, look to trade them as pullback in trend. In the way if indicator found PABT pattern it's drawing two lines and arrow what showing trend way. - First line - it's entry point and drawing at: 1. On the high of signal bar or on middle of the signal bar (depending from indicator mode) for buy; 2. On the low of signal bar or on middle of t
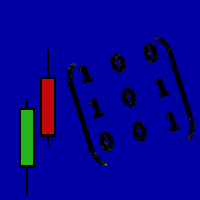
We highly recommend you running this expert at EURUSD H1. Linear Regression Trader employs the mathematical model of linear regression for smoothing price movements and trend recognition. Best results can be achieved when trading at the change of the trend or when the prices form a triangle, rectangle or similar patterns. Uses libraries for executing operations with matrices, already included into EX4 file. The principles of work:
Define the tangent coefficient of the line for the Large period
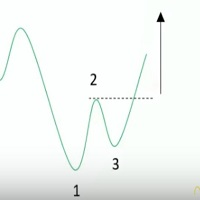
Ross Hook is a price pattern indicator that help traders to forecast market inversions. The activation of the pattern could identify turning points by finding the breakout SR levels or technical analysis figures like triangles, rectangles or head and shoulder. The Indicator runs in all Brokers using Metatrader 4 platform and can be used in an Expert Advisor or as a support of manual trading. This indicator is composed by the OnChart and OnWindow parts: OnChart : Draws the points 1, 2 and 3 t

Can be used on EVERY instrument. Based on the "Zone Recovery" strategy. Suggested TimeFrame: H1 and H4.
How it works
Zone Recovery is an advanced hedging system. When the market goes against the first trade (based on Bollinger bands) the EA will open an opposite trade with slightly bigger lot size. If the market keeps moving in this new direction, at some point the profit from the profit trade will overtake the loss trade and will close both the trades otherwise will do the opposite. This b
FREE

Money Management Parameters (параметры управления капиталом)
UseMoneyManagement - Управление капиталом включить или выключить. Допустимые значения: true / false Lots (по-умолчанию: 0.1 ) - Размер позиции RiskInPercent (по-умолчанию: 2.0 ) - Риск в процентах при включенном управлении расчёта позиции MaximumLots (по-умолчанию: 500 ) - Максимальный объем лота. Значение по-умолчанию: UseFixedMoney (по-умолчанию: false ) - Задействовать весь капитал счета в процентах или нет. Допустимые з

Due to the huge success of the limited free version, the now low priced LOTUS version will continue being updated in the future.
Optimal for Binary Options and Forex. For beginners and intermediates. Lotus is 100% non repaint. The strategy is based on 4 ADX parameters, including pivot points and candle patterns. It is recommendable to combine the arrow with an moving average, Elliot waves indicator or Parabolic SAR. The main goal was to keep it as simple as possible ! No useless oscillators

PanelTool Button Click trading (Replace Default Trade Panel)
Features
01. Button Click open or close Long positions
02. Button Click open or close Short positions
03. Set Lot sizes
04. Set SL or TP points
05. Set order's commentment
06. Show BreakEven price
07. Show Long or Short Lots
08. Show Profit or Loss USD
09. Show Daily Profit or Loss USD
10. Set ID=0 to handle manual orders together
FREE

Индикатор отображает различными цветами на фоне графика три торговые сессии. Открытие - закрытие Лондон, Нью Йорк, Токио по умолчанию. Применение Для успешной торговли важно знать начало и конец торговых сессий с наибольшей ликвидностью, так как именно в это время цена делает самые большие движения.
Особенности Настройки по умолчанию - торговые сессии по Лондону, Нью Йорку, Токио. Возможность выставить свои рамки тоговых сессий Алерт при открытии сессии Показ открытия дня по GMT Настройки для
FREE

The SDX Chart is a free additional indicator which can be used in combination with SDX Dashboard .
Features Ability to review the history of each symbol and time frame. Ability to change symbols and time frames with one click. Works perfectly in combination with SDX Dashboard and helps you to understand the system better. Settings
MA Period - number of periods for the calculation of the moving average and the standard deviation. Number of Bars - how far back to draw the indicator. Buttons Siz
FREE

Trend indicator derived from T3 moving averages. The cloud is bounded by a fast T3 and slow T3 lines. Buying/Selling opportunities above/below cloud. The fast and slow T3 MA lines can also be used as dynamic support/resistance for more aggressive entries. Use default values for best settings. The number of look back bars is user defined. This indicator can be used in combination with other strategies such as price action. Suitable for all time frames. Prerequisites: T3IndiSlow and T3IndiFast in
FREE

Waddah Attar Mini Close Graphical Panel EA .
This EA does not Trade with built in Strategy .
It is shows you your orders information in a table mode . You can close any group of your orders with mouse click . The table contain : Type : Buy + : means all buy profit orders . Buy - : means all buy loss orders . Sum : means all buy orders .
Sell + : means all sell profit orders . Sell - : means all sell loss orders . Sum : means all sell orders .
Total : means all orders . North : means a
FREE

Fast T3 MA Trend indicator derived from T3 moving averages. This indicator is part of the T3 Cloud MA indicator and is posted here on its own. Buying/Selling opportunities above/below line. The MA line can also be used as dynamic support/resistance for more aggressive entries. Use default values for best settings. The number of look back bars is user defined. This indicator can be used in combination with other strategies such as price action. Suitable for all time frames.
FREE

Slow T3 MA Trend indicator derived from T3 moving averages. This indicator is part of the T3 Cloud MA indicator and is posted here on its own. Buying/Selling opportunities above/below line. The MA line can also be used as dynamic support/resistance for more aggressive entries. Use default values for best settings. The number of look back bars is user defined. This indicator can be used in combination with other strategies such as price action. Suitable for all time frames.
FREE

All what you need before start a trade
network connection/broker's/symbols/historical orders benchmarks/currnet orders status
01. symbol's trading privilege
02. order execution mode
03. trade session hours
04. min lot/max lots
05. max pending orders
06. freeze point pending order's distant points (zero is good)
07. Min SL/TP points required by broker if open an order (zero is good)
08. account leverage
09. Margin call open an order must > 100%
10. MarginStopOut forced to close som
FREE

This EA exploits the inevitable behaviour of price fluctuations and breakouts. Because market prices will always fluctuate to higher highs before ebbing down to lower lows, breakouts of these levels will occur. This EA will open a trade in anticipation of catching some of the profits from these breakout moves. We use the fixed exit methods of Stop Loss, Take Profit and Trailing Stop in such a way so that we will scalp small but consistent profits.
No martingales needed, just a simple but e

Virtue Multi Lot "Virtue" is a fully automated Long term Expert Advisor. It calculates market condition itself and decides to enter a position. This is the main position. After that position, it adds some small lots for scalping. You can select how many orders will be open extra. It depends on your account margin and risk managment.
"Virtue" needs patience that is the why its name Virtue. Patience is a virtue. You must be patient to make some Money. You have to be wait it find optimal condit

FIBO Strategy EA is a very simple and flexible expert advisor, using a known indicator that allows you to see and exploit retracements. Any optimization should be done using average values and not doing it too often, it can be used at all times, but is more productive with the M30 and H1 times.

This Expert Advisior is following the main trend and makes profit in bull and in bear markets. It works for all currency pairs. I have attached a Screenshot for GPDUSD D1. It is very effective and has small drawdowns. I will give this EA away for only USD 30,-. This offer is valid until June, 30 2018 Later on it will be much more expensive. It is very powerfull and profitable.

Stay updated with Multicurrency Overview!! The algorithm of this EA releases an average of the movement percentage of all the Forex currencies linked to a single currency, isolating it, letting us to comprehend its real and specific trend.
Above on the left, a panel show us efficiently the trend of the currency, in the timeframe actually used. The second panel will keep you updated on macroeconomic news.
P.N.:The news time is based on your pc clock time, this way you won't have any problem r

The Stepping Trend Indicator
The Steppi ng Trend indicator uses the average true range (ATR indicator) in its calculation. This gives you control to set your own average true range period, I set the Default as 10.
Indicator Details.
Green Arrow Up: This means you are at the starting point of a new bullish trend, it’s time to buy. Red Arrow Down : This means you are at the starting point of a new bearish trend, it’ s time to sell .
What if you miss the Arrow Signal?
No

Этот индикатор предназначен для контроля уровней CCI на текущем и старших от него таймфреймах. Панель управления проста в понимании и состоит из кнопок, с помощью которых можно управлять отображением линий, соответствующим указанным на наименовании кнопок. Цвет кнопки совпадает с цветом линии. Этот индикатор из серии подобных индикаторов, которые уже успели завоевать популярность: https://www.mql5.com/ru/market/product/30276 и https://www.mql5.com/ru/market/product/30403
Параметры "___| Set

This indicator makes objects(HLine,VLine,etc.) invisible in chosen timeframes. Objects to be invisible are determined by color. If you delete this indicator from the chart,the vanished object will be visible again.
This indicator is especially useful for trader that utilize a lot of lines.
Vanishable Object:HLine,VLine,ChannnelLine,LABEL,TEXT,arrow.
*In strategy tester,you can't change timeframe.Use template in order to know full ability of this indicator.
*There is a free version.
In

HLOC Trend Indicator This indicator helps you to determine trend direction on your trade. Default parameters for H1 time frame. You can use this indicator both bigger time frame and smaller time frame to open a trade. The calculation is based on high, low, opening and closing price values of each bar in the selected time period. When the values found in the Indicator custom formula are exceeded, the buy or sell signal falls on the screen. There are two extern inputs; RiskFactor: Early but risky
Probability Indicator displays volatility bands on the price chart and calculates probabilities of price exceeding specified levels for the next bar, taking trend into account. It does that by performing a statistical analysis of the completed bars in the chart's history, which may include years of data. The volatility bands differ from Bollinger bands in the calculation of standard deviation from the simple moving average, resulting in bands that envelop the range of price swings in a channel t
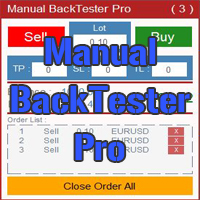
The Manual BackTester Pro utility allows to simulate the manual trading in the MetaTrader 4 strategy tester.
The utility has no parameters at initialization. Time Frame Support: M1, M5, M15, M30, H1, H4, D1, W1, MN1
Panel Description:
The panel has Buy and Sell buttons for placing market orders. It is possible to set the Take Profit, Stop Loss and the Trailing Stop in the TP, SL and TL fields, respectively, measured in points of order opening price. The Lot field sets the lot size. It i

GoodBoy EA is a new concept developed after many years of Forex trading experiences. It uses multilevel complex algorithms and multitimeframes analysis to detect trends. It trades in the direction of a strong market impulse. The EA is optimized with it's default settings to pass backtesting from 2011 to 5-Aug-2018 (Release date).
Please visit GoodBoy's Blog for set files and other notes.
Characteristics of the EA FIFO compliance option. Price averaging of same kind trades (Buys separated fr

Microcore universal EA
Microcore universal EA is new in the Forex market. it can work on multiple symbols on the same terminal. This EA can work on both standard and cent account. The best secure use of this EA is to apply on cent account. Version info
This is version 1.00. we are working on next version with the new updates. these updates include code optimization and trailing stops.
Live Trading Result View Account#: 67652910 Investor Password: HNRHGDB78DHR Server:
Il MetaTrader Market è il posto migliore per vendere robot di trading e indicatori tecnici.
Basta solo sviluppare un'applicazione per la piattaforma MetaTrader con un design accattivante e una buona descrizione. Ti spiegheremo come pubblicare il tuo prodotto sul Market per metterlo a disposizione di milioni di utenti MetaTrader.
Ti stai perdendo delle opportunità di trading:
- App di trading gratuite
- Oltre 8.000 segnali per il copy trading
- Notizie economiche per esplorare i mercati finanziari
Registrazione
Accedi
Se non hai un account, registrati
Consenti l'uso dei cookie per accedere al sito MQL5.com.
Abilita le impostazioni necessarie nel browser, altrimenti non sarà possibile accedere.