• Aperçu
  • Avis
  • Commentaires (14)
  • Nouveautés

Namiri Trade Engine

Namiri Trade Engine is an ALL in ONE trading system that combines market structure, volume pressure, market condition & risk management to give you the BEST opportunities for A+ trade setups with auto lot size

WAIT FOR YOUR A+ SETUP || ONLY TAKE YOUR A+ TRADE || RINSE REPEAT YOUR A+ MOVE

Chart Features

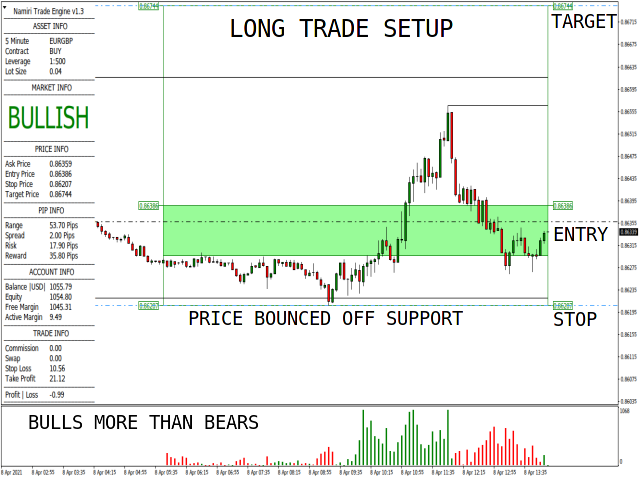
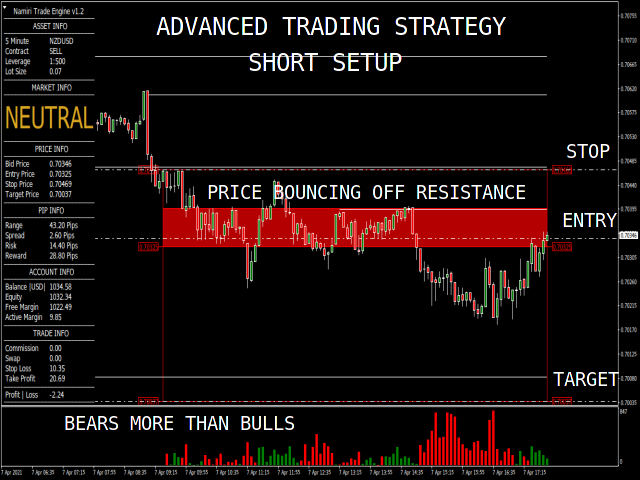
  • Panel - Shows the asset, market, price, pip, account, trade & profit|loss information
  • Structure - Shows areas of support & resistance
  • Risk Management - Shows risk analysis period of 100 bars, buy | sell entry zone as well as stop loss & take profit levels for a {1:2 risk:reward}
  • Volume - Shows volume pressure bars of bulls & bears at the bottom of your chart

Panel Features

  • Asset Info - Shows current time-frame, pair, contract is a buy|sell, leverage & lot size
  • Market Info - Shows the current market condition
  • Price Info - Shows bid|ask, entry, stop & target prices
  • Pip Info - Shows range, spread, risk & reward in pips
  • Account Info - Shows account balance, equity, free margin & active margin
  • Trade Info - Shows the amounts of commission, swap, stop loss & take profits
  • Profit | Loss - Shows the profit | loss on the active trade on that specific pair

Parameters

  • Maximum Risk - Defaults Of Percent Risk Set To 0.2% Per Trade | Default Pip Risk At 25 Pips Max Risk Per Trade
  • Trade Setups - Bounce | Breach | Defense | Strike  { PICK ONE | MASTER ONE | TRADE ONE }
  • Color Theme - Bullish | Neutral | Bearish | Buy Zone | Sell Zone

Trade Setups

STOP BEHIND STRONG BARRIER || WEAK TO NO BARRIER TO TARGET || VOLUME PRESSURE CONFIRMATION

  • BUY Contract - Trade when a BUY ALERT is triggered for a bounce | breach | defense | strike trade setups with a 10X spread minimum risk, ASK price MUST close inside the LONG entry zone based on BULLISH market info, entry at SUPPORT, bullish volume pressure clusters MUST be significantly STRONGER on the impulse LONG move than the bearish volume pressure clusters, A+ setup has a STOP BELOW a STRONG BARRIER & WEAK to NO BARRIER between your entry & target

  • SELL Contract - Trade when a SELL ALERT is triggered for a bounce | breach | defense | strike trade setups with a 10X spread minimum risk, BID price MUST close inside the SHORT entry zone based on BEARISH market info, entry at RESISTANCE, bearish volume pressure clusters MUST be significantly STRONGER on the impulse SHORT move than the bullish volume pressure clusters, A+ setup has a STOP ABOVE a STRONG BARRIER & WEAK to NO BARRIER between your entry & target

Things To Note

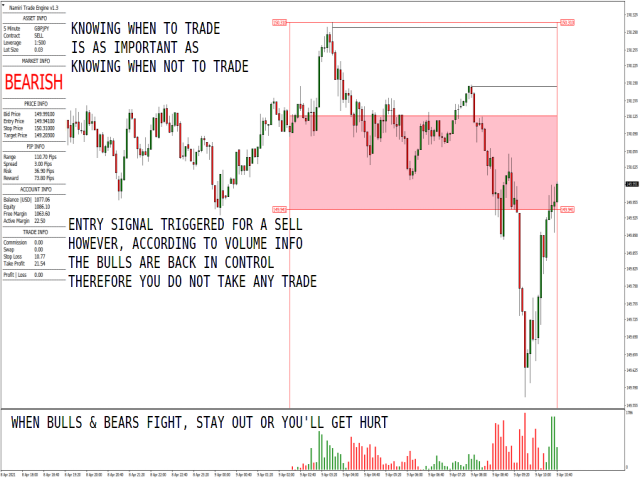
WHEN THE BULLS & BEARS FIGHT STAY OUT OR YOU WILL GET HURT
  • Depending on the risk percentage, spread & leverage, the lot size is some cases are rounded up or down therefore your actual trade amounts may differ slightly;
  • The stop loss & take profit dollar amounts shown under trade info are based on risk percentage plus hard stops and targets, therefore your actual trade amounts may differ slightly depending on your actual entry price, slippage, spreads & rounded lot size
  • Please DO NOT just take each & every trade setup alert, MOST are low quality trade setup alerts because of NO volume pressure confirmations. First, pick one asset, one setup, one time frame. Secondly, ensure its an A+ setup that has been confirmed by the volume pressure & that you have tested, proven & traded on a demo account BEFORE a live account. Lastly, just rinse & repeat those A+ trade setups; Ignore all trade setup alerts during red news on M1 & M5 as they are high risk setups & are most likely false positives

TEST IT || PROVE IT || TRADE IT

Share comments & reviews

Produits recommandés
Limitless MT4
Dmitriy Kashevich
Limitless MT4 is a universal indicator suitable for every beginner and experienced trader. works on all currency pairs, cryptocurrencies, raw stocks Limitless MT4 - already configured and does not require additional configuration And now the main thing Why Limitless MT4? 1 complete lack of redrawing 2 two years of testing by the best specialists in trading 3 the accuracy of correct signals exceeds 80% 4 performed well in trading during news releases Trading rules 1 buy signa
Smooth price for Monarch MT4
Konstantin Gruzdev
3.67 (3)
The Smooth Price technical indicator is used for plotting a smoothed line as close to the price of the financial instrument as possible, and serves to eliminate its noise components. The indicator is part of the Monarch trading system, but here it is presented as an independent technical analysis tool. The indicator is based on the cluster digital filter , which, unlike the ClusterSMA , is applied directly to the price time series. Smooth Price does not redraw (except the very last, zero bar) an
Dark Sniper
Dmitriy Kashevich
Dark Sniper arrow indicator. complete lack of redrawing percentage of correct indicator predictions from 80 85% The arrow indicates the direction of the next candle and the possible direction of the trend in the future.  suitable for small m1 timeframes. It is recommended to open deals from 1 to 2 candles. The signal appears on the last candle advantages of the indicator: 1. leading signals. 2.complete lack of redrawing 3. high signal accuracy.
Wave Impulse OmegaScalper - is the manual system for scalping. In many cases Indicator "eats" almost all possible trend wave. System defines up price wave and down price wave. Inside the exact wave - system defines true trend movement and choppy market. Indicator plots signals while market is trending, powerfull and has quiet good volatility. This is complete system with enter and exit points. Main Indicator's Features Signals are not repaint,non-late or disappear(exept cases when system recalcu
Quants, la pente moyenne mobile est un indicateur très puissant pour donner une indication directionnelle et un élan. L'indicateur ne repeint pas. Vous pouvez calculer efficacement l'angle ma et trouver la tendance. Le décompte des bénéfices commence une fois la bougie de signal fermée. Ce sont donc des résultats exacts qui seraient en direct. TimeFrame suggéré l'utilise sur H1. Toutes les options de l'indicateur sont modifiables. Conseils : Tradez les directions de swing et de cassure
Pro SMC Tool
The Anh Pham
5 (1)
Welcome to the world of SMC (Smart Money Concepts) Trading, where we empower traders with the tools and knowledge to make smarter trading decisions. Our latest addition to our suite of trading tools is the SMC Trading Pro indicator, version 1.0. Key Features: Major Market Structure Identification with BODY break. Order Block must be in Major Swing ( not Small Swing ). Order Block with Fair Value Gap Detection. Order Block in Discount | Premium zone. Filter for only Bullish, Bearish or All Order
POWER TO GET WEALTHY TRADING SYSTEMS.  NON REPAINT REVERSAL ARROW AND CHANNEL  Intra-Day trading and Scalping Strategy:   Designed for fast and accurate day trading and short-term trades. Day and Swing Trading Strategy:   Can be used as a reliable tool for day and swing traders who aim for the big moves of the price. Multi Currencies and Markets:   Works on different instruments and markets with its reliable precision. Multi Timeframes:   Can be used on multiple timeframes with good perfor
Forex Trend Scanner MT4
Carl Gustav Johan Ekstrom
5 (1)
The Forex Trend Scanne r is a powerful tool designed to revolutionize currency strength analysis. It caters to traders of all levels, offering guidance on what to trade and in which direction. This versatile model allows users to include any currency-related symbol, such as Gold (XAU/USD), Silver (XAG/USD), and even Bitcoin (BTC/USD). With compatibility across all time frames and default settings covering 28 major pairs, it provides comprehensive insights for informed trading decisions. Whether
FREE
Gann Zone Pro
Kirill Borovskii
This indicator identifies and displays zones, as it were areas of strength, where the price will unfold. The indicator can work on any chart, any instrument, at any timeframe. The indicator has two modes. The indicator is equipped with a control panel with buttons for convenience and split into two modes. Manual mode: To work with manual mode, you need to press the NEW button, a segment will appear. This segment is stretched over the movement and the LVL button is pressed. The level is displayed
Binary Options Support Resistance Indicator This indicator is designed for binary options trading and effectively shows retracements from support and resistance levels. Signals appear on the current candle. A red arrow pointing downwards indicates a potential selling opportunity, while a blue arrow pointing upwards suggests buying opportunities. All that needs adjustment is the color of the signal arrows. It is recommended to use it on the M1-M5 timeframes as signals are frequent on these timef
Galactic Volume spread analysis (VSA), is an indicator designed for the visualization of the Volume, and the proportion in which it affects the volatility of the spread of the different pairs. The strategy consists of the following: Bull Trend: Always going in favor of the trend, open buying operations at the lows of the trend, provided that it coincides with a high volume shown by the Galactic VSA indicator. Downtrend: Always going in favor of the trend, open sales operations at the highs
Black series MT4
Dmitriy Kashevich
1 (1)
Black series MT4 - The indicator is designed for trading on binary options with Timeframe M1-M5-M15 Multicurrency (Works on cryptocurrency and currency pairs) The signal appears when the candle opens Up to 90% correct signals There is no signal redrawing at all Can be used with other indicators. Good for scalping! In Settings there is: -Indicator working methods -I Allert Arrow color Red signal down Blue signal up Also watch the video how the indicator works and signals
Sto Signal AM
Andriy Matviyevs'kyy
This indicator displays Stochastic osc signals on the price chart and allows the user to receive notifications of such signals. The Stochastic indicator is a classic and proven indicator of the technical analysis of the markets. Despite its age, it is still relevant today. Depending on the settings, the indicator allows you to work effectively on various TFs and any markets. Signals are given on fully formed bars and are not redrawn. Custom Parameters: Stochastic_Price (0-1) - The applied pric
FREE
In Out Trend is a trend indicator for working in the Forex market. A feature of the indicator is that it confidently follows the trend, without changing the signal if the price slightly pierces the trend line. The indicator is not redrawn. In Out Trend - the indicator gives entry signals at the most logical prices after the price pierces the trend line. The indicator works on the basis of mathematical calculations on the price chart. It is one of the most common and useful indicators for find
Ind Dochian Chanel mt4
Mauricio Valbuena
5 (3)
The Donchian channel is an indicator that takes a series of user-defined periods and calculates the upper and lower bands. Draw two lines on the graph according to the Donchian channel formula. This straightforward formula is based on: The top line is the highest price for the last periods n The bottom line is the lowest price for the last periods n Trend systems follow periods when support and resistance levels are broken. in this case when the price breaks the upper line or the lower line
FREE
This is the complete REX package. It consists of the lite, pro and ULTRA version.  Perfect for beginners and intermediates. REX complete is 100% non repaint. The strategy is based on a mix of different strategies, statistics, including pivot points, oscillators and patterns.  As the trading idea consists of a variety of some classic indicators like Momentum, Williams Percent Range, CCI, Force Index, WPR, DeMarker, CCI, RSI and Stochastic, it is clear that the fundamental indicators have being
Introduction It is common practice for professional trades to hide their stop loss / take profit from their brokers. Either from keeping their strategy to the themselves or from the fear that their broker works against them. Using this indicator, the stop loss / take profit points will be drawn on the product chart using the bid price. So, you can see exactly when the price is hit and close it manually.  Usage Once attached to the chart, the indicator scans the open orders to attach lines fo
Chord Trend
Tatiana Savkevych
You can use the indicator as the main one to determine the trend. The indicator can work both for entry points and The Chord Trend indicator works well on longer trend sections. In flat it is recommended to use filters of your choice. It can accompany the position with a stop, it is recommended to set the stop at a fixed distance from the point formed by the indicator. If you combine the use of the indicator as an input and accompanying a position, then to accompany the stop it is necessary tha
Quantum Currency Heatmap Indicator
QUANTUM TRADING SOFTWARE LIMITED
Trading the currency markets is a complex business, not least since we are dealing with pairs of currencies, and by inference, pairs of economies. All economies around the world are interlinked, and reflected in the constant ebb and flow of currency strength and weakness. The problem for us as traders is monitoring so many pairs simultaneously, since every pair does not move independently, but reflects the interrelated nature of this market. The Quantum Currency Heatmap delivers the informatio
BSA Indicator
Ahmet Metin Yilmaz
BSA indicator is a ZigZag based indicator. This indicator is used to find the reversal level of the price. You can use the existing risk ratio and calculation timeframe in the entries by optimizing them according to your usage preference.  In lower time frames, the indicator can repaint. For healthier results, you can detect the least repainting by observing for a while according to the graphic you will apply.
MT My Way
Issara Seeboonrueang
Best strategy,  Easy trade ,  Support of version update in the future MT My Way: Why are there fewer successful traders than failed traders????? The idea of ​​this indicator is that at the point of opening an order, if you ask other traders, they will trade on the opposite side.  So you trade opposite other trader and (Hidden message: It is making profit along with the broker.)   (^_^)   (^-^)   (^ ^)   (^.^) "Trade opposite to others, You will win"  If this idea is true, You may not wan
Indicator from the  Real Non RePaint MultiTimeFrame  (Real NRP MTF) series. Specially designed to display the standard Stohastic indicator from the senior timeframe (TF) to the junior. The indicator differs from the standard scale - symmetrical relative to 0. Add 50.0 to the readings to get the standard values. Does not look into the future for history at the senior TF. DOES NOT DIFFER from the real-time standard indicator (offset-based), but shows the actual indicator counts on the history
***** The REAL , ORIGINAL, Non-Repainting, Non-Delaying, Arrow Trade Entry indicator for Very Low-Risk market execution ***** Check MYFXBOOK HERE!!! Check out my   LIVE   channel to see the EA based on this Indicator in profitable action! Check My Profile . ***This is the Golden standard in arrow indicators for MT4.*** BING Setup Arrows Indicator(BSA) will show easy-to-read High Probability trading situations with Non-Repainting , Non-Delaying , Up or Down arrows on the graph.  So simple, it'
Unlock the secrets of the market with our groundbreaking indicator, [Univerasal Code], a fusion of astronomy strategy and numerology calculations. This unique tool revolutionizes your trading approach by dynamically drawing precise support and resistance levels on your MetaTrader charts. Key Features: Astro-Numerical Precision: Leverages advanced astronomy strategy and numerology calculations for unparalleled precision in identifying support and resistance levels. Unveils a strategic approach to

Naked Forex Kangaroo Tail Pro Indicator Kangaroo Tail Pro Indicator is a pattern recognition indicator for Forex, Stocks, Indices, Futures, Commodities and Cryptos. The Kangaroo Tail is a multi-bar pattern. The Kangaroo Tail pattern is very effective and is very simple to trade. The strategy that comes with the Kangaroo Tail is based on price action. The indicator does what it was designed for: displaying Kangaroo Tail patterns.   Don't expect to follow the up and down arrows and make mo
Real Trading
Yaroslav Varankin
You can trade on any underlying asset, but testing specialists prefer the USD / JPY, EUR / USD currency pair. The most favorable time for work is considered the European, American session.  of correct transactions When the blue arrow appears under the candle, the UP option is acquired. When the red arrow appears, the DOWN option is acquired. One peculiarity of the indicator should be noted: a signal is formed when a candle is opened, opening a trade is worth this bar. The signal will appear on t
Dévoilement de l'indicateur de tendance XY sans repeint : Votre guide ultime pour le succès sur le Forex et les options binaires Dans le monde dynamique du trading Forex et des options binaires, il est essentiel de garder une longueur d'avance. Les traders sont constamment à la recherche d'outils qui peuvent leur donner un avantage concurrentiel, et l'un de ces outils puissants qui fait des vagues dans la communauté des traders est l'indicateur "Non-Repainting XY Trend". Introduction L'indicateu
This Indicator is use the ZigZag to calculate the Upper and  Lower Bound and the uptrend and the downtrned. Red for downtrend, Green for uptrend and Yellow is for the horizontal trend this horizontal trend also bookmarked the upper limited and the lower limited the the price swings.  Or in simple the Support and the Resistance level. However, You may use the Heikin Ashi to confirm the trend of the buy sell signal above. I cannot guarantee the win rate, Nevertheless, you must study well the timef
Ticks Size
Viktor Kolmakov
This indicator displays in a separate window the difference between the number of points which increased the price, and the number of points that decreased the price during the time interval specified in the settings. The time interval for calculation is expressed as the number of bars of the chart the indicator is attached to. This approach allows you to evaluate the movement direction (growth or fall) of the instrument's price, the strength of the movement and the size of the movement in point
ReboltP
David Theodore Caro-greene
Rebalance Overlay Technology (Rebolt) enables the trader to visualize the flow of money from one chart to another chart. Rebolt Probability indicates the probability that money has flowed from one chart to another chart for a specified length of time over a number of intervals specified by the user. When Rebolt reads Cyan or Blue these are buying signs good for the length of time specified by the user or until a conflicting signal arises. When Rebolt reads Violet or Red there are selling signs
Les acheteurs de ce produit ont également acheté
WARNING!! THIS SWORD IS TOO SHARP!    ONLY 10 COPIES LEFT FOR THE NEXT PRICE TO BE 8,000$ FOR UNLIMITED PLAN. Dear traders I am very glad once again to introduce to you my other tool called "Forex Sword Indicator". In short this tool is meant to give you an edge over the market that you have been waiting for  so long. Now, here it is. It is a very very simple tool but yet a dangerous sword. I call it a  Holy grail indicator!. I will not talk a lot about this tool. Just let the tool speak by itse
The breakout algorithm is a technique based on price, price features, to shape a breakout strategy. The strategy in this indicator will not be redrawn (none-repaint indicator), it is suitable for short or long term traders In the screenshot is the EURUSD pair, these currency pairs, commodities or stocks, it have similar strength *Non-Repainting (not redrawn) *For Metatrader4 Only *Great For Scalping *Great For Swing Trading *Arrow Entry, Green is Long, Red is Short *Works On Any Timeframe *Work
Automatic, live & interactive picture of all trendlines. Assign push, email and sound alerts to the lines of your choice and be informed about price rollback, breakout, rollback after breakout, number of rollbacks, line expiration by double breakout. Correct, drag or delete the lines and interactively tune the line system. https://youtu.be/EJUo9pYiHFA . Chart examples https: //www.mql5.com/en/users/efficientforex Price Interaction Events All events are effective immediately and only after on
The [GRAFF] III manual trading system is based on multiple MetaTrader (MT4) indicators. Together, the entire PACK of GRAFF III indicators makes an advanced trading tool. The system consists of over 20 different custom-built indicators which have been carefully selected and tested in the long term to produce strong and efficient trading signals. The particular indicators are based on different mathematical formulas, so the entire system is calibrated to remove false signals from its own indicator
Let´s try to make some real money! Call me profit addicted. I thought why not try to make THE dream come reality. With discipline, a clear strategy and this indicator I focus on entering the perfect trades. This indicator is very easy to use as you will get perfect entry points for Put or Call trades. The arrows are calculated with: -     Momentum  parameters -     Candle stick patterns -     Fundamental Price action We recommend to combine it with Parabolic, ZigZag or Elliot waves indic
Golden Chip
Daishon Cotman
Golden Chip provides Basic Market Structure, Fibonacci, supply and Demand Zones. Letting you identify when a sell off point is approaching or whne a buy opportunity is arriving. The awesome thing about Golden Chip is that, you will see rejection levels or continuation before ANYBODY ! This indicator moves directly with price and lines up perfectly with the Chart. Some indicators would lag but NOT this one ! Golden Chip is amazing for Clean chart (Naked Chart). GOLDEN CHIP IS ONLY ON METATRADER (
Bienvenue dans le monde du trading avancé avec l'indicateur FxBears Super Trading. Conçu exclusivement pour la plateforme MT4, cet outil innovant combine la puissance des vagues d'Elliott, des zones d'offre et de demande et des indicateurs internes pour fournir aux traders des signaux de haute qualité pour des décisions de trading éclairées. Avec un taux de réussite de plus de 90 %, FxBears Super apporte un nouveau niveau de précision et de rentabilité à votre stratégie de trading. De Corse Pas
Gann Made Easy
Oleg Rodin
4.93 (67)
Gann Made Easy est un système de trading Forex professionnel et facile à utiliser qui est basé sur les meilleurs principes de trading en utilisant la théorie de mr. WD Gann. L'indicateur fournit des signaux d'ACHAT et de VENTE précis, y compris les niveaux Stop Loss et Take Profit. Vous pouvez échanger même en déplacement en utilisant les notifications PUSH. S'il vous plaît contactez-moi après l'achat! Je partagerai avec vous mes astuces de trading et d'excellents indicateurs bonus gratuitement!
ACTUELLEMENT 26% DE RÉDUCTION La meilleure solution pour tout débutant ou trader expert ! Cet indicateur est un outil de trading unique, de haute qualité et abordable car nous avons incorporé un certain nombre de caractéristiques exclusives et une nouvelle formule. Avec seulement UN graphique, vous pouvez lire la force de la devise pour 28 paires Forex ! Imaginez comment votre trading va s'améliorer parce que vous êtes capable de repérer le point de déclenchement exact d'une nouvelle tendan
Atomic Analyst
Issam Kassas
5 (3)
Tout d'abord, il convient de souligner que cet indicateur de trading n'est ni repainting, ni redrawing et ne présente aucun délai, ce qui le rend idéal à la fois pour le trading manuel et automatisé. Manuel de l'utilisateur : réglages, entrées et stratégie. L'Analyste Atomique est un indicateur d'action sur les prix PA qui utilise la force et le momentum du prix pour trouver un meilleur avantage sur le marché. Équipé de filtres avancés qui aident à éliminer les bruits et les faux signaux, et à
TPSpro RFI Levels
Roman Podpora
4.87 (15)
Reversal First Impulse levels (RFI)    INSTRUCTIONS        RUS       -       ENG              R ecommended to use with an indicator   -   TREND PRO -  Version MT5 A key element in trading is zones or levels from which decisions to buy or sell a trading instrument are made. Despite attempts by major players to conceal their presence in the market, they inevitably leave traces. Our task was to learn how to identify these traces and interpret them correctly. Main functions: Displaying active zones
Scalper Inside PRO
Alexey Minkov
4.75 (57)
An exclusive indicator that utilizes an innovative algorithm to swiftly and accurately determine the market trend. The indicator automatically calculates opening, closing, and profit levels, providing detailed trading statistics. With these features, you can choose the most appropriate trading instrument for the current market conditions. Additionally, you can easily integrate your own arrow indicators into Scalper Inside Pro to quickly evaluate their statistics and profitability. Scalper Inside
TrendMaestro
Stefano Frisetti
5 (2)
note: this indicator is for METATRADER4, if you want the version for METATRADER5 this is the link:  https://www.mql5.com/it/market/product/108106 TRENDMAESTRO ver 2.4 TRENDMAESTRO recognizes a new TREND in the bud, he never makes mistakes. The certainty of identifying a new TREND is priceless. DESCRIPTION TRENDMAESTRO identifies a new TREND in the bud, this indicator examines the volatility, volumes and momentum to identify the moment in which there is an explosion of one or more of these data a
Trend Punch
Mohamed Hassan
5 (4)
Manual guide:   Click here Starting price of  $88  for the first 25 copies only ( 3  left)! -- Next price is  $176 .  This indicator is unstoppable when combined with our other indicator called  Support & Resistance . After purchase, send us a message and you could get  it  for  FREE as a BONUS!  Introducing Trend Punch , the revolutionary forex trend indicator that will transform the way you trade! Trend Punch is uniquely designed to provide precise buy and sell arrows during strong
Advanced Supply Demand
Bernhard Schweigert
4.92 (311)
CURRENTLY 26% OFF !! Best Solution for any Newbie or Expert Trader! This indicator is a unique, high quality and affordable trading tool because we have incorporated a number of proprietary features and a new formula. With this update, you will be able to show double timeframe zones. You will not only be able to show a higher TF but to show both, the chart TF, PLUS the higher TF: SHOWING NESTED ZONES. All Supply Demand traders will love it. :) Important Information Revealed Maximize the potenti
TPSproTREND PrO
Roman Podpora
4.78 (18)
TPSpro TRENDPRO  - is a trend indicator that automatically analyzes the market and provides information about the trend and each of its changes, as well as giving signals for entering trades without redrawing! The indicator uses each candle, analyzing them separately. referring to different impulses - up or down impulse. Exact entry points into transactions for currencies, crypto, metals, stocks, indices!  -  Version MT5               DETAILED DESCRIPTION                R ecommended to use with
Découvrez le secret pour réussir le trading Forex avec notre indicateur MT4 personnalisé! Vous êtes-vous déjà demandé comment réussir sur le marché du Forex, gagnant régulièrement des bénéfices tout en minimisant les risques? Voici la réponse que vous avez recherchée! Permettez-nous d'introduire notre indicateur MT4 propriétaire qui révolutionnera votre approche du trading. Polyvalence unique Notre indicateur est spécialement conçu pour les utilisateurs qui préfèrent les formations de bou
Break and Retest
Mohamed Hassan
4.33 (12)
New update to V.4 where  Break & Retest automatically draws the take profit & stop loss levels and you also have more signals per day! ‍You can visually backtest Break & Retest to see how it behaved in the past!     Manual guide:   Click here $65  for only 1  copy left! Next price is $120 .  This Indicator only places quality trades when the market is really in your favor with a clear break and retest. Patience is key with this price action strategy! If you want more alert s
Actuellement 20% de réduction ! La meilleure solution pour tout débutant ou trader expert ! Ce logiciel de tableau de bord fonctionne sur 28 paires de devises. Il est basé sur 2 de nos principaux indicateurs (Advanced Currency Strength 28 et Advanced Currency Impulse). Il donne un excellent aperçu de l'ensemble du marché Forex. Il montre les valeurs de l'Advanced Currency Strength, la vitesse de mouvement des devises et les signaux pour 28 paires de devises dans tous les (9) délais. Imagine
Le profit de la structure du marché change à mesure que le prix s'inverse et recule. L'indicateur d'alerte d'inversion de la structure du marché identifie le moment où une tendance ou un mouvement de prix approche de l'épuisement et est prêt à s'inverser. Il vous avertit des changements dans la structure du marché qui se produisent généralement lorsqu'un renversement ou un recul majeur est sur le point de se produire. L'indicateur identifie initialement les cassures et la dynamique des prix,
Gold Stuff
Vasiliy Strukov
4.89 (256)
Gold Stuff est un indicateur de tendance conçu spécifiquement pour l'or et peut également être utilisé sur n'importe quel instrument financier. L'indicateur ne se redessine pas et ne traîne pas. Délai recommandé H1. Au niveau de l'indicateur de travail, l'Expert Advisor EA Gold Stuff est entièrement automatique. Vous pouvez le trouver sur mon profil. Contactez-moi immédiatement après l'achat pour obtenir les réglages et un bonus personnel !   RÉGLAGES Dessiner la flèche - on off. dessin
Currency Strength Wizard est un indicateur très puissant qui vous offre une solution tout-en-un pour un trading réussi. L'indicateur calcule la puissance de telle ou telle paire de devises en utilisant les données de toutes les devises sur plusieurs périodes. Ces données sont représentées sous la forme d'un indice de devise facile à utiliser et de lignes électriques de devise que vous pouvez utiliser pour voir la puissance de telle ou telle devise. Tout ce dont vous avez besoin est d'attacher l'
Présentation de l'indicateur astronomique pour MT4 : Votre compagnon de trading céleste ultime Êtes-vous prêt à élever votre expérience de trading à des hauteurs célestes ? Ne cherchez pas plus loin que notre indicateur astronomique révolutionnaire pour MT4. Cet outil innovant transcende les indicateurs de trading traditionnels en exploitant des algorithmes complexes pour vous fournir des aperçus astronomiques inégalés et des calculs de précision. Un univers d'informations à portée de main : Con
Trend Screener
STE S.S.COMPANY
4.83 (88)
Indicateur de tendance, solution unique révolutionnaire pour le trading et le filtrage des tendances avec toutes les fonctionnalités de tendance importantes intégrées dans un seul outil ! Il s'agit d'un indicateur multi-période et multi-devises 100 % non repeint qui peut être utilisé sur tous les symboles/instruments : forex, matières premières, crypto-monnaies, indices et actions. Trend Screener est un indicateur de suivi de tendance efficace qui fournit des signaux de tendance fléchés avec des
ICT, SMC, SMART MONEY CONCEPTS, SMART MONEY, Smart Money Concept, Support and Resistance, Trend Analysis, Price Action, Market Structure, Order Blocks, BOS/CHoCH,   Breaker Blocks ,  Momentum Shift,   Supply&Demand Zone/Order Blocks , Strong Imbalance, HH/LL/HL/LH,    Fair Value Gap, FVG,  Premium  &   Discount   Zones, Fibonacci Retracement, OTE, Buy Side Liquidity, Sell Side Liquidity, BSL/SSL Taken, Equal Highs & Lows, MTF Dashboard, Multiple Time Frame, BigBar, HTF OB, HTF Market Structure, 
TrendDecoder Premium
Christophe Pa Trouillas
5 (4)
Identifiez les ranges et les prochaines tendances fortes   |  Obtenez les premiers signaux et la force des tendances   |  Obtenez des TP clairs et RR favorable   |  Repérer les niveaux Fibo que le prix va tester Indicateur qui ne retrace pas, non retardé - idéal pour le trading manuel et automatisé - adapté à tous les actifs et à toutes les unités de temps Pour une durée limitée >>   -50% de réduction Après votre achat,   contactez-moi sur ce canal  pour obtenir les réglages recommandés. Version
FX Volume
Daniel Stein
4.6 (35)
Obtenez votre mise à jour quotidienne du marché avec des détails et des captures d'écran via notre Morning Briefing ici sur mql5 et sur Telegram ! FX Volume est le PREMIER et SEUL indicateur de volume qui fournit un VRAI aperçu du sentiment du marché du point de vue d'un courtier. Il fournit des informations impressionnantes sur la façon dont les acteurs institutionnels du marché, comme les courtiers, sont positionnés sur le marché des changes, bien plus rapidement que les rapports COT. Voir c
The indicator of a Professional Trader is an arrow indicator for predicting the direction of price movement. I have been working on this indicator since 2014. You can use this indicator as your main indicator, use its entry signals, and use it as your only indicator to find entry points. About the product: Recommended TF [H4-D1-W1]   . The indicator predicts the direction of the next candle. Fits a variety of tools; Flexibility in settings for different instruments and intervals through the
Tout d'abord, il convient de souligner que cet outil de trading est un indicateur non repeint, non redessiné et non retardé, ce qui le rend idéal pour le trading professionnel. Cours en ligne, manuel utilisateur et démonstration. L'indicateur Smart Price Action Concepts est un outil très puissant à la fois pour les nouveaux et les traders expérimentés. Il regroupe plus de 20 indicateurs utiles en un seul, combinant des idées de trading avancées telles que l'analyse du trader Inner Circle et les
ACTUELLEMENT 31% DE RÉDUCTION ! ! La meilleure solution pour tout débutant ou Expert Trader ! Cet indicateur est un outil de trading unique, de haute qualité et abordable car nous avons incorporé un certain nombre de caractéristiques exclusives et une formule secrète. Avec seulement UN graphique, il donne des alertes pour les 28 paires de devises. Imaginez comment votre trading s'améliorera parce que vous serez capable de repérer le point de déclenchement exact d'une nouvelle tendance ou d'
Plus de l'auteur
Prometheus Smart Money is an indicator that combines both price & volume with calculations based on other custom indicators, smart volume and retail volume to create this leading indicator that gives you high probability moves to help you make a decision on what is MOST likely to happen in the market going forward Advantages You can use it in ALL financial markets including binary options on ALL asset classes or instruments. You can use it as a stand alone indicator or as a confirmation tool wit
Centaurus Trend Engine is an indicator that uses custom indicators to give the current momentum moves of the market with a multi-timeframe approach to trading Features Value Area -It is the (red/green) rectangular box on your chart based on the dynamic structure period set;Green to indicate you focus on LONG moves & Red for SHORT moves Analysis - Displays The Market Analysis Strength - Displays The Market Strength Trend - Displays The Market Trend Entry State - Displays the BEST entry time for t
Primus Smart Money is an indicator that shows the average of bulls and bears on an asset. Used as a confirmation indicator for bullish and bearish control to assist in predicting future price moves Advantages Used in ALL financial markets including binary options on ALL asset classes or instruments. To be used as a confirmation tool with other indicators Parameters Period - default set to 9 (Recommended) Entry requirements Focus on the clusters on the indicator - the height or depth of the bars
Primus Trading Engine is a trading system that combines price action,ratio based indicators & custom indicators to create this leading indicator with a multi-timeframe approach to give you high probability trade setups for forex,CFD cash/futures,metals & binary option to assist in making predictions on what is MOST likely to happen in the market Main Chart Features Price Action Signal-Arrow displayed on a specific bar;NOT buy/sell arrow;DOES NOT repaint;Bullish arrow on a bullish bar,price is l
Prometheus Trade Engine is an indicator that combines price action, ratio based indicator with custom indicators& other lagging indicators to create this leading indicator that has a multi-timeframe approach to trading so that you are able to see what other timeframes are doing all in one chart and give you high probability trade setups to assist you to make a prediction on what is MOST likely to happen in the market going foward Chart Features 1. Reversal Zone It is the rectangular box on
Filtrer:
Aucun avis
Répondre à l'avis
Version 16.8 2024.05.23
Added an adjustable maximum pip risk per trade parameter
Improvements to volume pressure code & re-added namiri defense setup
Version 16.7 2024.05.05
Removed namiri defense setup
Simplified entry criteria for namiri bounce, breach & strike setups
Improvements to structure to include broken support & resistance
Improvements to volume pressure calculations
Version 16.6 2024.03.19
Fixed a critical error on structure support & resistance code
Version 16.5 2024.03.19
Removed volume analysis limit
Version 16.4 2024.03.16
Improvements to volume pressure calculations
Version 16.3 2024.03.14
Improvements to structure to show broken support & resistance
Version 16.2 2024.03.12
Adjustments to the volume pressure period
Version 16.1 2024.03.07
Set market info & volume info analysis limit to 200 bars
The first 100 volume pressure bars represents "inside the wire"
The last 100 volume pressure bars represents "outside the wire"
Version 16.0 2024.02.28
Modified market info calculations
Modified volume pressure calculations
Added a filter to the entry criteria for all namiri trade setups
Version 15.9 2024.02.12
Modified entry criteria for namiri breach setup
Improvements to volume pressure calculations
Version 15.8 2024.01.29
Modified entry criteria for namiri defense setup
Improvements to volume pressure calculations
Version 15.7 2024.01.25
Modified entry criteria for namiri strike setup
Modified volume pressure calculations
Version 15.6 2024.01.25
Modified volume info calculations
Modified structure code
Version 15.5 2024.01.18
Modified entry criteria for namiri strike setup
Modified volume info calculations
Version 15.4 2023.12.01
Re-added namiri strike trade setup
Modified market info calculations
Modified entry criteria for all namiri trade setups
Version 15.3 2023.11.09
Modified volume pressure calculations
Version 15.2 2023.10.30
Removed strike trade setup
Modified entry criteria for breach & defense trade setups
Version 15.1 2023.10.23
Modified volume pressure calculations
Version 15.0 2023.10.18
Modified volume pressure calculations
Modified alerts on all trade setups
Version 14.9 2023.09.23
Added namiri strike trade setup
Improvements to support & resistance structure calculations
Added trade setup parameter options
Changed parameter options display
Version 14.8 2023.09.15
Modified analysis period
Modified namiri bounce setup
Version 14.7 2023.08.28
Modified namiri breach & namiri defense entry setups
Version 14.6 2023.08.25
Modified namiri bounce, namiri breach & namiri defense setups
Version 14.5 2023.08.02
Improvements to support & resistance code
Version 14.4 2023.07.24
Modifications to namiri breach & namiri defense entry setups
Version 14.3 2023.07.14
Fixed trade info -- commission, swap & stop loss display errors
Version 14.2 2023.07.12
Improvements to support & resistance code
Version 14.1 2023.07.11
Improvements to volume pressure calculations
Version 14.0 2023.07.10
Modified market info calculations
Modified volume pressure calculations
Added entry criteria for 3 entry setups (namiri bounce, namiri breach & namiri defense)
Version 13.9 2023.06.02
Modified market info calculations
Modified volume pressure calculations
Modified entry criteria
Version 13.8 2023.05.25
Updated entry criteria
Version 13.7 2023.05.19
Fixed issues in structure code
Modifications to volume pressure code
Version 13.6 2023.05.11
Modified entry criteria
Modified focus hooks
Version 13.5 2023.04.27
Improvements to market info to include fast market response
Improvements to volume info to include a longer analysis period
Improvements to structure calculations to include a longer analysis period
Version 13.4 2023.04.12
Improvements to volume pressure code
Version 13.3 2023.04.05
Added a filter to the entry criteria
Improvements to the volume pressure code
Version 13.2 2023.03.28
Removed momentum tag
Version 13.1 2023.03.22
Improvements to volume pressure code
Added momentum tag
Version 13.0 2023.03.21
Improvements to volume pressure code
Version 12.9 2023.03.16
Improvements to volume pressure code
Version 12.8 2023.03.15
Improvements to structure code
Version 12.7 2023.03.09
Changes to focus hooks on market info
Version 12.6 2023.03.09
Increased analysis period range to improve on chart analysis
Modification to display of focus hooks on market info
Version 12.5 2023.02.28
Removed volume pressure threshold levels
Version 12.4 2023.02.23
Improvements to structure calculations to only show verified levels
Version 12.3 2023.02.22
Modifications to market info & volume info
Replaced volume pressure threshold level 30 with level 15
Version 12.2 2023.02.21
Modifications to volume pressure
Version 12.1 2023.02.20
Removed volume pressure threshold level
Modification to market info focus hooks
Version 12.0 2023.02.17
Added volume pressure threshold level 30
Added the minimum 10 pip risk to entry criteria
Version 11.9 2023.02.16
Removed volume pressure threshold level
Removed the10 pip minimum risk entry criteria
Version 11.8 2023.01.26
Changed structure from dynamic to static
Removed daily, weekly, monthly dynamic structure
Removed daily, weekly, monthly market info direction bias
Removed momentum tag
Added focus hooks on market info
Added volume pressure threshold of level 30 to assist in monitoring the bull & bear fight
Version 11.7 2022.12.07
Modifications to structure to include daily, weekly & monthly structure as well as their open (depending on which time frame you are on)
Modifications to volume pressure calculations to confirm if you have a valid setup
Modifications to market info to give you direction bias based on structure & daily, weekly or monthly open (depending on which time frame you are on)
Version 11.6 2022.11.11
Changed structure from fixed to dynamic
Added momentum tag to identify whether price is oscillating bullish | bearish
Version 11.5 2022.10.26
Modifications to analysis period
Modifications to market info calculations
Modifications to volume pressure calculations
Modifications to potential entry alert criteria
Version 11.4 2022.10.06
Modifications to volume info range
Modifications to entry alert criteria
Version 11.3 2022.09.29
Modifications to volume pressure calculations
Modifications to trade entry alert criteria
Reduced the default risk to 0.5%
Version 11.2 2022.09.27
Modifications to market info calculations
Modifications to volume info calculations
Modifications to structure calculations
Version 11.1 2022.09.14
Modifications to analysis period
Modifications to market info calculations
Doubled volume pressure analysis range
Version 11.0 2022.08.26
Modifications to entry criteria
Modifications to structure calculations
Modifications to market info calculations
Modifications to volume pressure calculations
Removed volume level threshold
Version 10.9 2022.08.19
Modifications to entry criteria
Modifications to market info calculations
Modifications to volume info calculations
Modification of volume level threshold from 15 to 100
Version 10.8 2022.08.09
Removed trend stripes
Modifications to entry criteria
Modifications to market info calculations
Modifications to volume info calculations
Added volume level 15 threshold
Version 10.7 2022.08.03
Removed average tag
Added trend stripes to market info to highlight overall market focus
Modifications to analysis period
Modifications to market info calculations
Modifications to structure calculations
Modifications to entry criteria
Version 10.6 2022.08.01
Added the average tag
Modifications to market info calculations
Modifications to volume pressure calculations
Modifications to entry criteria
Version 10.5 2022.07.30
Modifications to volume pressure calculations
Removed threshold level
Removed maximum volume level
Version 10.4 2022.07.27
Modifications to volume pressure calculations
Changed the volume pressure threshold from 25 to 30
Set the fixed maximum volume pressure to 60
Version 10.3 2022.07.26
Modifications to market info calculations
Added 25 level volume pressure threshold
Version 10.2 2022.07.24
Modifications to volume pressure calculations
Version 10.1 2022.07.22
Removed psychological structure
Removed moving average tag
Modifications to entry criteria
Version 10.0 2022.07.18
Changed from dynamic structure to fixed psychological structure levels
Removed bullish, bearish & neutral color change option
Default percent risk set to 1.0
Version 9.9 2022.06.21
Modifications to market info calculations
Changes in entry criteria
Version 9.8 2022.05.17
Changed banner to highlight trade risk relative to structure range
Version 9.7 2022.05.17
Added more structure levels
Added a banner to highlight no trading with narrow structure range
Version 9.6 2022.05.13
Added structure level to the entry criteria
Removed "pending" market info
Version 9.5 2022.05.06
Added a 200 MA close level tag on the chart
Added the MA to the entry criteria
Version 9.4 2022.05.05
Reduced the number of structure levels
Renamed the structure levels
Removed "pending" market info condition
Changes to entry criteria
Version 9.3 2022.05.04
Changed labels on levels to include overall structure focus
Changed structure level period as well as period visibility
Changed market info calculations
Included "pending" market condition to market info meaning "no trade zone"
Changed risk management period
Changed entry criteria parameters
Version 9.2 2022.04.28
Changed structure period
Included structure labels
Version 9.1 2022.04.27
Changed dynamic structure period
Changed structure zones to structure levels
Version 9.0 2022.04.26
Fixed structure code label issue
Fixed entry criteria errors
Version 8.9 2022.04.26
Removed some dynamic structure levels
Changed from structure level to structure zone
Change structure period
Changed market info calculations
Changed volume info period
Changed risk management period
Version 8.8 2022.04.21
Changed structure levels to structure zones
Changed analysis period, volume info & structure periods
Changed entry criteria
Version 8.7 2022.04.20
Changed structure from static to dynamic
Changed volume info calculations
Version 8.6 2022.04.14
Changed from dynamic structure to fixed structure
Version 8.5 2022.04.13
Renamed structure levels
Changed volume period
Version 8.4 2022.04.08
Added structure labels to know where price is on the chart
Modified entry criteria
Changed trade range to structure range
Version 8.3 2022.04.06
Changed period to volume info calculations
Added a filter to entry criteria
Version 8.2 2022.04.04
Complete structure overhaul from static to dynamic
Improvements to market info calculations
Minor adjustment to the entry criteria
Removed redundant code
Version 8.1 2022.03.30
Cleaned up the overall code by removing outdated code
Improvements to structure calculations for a slightly more high probability structure zones
Version 8.0 2022.03.30
Modified period to market info calculations
Adjustments to risk management tool
Modified period to volume info calculations
Modified period to structure calculations
Version 7.9 2022.03.25
Improvements to market info & volume info calculations
Version 7.8 2022.03.22
Improvements to volume info calculations
Version 7.7 2022.03.21
Improvements to market info calculations
Version 7.6 2022.03.16
Removed probability factor to buy & sell contract
Modifications to volume info
Version 7.5 2022.03.16
Modifications to volume info
Added a probability factor to buy & sell contracts
Version 7.4 2022.03.15
Improvements to market info calculations & risk management tool
Version 7.3 2022.03.14
Modifications to risk management tool
Version 7.2 2022.03.12
Modifications to risk management & volume info
Version 7.1 2022.03.11
Improvements to market info calculations
Version 7.0 2022.03.04
Fixed entry alert criteria
Improvements to market info calculations
Version 6.9 2022.03.04
Restructured the risk management tool for high probability trade setups
Version 6.8 2022.03.01
Improvements to volume info calculations
Version 6.7 2022.02.26
Revert from dynamic structure to fixed structure
Version 6.6 2022.02.23
Changes to structure naming
Extended structure period
Version 6.5 2022.02.22
Complete structure overhaul from static to dynamic
Improvements to market info & volume info calculations
Minor adjustment to the entry criteria
Version 6.4 2022.02.18
Improvements to market info calculations
Version 6.3 2022.02.18
Added a filter on the entry criteria
Version 6.2 2022.02.11
Improvements to structure calculations
Version 6.1 2022.02.10
Improvements to volume calculations
Modifications to entry criteria
Version 6.0 2022.01.31
Modified structure calculations
Changed volume pressure chart presentation
Version 5.9 2022.01.17
Minor adjustments to volume info calculations
Version 5.8 2022.01.17
Modifications to volume info calculations
Version 5.7 2022.01.04
Modification to market info calculations
Version 5.6 2021.12.23
Adjustments to analysis period
Modifications to market info
Version 5.5 2021.12.17
Modified time delay between alerts
Improvements to market info calculations
Version 5.4 2021.12.14
Modifications to market info calculations
Version 5.3 2021.12.13
Improvements to structure code
Modified trade entry criteria
Version 5.2 2021.12.11
Improvements to structure calculations
Modified entry criteria
Bug fixes
Version 5.1 2021.12.06
Improvements to structure calculations
Modifications to volume calculations
Version 5.0 2021.12.01
Improvements to market info calculations
Modifications to structure code
Added levels to volume info
Version 4.9 2021.11.26
Removed adjustable analysis period
Version 4.8 2021.11.26
Complete change to volume pressure calculations
Improvements to market info calculations
Version 4.7 2021.11.02
Modified entry criteria
Changed default color theme
Volume bar width set to 3
Version 4.6 2021.10.26
Fixed minor bug
Version 4.5 2021.10.22
Improvements to market info calculations
Stretched the volume info mapping to twice the analysis range
Version 4.4 2021.10.18
Modified market info, volume info & entry alert criteria
Version 4.3 2021.10.15
Modifications to market info calculations
Maximum analysis period allowed set to 200
Version 4.2 2021.10.14
Slight modification to structure calculations
Version 4.1 2021.10.13
Modified volume info calculations
Modified structure calculations
Maximum analysis period allowed in 300
Version 4.0 2021.09.29
Low severity bug fixed
Default analysis period set is 100
Minimum analysis period allowed is 20
Maximum analysis period allowed is 500
Version 3.9 2021.09.17
Removed average tag on chart
Modified entry criteria to include average tag as an additional filter
Version 3.8 2021.09.16
Set default analysis period to 180
Set the volume bars width to 2
Version 3.7 2021.09.13
Added a tag to show the moving average on your chart
Version 3.6 2021.08.18
Changes to volume calculations
Default analysis period set to 100
Version 3.5 2021.08.06
Adjustable analysis period
Analysis period default set to 200
Version 3.4 2021.08.06
Analysis period set to 50
Version 3.3 2021.06.25
Restored static structure
Removed dynamic structure
Removed long & short trading zones
Version 3.2 2021.06.24
Replaced dynamic structure with dynamic long & short trading zones
Changed line style on both the chart & the left hand panel
Version 3.1 2021.06.15
Volume info modifications
Version 3.0 2021.06.07
Modified volume calculations
Version 2.9 2021.06.04
Changed structure labels
Version 2.8 2021.05.27
Changes to line style for better visuals
Version 2.7 2021.05.26
Changed market info response from static to dynamic
Version 2.6 2021.05.25
Modification to market info calculations
Modification to entry criteria
Modification to structure period & levels
Version 2.5 2021.05.21
Complete overhaul of the entire structure system from static to dynamic
Removed analysis & volume period parameter changes - all are now pre-coded
Improvements of volume calculations
Changes to chart labels
Version 2.4 2021.05.07
Rectified volume info calculations
Version 2.3 2021.05.06
Modified volume info calculations
Version 2.2 2021.05.06
Modified entry criteria
Version 2.1 2021.05.04
Improvements to structure calculations
Version 2.0 2021.04.27
Improvements to volume info calculations
Added labels to risk management levels [take profit, entry zone & stop loss]
Version 1.9 2021.04.20
Adjustable volume period
Version 1.8 2021.04.20
Corrections to structure analysis
Adjustable analysis period with default set to 50 bars
Version 1.7 2021.04.17
Modified structure calculations
Version 1.6 2021.04.16
Analysis period & trade signal is set to non-adjustable
Version 1.5 2021.04.15
Adjustments to volume info calculations
Analysis period default set to 100 bars
Version 1.4 2021.04.14
Analysis period default set to 200 bars
Version 1.3 2021.04.07
Added volume info bars
Structure is now set to always show on chart
Version 1.2 2021.03.27
Modified Alert Parameters
Version 1.1 2021.03.24
Adjusted Market Info Calculations