• 概要
  • レビュー
  • コメント (14)
  • 最新情報

Namiri Trade Engine

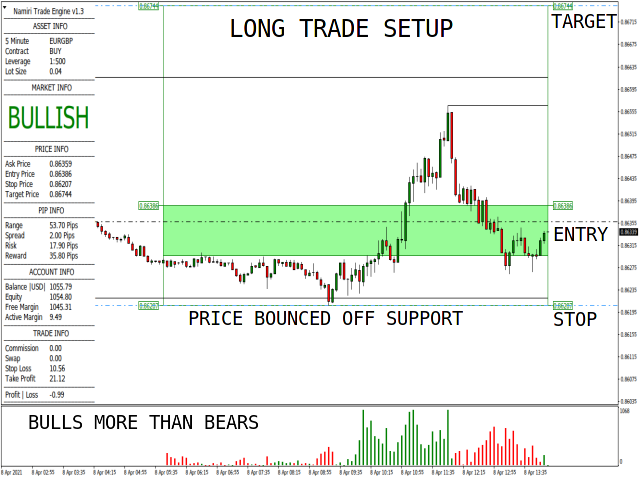
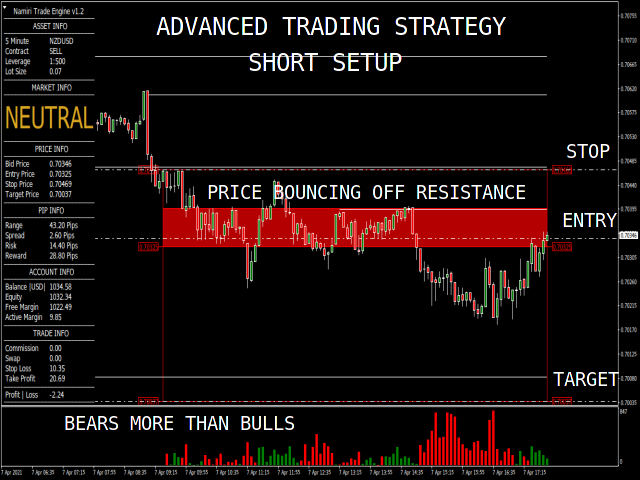
Namiri Trade Engine is an ALL in ONE trading system that combines market structure, volume pressure, market condition & risk management to give you the BEST opportunities for A+ trade setups with auto lot size

WAIT FOR YOUR A+ SETUP || ONLY TAKE YOUR A+ TRADE || RINSE REPEAT YOUR A+ MOVE

Chart Features

  • Panel - Shows the asset, market, price, pip, account, trade & profit|loss information
  • Structure - Shows areas of support & resistance
  • Risk Management - Shows risk analysis period of 100 bars, buy | sell entry zone as well as stop loss & take profit levels for a {1:2 risk:reward}
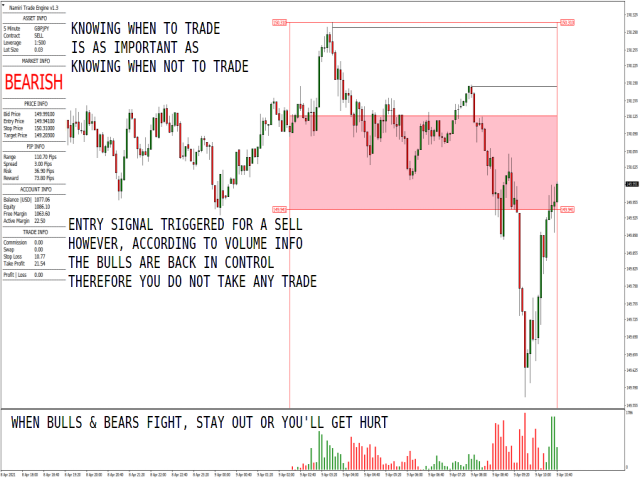
  • Volume - Shows volume pressure bars of bulls & bears at the bottom of your chart

Panel Features

  • Asset Info - Shows current time-frame, pair, contract is a buy|sell, leverage & lot size
  • Market Info - Shows the current market condition
  • Price Info - Shows bid|ask, entry, stop & target prices
  • Pip Info - Shows range, spread, risk & reward in pips
  • Account Info - Shows account balance, equity, free margin & active margin
  • Trade Info - Shows the amounts of commission, swap, stop loss & take profits
  • Profit | Loss - Shows the profit | loss on the active trade on that specific pair

Parameters

  • Maximum Risk - Defaults Of Percent Risk Set To 0.2% Per Trade | Default Pip Risk At 25 Pips Max Risk Per Trade
  • Trade Setups - Bounce | Breach | Defense | Strike  { PICK ONE | MASTER ONE | TRADE ONE }
  • Color Theme - Bullish | Neutral | Bearish | Buy Zone | Sell Zone

Trade Setups

STOP BEHIND STRONG BARRIER || WEAK TO NO BARRIER TO TARGET || VOLUME PRESSURE CONFIRMATION

  • BUY Contract - Trade when a BUY ALERT is triggered for a bounce | breach | defense | strike trade setups with a 10X spread minimum risk, ASK price MUST close inside the LONG entry zone based on BULLISH market info, entry at SUPPORT, bullish volume pressure clusters MUST be significantly STRONGER on the impulse LONG move than the bearish volume pressure clusters, A+ setup has a STOP BELOW a STRONG BARRIER & WEAK to NO BARRIER between your entry & target

  • SELL Contract - Trade when a SELL ALERT is triggered for a bounce | breach | defense | strike trade setups with a 10X spread minimum risk, BID price MUST close inside the SHORT entry zone based on BEARISH market info, entry at RESISTANCE, bearish volume pressure clusters MUST be significantly STRONGER on the impulse SHORT move than the bullish volume pressure clusters, A+ setup has a STOP ABOVE a STRONG BARRIER & WEAK to NO BARRIER between your entry & target

Things To Note

WHEN THE BULLS & BEARS FIGHT STAY OUT OR YOU WILL GET HURT
  • Depending on the risk percentage, spread & leverage, the lot size is some cases are rounded up or down therefore your actual trade amounts may differ slightly;
  • The stop loss & take profit dollar amounts shown under trade info are based on risk percentage plus hard stops and targets, therefore your actual trade amounts may differ slightly depending on your actual entry price, slippage, spreads & rounded lot size
  • Please DO NOT just take each & every trade setup alert, MOST are low quality trade setup alerts because of NO volume pressure confirmations. First, pick one asset, one setup, one time frame. Secondly, ensure its an A+ setup that has been confirmed by the volume pressure & that you have tested, proven & traded on a demo account BEFORE a live account. Lastly, just rinse & repeat those A+ trade setups; Ignore all trade setup alerts during red news on M1 & M5 as they are high risk setups & are most likely false positives

TEST IT || PROVE IT || TRADE IT

Share comments & reviews

おすすめのプロダクト
Limitless MT4は、すべての初心者と経験豊富なトレーダーに適したユニバーサルインジケーターです。 すべての通貨ペア、暗号通貨、生の株式で動作します 無制限のMT4-構成済みで、追加の構成は不要 そして今、主なもの なぜ無制限のMT4なのか? 1再描画の完全な欠如 2トレーディングの最高のスペシャリストによる2年間のテスト 3正しい信号の精度が80%を超える 4ニュースリリース中の取引で好調 取引ルール 1買いシグナル-青い上向き矢印の出現 下向きの赤い矢印の外観を販売するシグナル シグナル後の次のローソク足で取引を開始するには2 3テイクプロフィット チャート上 М1-40ピップ М5-50ピップ М15-55-60ピップ 4ストップロスは利益をとる 5誤った信号をフィルタリングするために、 パラボリックSAR-トレンドとのトレードへの参入を除外する移動平均または同様のトレンドインジケーター。 
The Smooth Price technical indicator is used for plotting a smoothed line as close to the price of the financial instrument as possible, and serves to eliminate its noise components. The indicator is part of the Monarch trading system, but here it is presented as an independent technical analysis tool. The indicator is based on the cluster digital filter , which, unlike the ClusterSMA , is applied directly to the price time series. Smooth Price does not redraw (except the very last, zero bar) an
Dark Sniper arrow indicator. complete lack of redrawing percentage of correct indicator predictions from 80 85% The arrow indicates the direction of the next candle and the possible direction of the trend in the future.  suitable for small m1 timeframes. It is recommended to open deals from 1 to 2 candles. The signal appears on the last candle advantages of the indicator: 1. leading signals. 2.complete lack of redrawing 3. high signal accuracy.
Wave Impulse OmegaScalper - is the manual system for scalping. In many cases Indicator "eats" almost all possible trend wave. System defines up price wave and down price wave. Inside the exact wave - system defines true trend movement and choppy market. Indicator plots signals while market is trending, powerfull and has quiet good volatility. This is complete system with enter and exit points. Main Indicator's Features Signals are not repaint,non-late or disappear(exept cases when system recalcu
クオンツ移動平均勾配は、方向性と勢いを与える非常に強力な指標です。 インジケーターは塗り直しではありません。ma角度を効率的に計算してトレンドを見つけることができます。 シグナルキャンドルが閉じられると、利益カウントが始まります。 したがって、ライブで行われるのは正確な結果です。 提案されたTimeFrameはH1でそれを使用しています。 インジケーターのすべてのオプションは編集可能です。 ヒント:トレードスイングとトレンドブレイクアウトの方向。 フラクタル、練行足、ボリンジャーバンドは、精度と収益性を向上させることができます。 高低は、角度線の発散アプローチを使用して見つかる可能性があります。 このインジケータは、サポート抵抗、供給需要インジケータの追加確認として使用できます。 Ma勾配情報は、トレンドの方向と出口点を使用して入力するのに非常に役立ちます。 それは外国為替、株式、インデックスのために働きます。 PushNotifications / Email / SoundAlerts / PopUpAlertsでアラートを受け取ることができます。
Welcome to the world of SMC (Smart Money Concepts) Trading, where we empower traders with the tools and knowledge to make smarter trading decisions. Our latest addition to our suite of trading tools is the SMC Trading Pro indicator, version 1.0. Key Features: Major Market Structure Identification with BODY break. Order Block must be in Major Swing ( not Small Swing ). Order Block with Fair Value Gap Detection. Order Block in Discount | Premium zone. Filter for only Bullish, Bearish or All Order
POWER TO GET WEALTHY TRADING SYSTEMS.  NON REPAINT REVERSAL ARROW AND CHANNEL  Intra-Day trading and Scalping Strategy:   Designed for fast and accurate day trading and short-term trades. Day and Swing Trading Strategy:   Can be used as a reliable tool for day and swing traders who aim for the big moves of the price. Multi Currencies and Markets:   Works on different instruments and markets with its reliable precision. Multi Timeframes:   Can be used on multiple timeframes with good perfor
Forex Trend Scanner MT4
Carl Gustav Johan Ekstrom
5 (1)
The Forex Trend Scanne r is a powerful tool designed to revolutionize currency strength analysis. It caters to traders of all levels, offering guidance on what to trade and in which direction. This versatile model allows users to include any currency-related symbol, such as Gold (XAU/USD), Silver (XAG/USD), and even Bitcoin (BTC/USD). With compatibility across all time frames and default settings covering 28 major pairs, it provides comprehensive insights for informed trading decisions. Whether
FREE
This indicator identifies and displays zones, as it were areas of strength, where the price will unfold. The indicator can work on any chart, any instrument, at any timeframe. The indicator has two modes. The indicator is equipped with a control panel with buttons for convenience and split into two modes. Manual mode: To work with manual mode, you need to press the NEW button, a segment will appear. This segment is stretched over the movement and the LVL button is pressed. The level is displayed
Binary Options Support Resistance Indicator This indicator is designed for binary options trading and effectively shows retracements from support and resistance levels. Signals appear on the current candle. A red arrow pointing downwards indicates a potential selling opportunity, while a blue arrow pointing upwards suggests buying opportunities. All that needs adjustment is the color of the signal arrows. It is recommended to use it on the M1-M5 timeframes as signals are frequent on these timef
ギャラクティックボリュームスプレッド分析(VSA)は、ボリュームを視覚化するために設計されたインジケーターであり、異なるペアのスプレッドのボラティリティに影響する割合です。 戦略は以下から構成されます。 ブルトレンド: 常にトレンドに賛成し、Galactic VSAインディケーターによって示される高ボリュームと一致する限り、トレンドの低価格でのオープン購入オペレーション。 下降トレンド: 常にトレンドに賛成し、トレンドの高値でオープンな営業活動を行います。ただし、Galactic VSAインディケーターによって示される高ボリュームと一致します。 優先ペア: EURUSD、GBPUSD、USDJPY H1未満の時間枠を推奨するのではなく、スイング取引でインジケーターをテストしました。 
Black series MT4 - The indicator is designed for trading on binary options with Timeframe M1-M5-M15 Multicurrency (Works on cryptocurrency and currency pairs) The signal appears when the candle opens Up to 90% correct signals There is no signal redrawing at all Can be used with other indicators. Good for scalping! In Settings there is: -Indicator working methods -I Allert Arrow color Red signal down Blue signal up Also watch the video how the indicator works and signals
This indicator displays Stochastic osc signals on the price chart and allows the user to receive notifications of such signals. The Stochastic indicator is a classic and proven indicator of the technical analysis of the markets. Despite its age, it is still relevant today. Depending on the settings, the indicator allows you to work effectively on various TFs and any markets. Signals are given on fully formed bars and are not redrawn. Custom Parameters: Stochastic_Price (0-1) - The applied pric
FREE
In Out Trend is a trend indicator for working in the Forex market. A feature of the indicator is that it confidently follows the trend, without changing the signal if the price slightly pierces the trend line. The indicator is not redrawn. In Out Trend - the indicator gives entry signals at the most logical prices after the price pierces the trend line. The indicator works on the basis of mathematical calculations on the price chart. It is one of the most common and useful indicators for find
The Donchian channel is an indicator that takes a series of user-defined periods and calculates the upper and lower bands. Draw two lines on the graph according to the Donchian channel formula. This straightforward formula is based on: The top line is the highest price for the last periods n The bottom line is the lowest price for the last periods n Trend systems follow periods when support and resistance levels are broken. in this case when the price breaks the upper line or the lower line
FREE
This is the complete REX package. It consists of the lite, pro and ULTRA version.  Perfect for beginners and intermediates. REX complete is 100% non repaint. The strategy is based on a mix of different strategies, statistics, including pivot points, oscillators and patterns.  As the trading idea consists of a variety of some classic indicators like Momentum, Williams Percent Range, CCI, Force Index, WPR, DeMarker, CCI, RSI and Stochastic, it is clear that the fundamental indicators have being
Introduction It is common practice for professional trades to hide their stop loss / take profit from their brokers. Either from keeping their strategy to the themselves or from the fear that their broker works against them. Using this indicator, the stop loss / take profit points will be drawn on the product chart using the bid price. So, you can see exactly when the price is hit and close it manually.  Usage Once attached to the chart, the indicator scans the open orders to attach lines fo
You can use the indicator as the main one to determine the trend. The indicator can work both for entry points and The Chord Trend indicator works well on longer trend sections. In flat it is recommended to use filters of your choice. It can accompany the position with a stop, it is recommended to set the stop at a fixed distance from the point formed by the indicator. If you combine the use of the indicator as an input and accompanying a position, then to accompany the stop it is necessary tha
Trading the currency markets is a complex business, not least since we are dealing with pairs of currencies, and by inference, pairs of economies. All economies around the world are interlinked, and reflected in the constant ebb and flow of currency strength and weakness. The problem for us as traders is monitoring so many pairs simultaneously, since every pair does not move independently, but reflects the interrelated nature of this market. The Quantum Currency Heatmap delivers the informatio
BSA indicator is a ZigZag based indicator. This indicator is used to find the reversal level of the price. You can use the existing risk ratio and calculation timeframe in the entries by optimizing them according to your usage preference.  In lower time frames, the indicator can repaint. For healthier results, you can detect the least repainting by observing for a while according to the graphic you will apply.
MT My Way
Issara Seeboonrueang
Best strategy,  Easy trade ,  Support of version update in the future MT My Way: Why are there fewer successful traders than failed traders????? The idea of ​​this indicator is that at the point of opening an order, if you ask other traders, they will trade on the opposite side.  So you trade opposite other trader and (Hidden message: It is making profit along with the broker.)   (^_^)   (^-^)   (^ ^)   (^.^) "Trade opposite to others, You will win"  If this idea is true, You may not wan
Indicator from the  Real Non RePaint MultiTimeFrame  (Real NRP MTF) series. Specially designed to display the standard Stohastic indicator from the senior timeframe (TF) to the junior. The indicator differs from the standard scale - symmetrical relative to 0. Add 50.0 to the readings to get the standard values. Does not look into the future for history at the senior TF. DOES NOT DIFFER from the real-time standard indicator (offset-based), but shows the actual indicator counts on the history
***** The REAL , ORIGINAL, Non-Repainting, Non-Delaying, Arrow Trade Entry indicator for Very Low-Risk market execution ***** Check MYFXBOOK HERE!!! Check out my   LIVE   channel to see the EA based on this Indicator in profitable action! Check My Profile . ***This is the Golden standard in arrow indicators for MT4.*** BING Setup Arrows Indicator(BSA) will show easy-to-read High Probability trading situations with Non-Repainting , Non-Delaying , Up or Down arrows on the graph.  So simple, it'
Unlock the secrets of the market with our groundbreaking indicator, [Univerasal Code], a fusion of astronomy strategy and numerology calculations. This unique tool revolutionizes your trading approach by dynamically drawing precise support and resistance levels on your MetaTrader charts. Key Features: Astro-Numerical Precision: Leverages advanced astronomy strategy and numerology calculations for unparalleled precision in identifying support and resistance levels. Unveils a strategic approach to

Naked Forex Kangaroo Tail Pro Indicator Kangaroo Tail Pro Indicator is a pattern recognition indicator for Forex, Stocks, Indices, Futures, Commodities and Cryptos. The Kangaroo Tail is a multi-bar pattern. The Kangaroo Tail pattern is very effective and is very simple to trade. The strategy that comes with the Kangaroo Tail is based on price action. The indicator does what it was designed for: displaying Kangaroo Tail patterns.   Don't expect to follow the up and down arrows and make mo
You can trade on any underlying asset, but testing specialists prefer the USD / JPY, EUR / USD currency pair. The most favorable time for work is considered the European, American session.  of correct transactions When the blue arrow appears under the candle, the UP option is acquired. When the red arrow appears, the DOWN option is acquired. One peculiarity of the indicator should be noted: a signal is formed when a candle is opened, opening a trade is worth this bar. The signal will appear on t
タイトル: ノンリペイント XY トレンドインジケーターの紹介: フォレックスとバイナリオプションで成功するための究極のガイド はじめに: ノンリペイント XY トレンドインジケーターは、複雑で常に変化する金融市場において、トレーダーが情報に基づいた意思決定を行うために設計された革新的な取引ツールです。この高度な MetaTrader 4 (MT4) インジケーターは、リペイントという一般的な問題を排除しながら、驚くほどの精度で価格トレンドを予測するそのユニークな能力により、トレーダーの間で大きな人気を集めています。 インジケーターの理解: ノンリペイント XY トレンドインジケーターを際立たせている重要な機能の一つは、その精度へのこだわりです。過去のシグナルをリペイントし、トレーダーに信頼性の低いデータを残してしまう他の多くのインジケーターとは異なり、このインジケーターは一貫性を保っています。トレーダーは、生成されたシグナルが過去の価格変動を正確に反映していることを知って、安心して取引できます。 XY トレンドインジケーターは、高度なアルゴリズムを使用して価格データを分析し、市場のト
This Indicator is use the ZigZag to calculate the Upper and  Lower Bound and the uptrend and the downtrned. Red for downtrend, Green for uptrend and Yellow is for the horizontal trend this horizontal trend also bookmarked the upper limited and the lower limited the the price swings.  Or in simple the Support and the Resistance level. However, You may use the Heikin Ashi to confirm the trend of the buy sell signal above. I cannot guarantee the win rate, Nevertheless, you must study well the timef
This indicator displays in a separate window the difference between the number of points which increased the price, and the number of points that decreased the price during the time interval specified in the settings. The time interval for calculation is expressed as the number of bars of the chart the indicator is attached to. This approach allows you to evaluate the movement direction (growth or fall) of the instrument's price, the strength of the movement and the size of the movement in point
ReboltP
David Theodore Caro-greene
リバランスオーバーレイテクノロジー(Rebolt)を使用すると、トレーダーは、あるチャートから別のチャートへのお金の流れを視覚化できます。 Rebolt Probabilityは、ユーザーが指定した間隔で、指定された期間、あるチャートから別のチャートにお金が流れた確率を示します。 ReboltがCyanまたはBlueを読み取る場合、これらはユーザーが指定した時間の間、または競合する信号が発生するまでの間、適切なサインを購入しています。 ReboltがVioletまたはRedを読み取ると、ユーザーが指定した時間の間、または競合する信号が発生するまでの間、売りの兆候が見られます。 Reboltは、価格変化の推定値(Rebolt Delta)、予想価格変化あたりの推定ドル値(Rebolt Delta $)、および予想される変化がチャートに追加または減算されて、将来の予想価格を表すオーバーレイとしても公開されます( Rebolt Overlay)。
このプロダクトを購入した人は以下も購入しています
WARNING!! THIS SWORD IS TOO SHARP!    ONLY 10 COPIES LEFT FOR THE NEXT PRICE TO BE 8,000$ FOR UNLIMITED PLAN. Dear traders I am very glad once again to introduce to you my other tool called "Forex Sword Indicator". In short this tool is meant to give you an edge over the market that you have been waiting for  so long. Now, here it is. It is a very very simple tool but yet a dangerous sword. I call it a  Holy grail indicator!. I will not talk a lot about this tool. Just let the tool speak by itse
The breakout algorithm is a technique based on price, price features, to shape a breakout strategy. The strategy in this indicator will not be redrawn (none-repaint indicator), it is suitable for short or long term traders In the screenshot is the EURUSD pair, these currency pairs, commodities or stocks, it have similar strength *Non-Repainting (not redrawn) *For Metatrader4 Only *Great For Scalping *Great For Swing Trading *Arrow Entry, Green is Long, Red is Short *Works On Any Timeframe *Work
Automatic, live & interactive picture of all trendlines. Assign push, email and sound alerts to the lines of your choice and be informed about price rollback, breakout, rollback after breakout, number of rollbacks, line expiration by double breakout. Correct, drag or delete the lines and interactively tune the line system. https://youtu.be/EJUo9pYiHFA . Chart examples https: //www.mql5.com/en/users/efficientforex Price Interaction Events All events are effective immediately and only after on
The [GRAFF] III manual trading system is based on multiple MetaTrader (MT4) indicators. Together, the entire PACK of GRAFF III indicators makes an advanced trading tool. The system consists of over 20 different custom-built indicators which have been carefully selected and tested in the long term to produce strong and efficient trading signals. The particular indicators are based on different mathematical formulas, so the entire system is calibrated to remove false signals from its own indicator
Let´s try to make some real money! Call me profit addicted. I thought why not try to make THE dream come reality. With discipline, a clear strategy and this indicator I focus on entering the perfect trades. This indicator is very easy to use as you will get perfect entry points for Put or Call trades. The arrows are calculated with: -     Momentum  parameters -     Candle stick patterns -     Fundamental Price action We recommend to combine it with Parabolic, ZigZag or Elliot waves indic
Golden Chip provides Basic Market Structure, Fibonacci, supply and Demand Zones. Letting you identify when a sell off point is approaching or whne a buy opportunity is arriving. The awesome thing about Golden Chip is that, you will see rejection levels or continuation before ANYBODY ! This indicator moves directly with price and lines up perfectly with the Chart. Some indicators would lag but NOT this one ! Golden Chip is amazing for Clean chart (Naked Chart). GOLDEN CHIP IS ONLY ON METATRADER (
FxBears Super Trading Indicator を使用した高度な取引の世界へようこそ。 MT4 プラットフォーム専用に設計されたこの革新的なツールは、エリオット波動、需要供給ゾーン、内部インジケーターの力を組み合わせて、情報に基づいた取引決定のための高品質のシグナルをトレーダーに提供します。 90% 以上の成功率を誇る FxBears Super は、あなたの取引戦略に新たなレベルの精度と収益性をもたらします。 Of Corse は再描画も再描画もありません。 エリオット波動分析:      FxBears Super はエリオット波動の予測可能性を活用し、市場サイクルとトレンドを特定します。 特徴的な5波動インパルスと3波動修正パターンを分析し、潜在的な転換点や継続パターンを高精度に抽出します。 需要と供給のゾーン:      需要ゾーンと供給ゾーンの重要性を認識し、FxBears Super はチャート上の重要なサポートとレジスタンスのレベルを正確に示します。 市場センチメントが変化するこれらのゾーンは、潜在的な価格反転やブレイクアウトに関する貴重な洞
Gann Made Easy は、ミスター・ギャンの理論を使用した取引の最良の原則に基づいた、プロフェッショナルで使いやすい外国為替取引システムです。 W・D・ガン。このインジケーターは、ストップロスとテイクプロフィットレベルを含む正確な買いと売りのシグナルを提供します。 PUSH通知を利用して外出先でも取引可能です。 購入後はご連絡ください!私の取引のヒントと素晴らしいボーナスインジケーターを無料で共有します! おそらく、ギャンの取引手法についてはすでに何度も聞いたことがあるでしょう。通常、ギャンの理論は初心者のトレーダーだけでなく、すでにある程度の取引経験がある人にとっても非常に複雑なものです。なぜなら、ギャンの取引手法は理論的にはそれほど簡単に適用できるものではないからです。私はその知識を磨き、最良の原則を私の外国為替インジケーターに組み込むために数年を費やしました。 このインジケーターは非常に簡単に適用できます。必要なのは、それをチャートに添付し、簡単な取引推奨事項に従うだけです。このインジケーターは常に市場分析の仕事を行い、取引の機会を探します。適切なエントリーポイントを検出
現在26%オフ 初心者やエキスパートトレーダーに最適なソリューション! このインジケーターは、独自の機能と新しい計算式を取り入れた、ユニークで高品質、かつ手頃な価格のトレーディングツールです。たった1枚のチャートで28の為替ペアの通貨強度を読み取ることができます。新しいトレンドやスキャルピングチャンスの引き金となるポイントを正確に特定することができるので、あなたのトレードがどのように改善されるか想像してみてください。 ユーザーマニュアルはこちら  https://www.mql5.com/en/blogs/post/697384 これが最初の1本、オリジナルだ! 価値のないクローンを買わないでください。 特別な サブウィンドウの矢印で強い通貨の勢いを表示 GAPがあなたのトレードを導く! 基準通貨や気配値が売られすぎ・買われすぎのゾーン(外相フィボナッチレベル)にあるとき、個別チャートのメインウィンドウに警告表示。 通貨がレンジの外側から反落した場合、プルバック/リバーサルのアラート。 クロスパターンの特別なアラート 複数の時間枠を選択可能で、トレンドを素早く
まず第一に、この取引インジケーターは再描画されず、再描画されず、遅延しないことを強調する価値があります。これにより、手動取引とロボット取引の両方に理想的なものになります。 ユーザーマニュアル:設定、入力、戦略。 アトミックアナリストは、価格の強さとモメンタムを利用して市場でより良いエッジを見つけるためのPA価格アクションインジケーターです。ノイズや誤ったシグナルを除去し、取引ポテンシャルを高めるための高度なフィルターを備えています。複雑なインジケーターの複数のレイヤーを使用して、アトミックアナリストはチャートをスキャンし、複雑な数学的計算をシンプルなシグナルと色に変換します。これにより、どのような初心者トレーダーでも理解して使用し、一貫した取引の決定を行うことができます。 「アトミックアナリスト」は、新規および経験豊富なトレーダー向けにカスタマイズされた包括的な取引ソリューションです。プレミアムインジケーターとトップノッチの機能を1つの取引戦略に組み合わせ、すべてのタイプのトレーダーにとって汎用性のある選択肢にします。 デイリートレーディングとスキャルピング戦略:高
Reversal First Impulse levels (RFI)    INSTRUCTIONS        RUS       -       ENG              R ecommended to use with an indicator   -   TREND PRO -  Version MT5 A key element in trading is zones or levels from which decisions to buy or sell a trading instrument are made. Despite attempts by major players to conceal their presence in the market, they inevitably leave traces. Our task was to learn how to identify these traces and interpret them correctly. Main functions: Displaying active zones
An exclusive indicator that utilizes an innovative algorithm to swiftly and accurately determine the market trend. The indicator automatically calculates opening, closing, and profit levels, providing detailed trading statistics. With these features, you can choose the most appropriate trading instrument for the current market conditions. Additionally, you can easily integrate your own arrow indicators into Scalper Inside Pro to quickly evaluate their statistics and profitability. Scalper Inside
TrendMaestro
Stefano Frisetti
5 (2)
note: this indicator is for METATRADER4, if you want the version for METATRADER5 this is the link:  https://www.mql5.com/it/market/product/108106 TRENDMAESTRO ver 2.4 TRENDMAESTRO recognizes a new TREND in the bud, he never makes mistakes. The certainty of identifying a new TREND is priceless. DESCRIPTION TRENDMAESTRO identifies a new TREND in the bud, this indicator examines the volatility, volumes and momentum to identify the moment in which there is an explosion of one or more of these data a
Manual guide:   Click here Starting price of  $88  for the first 25 copies only ( 3  left)! -- Next price is  $176 .  This indicator is unstoppable when combined with our other indicator called  Support & Resistance . After purchase, send us a message and you could get  it  for  FREE as a BONUS!  Introducing Trend Punch , the revolutionary forex trend indicator that will transform the way you trade! Trend Punch is uniquely designed to provide precise buy and sell arrows during strong
Advanced Supply Demand
Bernhard Schweigert
4.92 (311)
現在33%オフ 初心者にもエキスパートトレーダーにも最適なソリューション このインジケーターは独自の機能と新しい公式を多数内蔵しており、ユニークで高品質かつ手頃な取引ツールです。このアップデートでは、2つの時間枠ゾーンを表示できるようになります。より長いTFだけでなく、チャートTFとより長いTF(ネストゾーンを表示)の両方を表示できます。すべてのSupply Demandトレーダーの皆さんのお気に召すはずです。:) 重要情報の公開 Advanced Supply Demandの可能性を最大化するには、 https://www.mql5.com/ja/blogs/post/720245 にアクセスしてください。   エントリーまたはターゲットの正確なトリガーポイントを正確に特定できれば取引がどのように改善されるか想像してみてください。新しい基盤となるアルゴリズムに基づいて構築されているため、買い手と売り手の間の潜在的な不均衡をさらに簡単に特定できます。これは、最も強い需要と供給のゾーンと、過去のパフォーマンス(古いゾーンを表示)がグラフィカルに表現されるためです。これらの機能は、最適
TPSpro TRENDPRO  - is a trend indicator that automatically analyzes the market and provides information about the trend and each of its changes, as well as giving signals for entering trades without redrawing! The indicator uses each candle, analyzing them separately. referring to different impulses - up or down impulse. Exact entry points into transactions for currencies, crypto, metals, stocks, indices!  -  Version MT5               DETAILED DESCRIPTION                R ecommended to use with
カスタムMT4インジケーターで外国為替取引を成功させるための秘密を発見してください! 外国為替市場で成功を達成し、リスクを最小限に抑えながら一貫して利益を得る方法を疑問に思ったことはありますか? これがあなたが探している答えです! 取引へのアプローチに革命をもたらす独自のMT4インジケーターを導入できるようにします。 ユニークな汎用性 私たちのインジケータは、RenkoとRangeBarのろうそくのフォーメーションを好むユーザー向けに特別に設計されています。 これらのチャートタイプは多くの経験豊富なトレーダーに好まれていることを理解しています。そのため、私たちのインジケーターはそれらとシームレスに統合され、比類のない市場分析を提供します。 クリアトレンドシグナル 複雑な分析を忘れてください! 私たちのインジケーターは、鮮やかな色と明確なドット構造を利用して、市場の動向を明確に示しています。 赤と青の点は、価格の動きの方向性について疑いの余地がなく、取引の迅速な意思決定を可能にします。 HH/HL HL/LL戦略とのアライメント HH/HLおよびHL/LL構
Break and Retest
Mohamed Hassan
4.33 (12)
New update to V.4 where  Break & Retest automatically draws the take profit & stop loss levels and you also have more signals per day! ‍You can visually backtest Break & Retest to see how it behaved in the past!     Manual guide:   Click here $65  for only 1  copy left! Next price is $120 .  This Indicator only places quality trades when the market is really in your favor with a clear break and retest. Patience is key with this price action strategy! If you want more alert s
現在20%OFF! 初心者やエキスパートトレーダーのためのベストソリューション! このダッシュボードソフトウェアは、28の通貨ペアで動作しています。それは私達の主要な指標(高度な通貨の強さ28と高度な通貨インパルス)の2に基づいています。それは全体の外国為替市場の大きい概観を与えます。それは、すべての(9)時間枠で28の外国為替ペアのための高度な通貨の強さの値、通貨の動きの速度と信号を示しています。チャート上で1つのインディケータを使用して市場全体を観察し、トレンドやスキャルピングの機会をピンポイントで見つけることができたら、あなたのトレードがどのように改善されるか想像してみてください。 このインディケータには、強い通貨と弱い通貨の識別、潜在的な取引の識別と確認がより簡単になるような機能が搭載されています。このインディケータは、通貨の強さや弱さが増加しているか減少しているか、また、すべての時間枠でどのように機能しているかをグラフィカルに表示します。 新機能として、現在の市場環境の変化に適応するダイナミックなマーケットフィボナッチレベルが追加され、すでに当社のAdvan
ブレーカートレーダーになり、価格が反転すると市場構造からの利益が変化します。 注文ブロックブレーカーインジケーターは、トレンドまたは価格の動きが枯渇に近づいており、逆転の準備ができていることを識別します。通常、反転または大規模なプルバックが発生しようとしているときに発生する市場構造の変化について警告します。 この指標は、ブレイクアウトと価格の勢いを識別する独自の計算を使用します。使い果たされる可能性のあるポイントの近くで新しい高値が形成されるたびに、インディケーターはその高値の作成を担当する最後の注文ブロックを描きます。次に、移動する価格とともに注文ブロックを追跡します。その後、価格が反対方向にシフトし、その注文ブロックを突破すると、新しい市場構造を作成し、トレンドまたは大きな後退の可能性のある反転の開始を警告します。 注文ブロックは、高値/安値が作成される前の最後の反対色のろうそくであり、価格がこれらの重要な領域を下抜けすると、トレンドの短期的ま​​たは長期的な反転の兆候です。 特徴 重要な枯渇点での市場構造の変化を警告します 価格が使い果たされるレベルに近づくと、
Gold Stuff
Vasiliy Strukov
4.89 (256)
Gold Stuff は、金専用に設計されたトレンド指標であり、あらゆる金融商品にも使用できます。 インジケーターは再描画せず、遅れません。 推奨時間枠 H1. それインディケータでフルオートExpert Advisor EA Gold Stuffが動作します。 あなたは私のプロフィールでそれを見つけることができます. 設定と個人的なボーナスを得るために、購入後すぐに私に連絡してください!   設定 矢印を描く - オンオフ。 チャートに矢印を描く。 アラート - 可聴アラートのオンオフ。 メール通知 - オンオフ。 電子メール通知。 プチ通知 - オンオフ。 プッシュ通知。 次に、色域を調整します。 Gold Stuff は、金専用に設計されたトレンド指標であり、あらゆる金融商品にも使用できます。 インジケーターは再描画せず、遅れません。 推奨時間枠 H1. それインディケータでフルオートExpert Advisor EA Gold Stuffが動作します。 あなたは私のプロフィールでそれを見つけることができます. 設定と個人的なボーナスを得るために、購入後
通貨強さウィザードは、取引を成功させるためのオールインワン ソリューションを提供する非常に強力な指標です。このインジケーターは、複数の時間枠のすべての通貨のデータを使用して、このまたはその外国為替ペアのパワーを計算します。このデータは、使いやすい通貨インデックスと通貨パワーラインの形式で表され、特定の通貨のパワーを確認するために使用できます。 必要なのは、取引したいチャートにインジケーターを接続することだけです。インジケーターは、取引する通貨の実際の強さを示します。このインジケーターは、トレンドに合わせて取引するときに有利に利用できる売買高の圧力の極値も示します。このインジケーターには、フィボナッチに基づく可能なターゲットも表示されます。 このインジケーターは、PUSH 通知を含むあらゆるタイプのアラートを提供します。 購入後ご連絡下さい。私の取引のヒントをあなたと共有し、素晴らしいボーナスインジケーターを無料で提供します! 幸せで有益な取引をお祈りします。
もちろんです。以下は、提供いただいたテキストの日本語への翻訳です: MT4用の天文学指標をご紹介します:究極の天体トレーディングコンパニオン トレーディング体験を天空の高みに高める準備はできていますか?私たちの革命的なMT4用の天文学指標をご紹介します。この革新的なツールは、複雑なアルゴリズムの力を借りて、類まれなる天文学的洞察と精密な計算を提供します。 あなたの指先で宇宙の情報を: 宝のような天文学的データが明らかになる包括的なパネルをご覧ください。惑星の地理的/太陽中心座標、太陽と地球の距離、星の大きさ、伸び、星座、黄道座標および赤道座標、さらには水平座標まで、それぞれが綿密に計算され美しく表示されています。指標によって生成される垂直線は時間値に対応し、トレーディングの旅に宇宙の視点を提供します。 惑星のラインと関係: グラフを飾る惑星のラインの魔法を体験し、スケールと角度をカスタマイズできます。直感的なコントロールパネルを介して各惑星のラインの表示を簡単に切り替えることができます。指定された時刻範囲内での合会、六分会、四分会、三分会、対会、逆行の指標で天体の関係の芸術を発見してく
Trend Screener
STE S.S.COMPANY
4.83 (88)
トレンドインジケーター、1つのツールに組み込まれたすべての重要なトレンド機能を備えたトレンドトレーディングとフィルタリングのための画期的なユニークなソリューション! これは、すべてのシンボル/商品(外国為替、商品、暗号通貨、インデックス、株式)で使用できる100%再描画されていないマルチタイムフレームおよびマルチ通貨インジケーターです。 トレンドスクリーナーは、チャート内のドットで矢印トレンドシグナルを提供するインジケーターに続く効率的なインジケーターです。 トレンド分析インジケーターで使用できる機能: 1.トレンドスキャナー。 2.最大利益分析を備えたトレンドライン。 3.トレンド通貨強度メーター。 4.アラート付きのトレンド反転ドット。 5.アラート付きの強いトレンドドット。 6.トレンド矢印 毎日の分析例、毎日のシグナルパフォーマンス...など、トレンドスクリーナーインジケーターを使用して、ここで見つけることができます: ここをクリックしてください 期間限定オファー:トレンドスクリーナーインジケーターは、50ドルと生涯でのみご利用いただけます。 (元の価格125 $) MQ
ICT, SMC, SMART MONEY CONCEPTS, SMART MONEY, Smart Money Concept, Support and Resistance, Trend Analysis, Price Action, Market Structure, Order Blocks, BOS/CHoCH,   Breaker Blocks ,  Momentum Shift,   Supply&Demand Zone/Order Blocks , Strong Imbalance, HH/LL/HL/LH,    Fair Value Gap, FVG,  Premium  &   Discount   Zones, Fibonacci Retracement, OTE, Buy Side Liquidity, Sell Side Liquidity, BSL/SSL Taken, Equal Highs & Lows, MTF Dashboard, Multiple Time Frame, BigBar, HTF OB, HTF Market Structure, 
TrendDecoder Premium
Christophe Pa Trouillas
5 (4)
レンジと次の動きを特定    |  トレンドの最も早いシグナルと強さを得る   |  反転の前に明確な出口を得る   |  価格がテストするフィボ・レベルを見つける。 非リペイント、非遅延インディケータ - マニュアルおよび自動売買に最適 - すべての資産、すべての時間単位に対応 期間限定キャンペーン   >> 50%OFF 購入後、 推奨セッティングについては、このチャンネルで私に連絡してください。 MT5 バージョン: ここをクリック BladeSCALPER   と   PowerZONES   を使った完全な方法を入手する どのようなものですか? TrendDECODERは、トレンド監視をシンプルかつ簡単にするための複数のイノベーションを集約したものです。 Projective TrendLine (投影トレンドライン) - 今後のトレンドのスピードリファレンス。 RealTime TrendLine vs. Projective TrendLine (リアルタイムトレンドライン vs. Projective TrendLine) - 市場が同じ方
FX Volume
Daniel Stein
4.6 (35)
mql5と Telegramの モーニング・ブリーフィングで、詳細とスクリーンショットを含む毎日のマーケット・アップデートをご覧 ください! FX Volumeは、ブローカーの視点から市場のセンチメントをリアルに洞察する、最初で唯一の出来高インジケーターです。 ブローカーのような機関投資家が外国為替市場でどのようなポジションをとっているか、COTレポートよりもはるかに速く、素晴らしい洞察を提供します。 この情報をチャート上で直接見ることは、あなたの取引にとって真のゲームチェンジャーであり、画期的なソリューションです。 以下のようなユニークなマーケットデータ洞察から利益を得てください。 比率は 、通貨のロングポジションとショートポジションの比率をパーセントで表示します。 比率の変化は 、選択した期間内のロング比率とその変化率を表示します。 Volumes Totalは 、通貨の取引量(ロングとショート)の合計をロット単位で表示します。 Volumes Long :全通貨のロングポジションの取引量を表示します。 Volumes(ショート )は、全通貨のショートポジションの取引量を表示
The indicator of a Professional Trader is an arrow indicator for predicting the direction of price movement. I have been working on this indicator since 2014. You can use this indicator as your main indicator, use its entry signals, and use it as your only indicator to find entry points. About the product: Recommended TF [H4-D1-W1]   . The indicator predicts the direction of the next candle. Fits a variety of tools; Flexibility in settings for different instruments and intervals through the
まず第一に、この取引ツールはノンリペイント、ノンリドロー、ノンラグの指標であり、プロの取引に理想的ですことを強調する価値があります。 オンラインコース、ユーザーマニュアル、デモ。 スマートプライスアクションコンセプトインジケーターは、新米から経験豊富なトレーダーまで、非常 に強力なツールです。Inner Circle Trader AnalysisやSmart Money Concepts Trading Strategiesなど、20以上の有用な指標を1つに組み合わせています。このインジケーターはスマートマネーコンセプトに焦点を当て、大手機関の取引方法を提供し、彼らの動きを予測するのに役立ちます。 特に、流動性分析に優れており、機関がどのように取引しているかを理解しやすくしています。市場のトレンドを予測し、価格の動きを慎重に分析するのに優れています。機関の戦略とトレードを合わせることで、市場の動向についてより正確な予測ができます。このインジケーターは多目的であり、市場構造を分析し、重要な注文ブロックを特定し、さまざまなパターンを認識するのに優れています。 このインジケー
現在31%オフ! 初心者やエキスパートトレーダーに最適なソリューション! このインジケータは、独自の機能と秘密の数式を組み込んだ、ユニークで高品質かつ手頃な価格のトレーディングツールです。たった1枚のチャートで28の通貨ペアのアラートを表示します。新しいトレンドやスキャルピングチャンスの引き金となるポイントを正確に把握することができるので、あなたのトレードがどのように改善されるか想像してみてください! 新しい基本的なアルゴリズムに基づいて構築されているため、潜在的な取引の特定と確認がより簡単になります。これは、通貨の強さや弱さが加速しているかどうかをグラフィカルに表示し、その加速のスピードを測定するためです。加速すると物事は明らかに速く進みますが、これはFX市場でも同じです。つまり、反対方向に加速している通貨をペアにすれば、利益を生む可能性のある取引を特定することができるのです。 通貨の勢いを示す縦の線と矢印は、あなたの取引の指針となるでしょう。 ダイナミックマーケットフィボナッチ23レベルはアラートトリガーとして使用され、市場の動きに適応します。もしインパルスが黄色
作者のその他のプロダクト
Prometheus Smart Money is an indicator that combines both price & volume with calculations based on other custom indicators, smart volume and retail volume to create this leading indicator that gives you high probability moves to help you make a decision on what is MOST likely to happen in the market going forward Advantages You can use it in ALL financial markets including binary options on ALL asset classes or instruments. You can use it as a stand alone indicator or as a confirmation tool wit
Centaurus Trend Engine is an indicator that uses custom indicators to give the current momentum moves of the market with a multi-timeframe approach to trading Features Value Area -It is the (red/green) rectangular box on your chart based on the dynamic structure period set;Green to indicate you focus on LONG moves & Red for SHORT moves Analysis - Displays The Market Analysis Strength - Displays The Market Strength Trend - Displays The Market Trend Entry State - Displays the BEST entry time for t
Primus Smart Money is an indicator that shows the average of bulls and bears on an asset. Used as a confirmation indicator for bullish and bearish control to assist in predicting future price moves Advantages Used in ALL financial markets including binary options on ALL asset classes or instruments. To be used as a confirmation tool with other indicators Parameters Period - default set to 9 (Recommended) Entry requirements Focus on the clusters on the indicator - the height or depth of the bars
Primus Trading Engine is a trading system that combines price action,ratio based indicators & custom indicators to create this leading indicator with a multi-timeframe approach to give you high probability trade setups for forex,CFD cash/futures,metals & binary option to assist in making predictions on what is MOST likely to happen in the market Main Chart Features Price Action Signal-Arrow displayed on a specific bar;NOT buy/sell arrow;DOES NOT repaint;Bullish arrow on a bullish bar,price is l
Prometheus Trade Engine is an indicator that combines price action, ratio based indicator with custom indicators& other lagging indicators to create this leading indicator that has a multi-timeframe approach to trading so that you are able to see what other timeframes are doing all in one chart and give you high probability trade setups to assist you to make a prediction on what is MOST likely to happen in the market going foward Chart Features 1. Reversal Zone It is the rectangular box on
フィルタ:
レビューなし
レビューに返信
バージョン 16.8 2024.05.23
Added an adjustable maximum pip risk per trade parameter
Improvements to volume pressure code & re-added namiri defense setup
バージョン 16.7 2024.05.05
Removed namiri defense setup
Simplified entry criteria for namiri bounce, breach & strike setups
Improvements to structure to include broken support & resistance
Improvements to volume pressure calculations
バージョン 16.6 2024.03.19
Fixed a critical error on structure support & resistance code
バージョン 16.5 2024.03.19
Removed volume analysis limit
バージョン 16.4 2024.03.16
Improvements to volume pressure calculations
バージョン 16.3 2024.03.14
Improvements to structure to show broken support & resistance
バージョン 16.2 2024.03.12
Adjustments to the volume pressure period
バージョン 16.1 2024.03.07
Set market info & volume info analysis limit to 200 bars
The first 100 volume pressure bars represents "inside the wire"
The last 100 volume pressure bars represents "outside the wire"
バージョン 16.0 2024.02.28
Modified market info calculations
Modified volume pressure calculations
Added a filter to the entry criteria for all namiri trade setups
バージョン 15.9 2024.02.12
Modified entry criteria for namiri breach setup
Improvements to volume pressure calculations
バージョン 15.8 2024.01.29
Modified entry criteria for namiri defense setup
Improvements to volume pressure calculations
バージョン 15.7 2024.01.25
Modified entry criteria for namiri strike setup
Modified volume pressure calculations
バージョン 15.6 2024.01.25
Modified volume info calculations
Modified structure code
バージョン 15.5 2024.01.18
Modified entry criteria for namiri strike setup
Modified volume info calculations
バージョン 15.4 2023.12.01
Re-added namiri strike trade setup
Modified market info calculations
Modified entry criteria for all namiri trade setups
バージョン 15.3 2023.11.09
Modified volume pressure calculations
バージョン 15.2 2023.10.30
Removed strike trade setup
Modified entry criteria for breach & defense trade setups
バージョン 15.1 2023.10.23
Modified volume pressure calculations
バージョン 15.0 2023.10.18
Modified volume pressure calculations
Modified alerts on all trade setups
バージョン 14.9 2023.09.23
Added namiri strike trade setup
Improvements to support & resistance structure calculations
Added trade setup parameter options
Changed parameter options display
バージョン 14.8 2023.09.15
Modified analysis period
Modified namiri bounce setup
バージョン 14.7 2023.08.28
Modified namiri breach & namiri defense entry setups
バージョン 14.6 2023.08.25
Modified namiri bounce, namiri breach & namiri defense setups
バージョン 14.5 2023.08.02
Improvements to support & resistance code
バージョン 14.4 2023.07.24
Modifications to namiri breach & namiri defense entry setups
バージョン 14.3 2023.07.14
Fixed trade info -- commission, swap & stop loss display errors
バージョン 14.2 2023.07.12
Improvements to support & resistance code
バージョン 14.1 2023.07.11
Improvements to volume pressure calculations
バージョン 14.0 2023.07.10
Modified market info calculations
Modified volume pressure calculations
Added entry criteria for 3 entry setups (namiri bounce, namiri breach & namiri defense)
バージョン 13.9 2023.06.02
Modified market info calculations
Modified volume pressure calculations
Modified entry criteria
バージョン 13.8 2023.05.25
Updated entry criteria
バージョン 13.7 2023.05.19
Fixed issues in structure code
Modifications to volume pressure code
バージョン 13.6 2023.05.11
Modified entry criteria
Modified focus hooks
バージョン 13.5 2023.04.27
Improvements to market info to include fast market response
Improvements to volume info to include a longer analysis period
Improvements to structure calculations to include a longer analysis period
バージョン 13.4 2023.04.12
Improvements to volume pressure code
バージョン 13.3 2023.04.05
Added a filter to the entry criteria
Improvements to the volume pressure code
バージョン 13.2 2023.03.28
Removed momentum tag
バージョン 13.1 2023.03.22
Improvements to volume pressure code
Added momentum tag
バージョン 13.0 2023.03.21
Improvements to volume pressure code
バージョン 12.9 2023.03.16
Improvements to volume pressure code
バージョン 12.8 2023.03.15
Improvements to structure code
バージョン 12.7 2023.03.09
Changes to focus hooks on market info
バージョン 12.6 2023.03.09
Increased analysis period range to improve on chart analysis
Modification to display of focus hooks on market info
バージョン 12.5 2023.02.28
Removed volume pressure threshold levels
バージョン 12.4 2023.02.23
Improvements to structure calculations to only show verified levels
バージョン 12.3 2023.02.22
Modifications to market info & volume info
Replaced volume pressure threshold level 30 with level 15
バージョン 12.2 2023.02.21
Modifications to volume pressure
バージョン 12.1 2023.02.20
Removed volume pressure threshold level
Modification to market info focus hooks
バージョン 12.0 2023.02.17
Added volume pressure threshold level 30
Added the minimum 10 pip risk to entry criteria
バージョン 11.9 2023.02.16
Removed volume pressure threshold level
Removed the10 pip minimum risk entry criteria
バージョン 11.8 2023.01.26
Changed structure from dynamic to static
Removed daily, weekly, monthly dynamic structure
Removed daily, weekly, monthly market info direction bias
Removed momentum tag
Added focus hooks on market info
Added volume pressure threshold of level 30 to assist in monitoring the bull & bear fight
バージョン 11.7 2022.12.07
Modifications to structure to include daily, weekly & monthly structure as well as their open (depending on which time frame you are on)
Modifications to volume pressure calculations to confirm if you have a valid setup
Modifications to market info to give you direction bias based on structure & daily, weekly or monthly open (depending on which time frame you are on)
バージョン 11.6 2022.11.11
Changed structure from fixed to dynamic
Added momentum tag to identify whether price is oscillating bullish | bearish
バージョン 11.5 2022.10.26
Modifications to analysis period
Modifications to market info calculations
Modifications to volume pressure calculations
Modifications to potential entry alert criteria
バージョン 11.4 2022.10.06
Modifications to volume info range
Modifications to entry alert criteria
バージョン 11.3 2022.09.29
Modifications to volume pressure calculations
Modifications to trade entry alert criteria
Reduced the default risk to 0.5%
バージョン 11.2 2022.09.27
Modifications to market info calculations
Modifications to volume info calculations
Modifications to structure calculations
バージョン 11.1 2022.09.14
Modifications to analysis period
Modifications to market info calculations
Doubled volume pressure analysis range
バージョン 11.0 2022.08.26
Modifications to entry criteria
Modifications to structure calculations
Modifications to market info calculations
Modifications to volume pressure calculations
Removed volume level threshold
バージョン 10.9 2022.08.19
Modifications to entry criteria
Modifications to market info calculations
Modifications to volume info calculations
Modification of volume level threshold from 15 to 100
バージョン 10.8 2022.08.09
Removed trend stripes
Modifications to entry criteria
Modifications to market info calculations
Modifications to volume info calculations
Added volume level 15 threshold
バージョン 10.7 2022.08.03
Removed average tag
Added trend stripes to market info to highlight overall market focus
Modifications to analysis period
Modifications to market info calculations
Modifications to structure calculations
Modifications to entry criteria
バージョン 10.6 2022.08.01
Added the average tag
Modifications to market info calculations
Modifications to volume pressure calculations
Modifications to entry criteria
バージョン 10.5 2022.07.30
Modifications to volume pressure calculations
Removed threshold level
Removed maximum volume level
バージョン 10.4 2022.07.27
Modifications to volume pressure calculations
Changed the volume pressure threshold from 25 to 30
Set the fixed maximum volume pressure to 60
バージョン 10.3 2022.07.26
Modifications to market info calculations
Added 25 level volume pressure threshold
バージョン 10.2 2022.07.24
Modifications to volume pressure calculations
バージョン 10.1 2022.07.22
Removed psychological structure
Removed moving average tag
Modifications to entry criteria
バージョン 10.0 2022.07.18
Changed from dynamic structure to fixed psychological structure levels
Removed bullish, bearish & neutral color change option
Default percent risk set to 1.0
バージョン 9.9 2022.06.21
Modifications to market info calculations
Changes in entry criteria
バージョン 9.8 2022.05.17
Changed banner to highlight trade risk relative to structure range
バージョン 9.7 2022.05.17
Added more structure levels
Added a banner to highlight no trading with narrow structure range
バージョン 9.6 2022.05.13
Added structure level to the entry criteria
Removed "pending" market info
バージョン 9.5 2022.05.06
Added a 200 MA close level tag on the chart
Added the MA to the entry criteria
バージョン 9.4 2022.05.05
Reduced the number of structure levels
Renamed the structure levels
Removed "pending" market info condition
Changes to entry criteria
バージョン 9.3 2022.05.04
Changed labels on levels to include overall structure focus
Changed structure level period as well as period visibility
Changed market info calculations
Included "pending" market condition to market info meaning "no trade zone"
Changed risk management period
Changed entry criteria parameters
バージョン 9.2 2022.04.28
Changed structure period
Included structure labels
バージョン 9.1 2022.04.27
Changed dynamic structure period
Changed structure zones to structure levels
バージョン 9.0 2022.04.26
Fixed structure code label issue
Fixed entry criteria errors
バージョン 8.9 2022.04.26
Removed some dynamic structure levels
Changed from structure level to structure zone
Change structure period
Changed market info calculations
Changed volume info period
Changed risk management period
バージョン 8.8 2022.04.21
Changed structure levels to structure zones
Changed analysis period, volume info & structure periods
Changed entry criteria
バージョン 8.7 2022.04.20
Changed structure from static to dynamic
Changed volume info calculations
バージョン 8.6 2022.04.14
Changed from dynamic structure to fixed structure
バージョン 8.5 2022.04.13
Renamed structure levels
Changed volume period
バージョン 8.4 2022.04.08
Added structure labels to know where price is on the chart
Modified entry criteria
Changed trade range to structure range
バージョン 8.3 2022.04.06
Changed period to volume info calculations
Added a filter to entry criteria
バージョン 8.2 2022.04.04
Complete structure overhaul from static to dynamic
Improvements to market info calculations
Minor adjustment to the entry criteria
Removed redundant code
バージョン 8.1 2022.03.30
Cleaned up the overall code by removing outdated code
Improvements to structure calculations for a slightly more high probability structure zones
バージョン 8.0 2022.03.30
Modified period to market info calculations
Adjustments to risk management tool
Modified period to volume info calculations
Modified period to structure calculations
バージョン 7.9 2022.03.25
Improvements to market info & volume info calculations
バージョン 7.8 2022.03.22
Improvements to volume info calculations
バージョン 7.7 2022.03.21
Improvements to market info calculations
バージョン 7.6 2022.03.16
Removed probability factor to buy & sell contract
Modifications to volume info
バージョン 7.5 2022.03.16
Modifications to volume info
Added a probability factor to buy & sell contracts
バージョン 7.4 2022.03.15
Improvements to market info calculations & risk management tool
バージョン 7.3 2022.03.14
Modifications to risk management tool
バージョン 7.2 2022.03.12
Modifications to risk management & volume info
バージョン 7.1 2022.03.11
Improvements to market info calculations
バージョン 7.0 2022.03.04
Fixed entry alert criteria
Improvements to market info calculations
バージョン 6.9 2022.03.04
Restructured the risk management tool for high probability trade setups
バージョン 6.8 2022.03.01
Improvements to volume info calculations
バージョン 6.7 2022.02.26
Revert from dynamic structure to fixed structure
バージョン 6.6 2022.02.23
Changes to structure naming
Extended structure period
バージョン 6.5 2022.02.22
Complete structure overhaul from static to dynamic
Improvements to market info & volume info calculations
Minor adjustment to the entry criteria
バージョン 6.4 2022.02.18
Improvements to market info calculations
バージョン 6.3 2022.02.18
Added a filter on the entry criteria
バージョン 6.2 2022.02.11
Improvements to structure calculations
バージョン 6.1 2022.02.10
Improvements to volume calculations
Modifications to entry criteria
バージョン 6.0 2022.01.31
Modified structure calculations
Changed volume pressure chart presentation
バージョン 5.9 2022.01.17
Minor adjustments to volume info calculations
バージョン 5.8 2022.01.17
Modifications to volume info calculations
バージョン 5.7 2022.01.04
Modification to market info calculations
バージョン 5.6 2021.12.23
Adjustments to analysis period
Modifications to market info
バージョン 5.5 2021.12.17
Modified time delay between alerts
Improvements to market info calculations
バージョン 5.4 2021.12.14
Modifications to market info calculations
バージョン 5.3 2021.12.13
Improvements to structure code
Modified trade entry criteria
バージョン 5.2 2021.12.11
Improvements to structure calculations
Modified entry criteria
Bug fixes
バージョン 5.1 2021.12.06
Improvements to structure calculations
Modifications to volume calculations
バージョン 5.0 2021.12.01
Improvements to market info calculations
Modifications to structure code
Added levels to volume info
バージョン 4.9 2021.11.26
Removed adjustable analysis period
バージョン 4.8 2021.11.26
Complete change to volume pressure calculations
Improvements to market info calculations
バージョン 4.7 2021.11.02
Modified entry criteria
Changed default color theme
Volume bar width set to 3
バージョン 4.6 2021.10.26
Fixed minor bug
バージョン 4.5 2021.10.22
Improvements to market info calculations
Stretched the volume info mapping to twice the analysis range
バージョン 4.4 2021.10.18
Modified market info, volume info & entry alert criteria
バージョン 4.3 2021.10.15
Modifications to market info calculations
Maximum analysis period allowed set to 200
バージョン 4.2 2021.10.14
Slight modification to structure calculations
バージョン 4.1 2021.10.13
Modified volume info calculations
Modified structure calculations
Maximum analysis period allowed in 300
バージョン 4.0 2021.09.29
Low severity bug fixed
Default analysis period set is 100
Minimum analysis period allowed is 20
Maximum analysis period allowed is 500
バージョン 3.9 2021.09.17
Removed average tag on chart
Modified entry criteria to include average tag as an additional filter
バージョン 3.8 2021.09.16
Set default analysis period to 180
Set the volume bars width to 2
バージョン 3.7 2021.09.13
Added a tag to show the moving average on your chart
バージョン 3.6 2021.08.18
Changes to volume calculations
Default analysis period set to 100
バージョン 3.5 2021.08.06
Adjustable analysis period
Analysis period default set to 200
バージョン 3.4 2021.08.06
Analysis period set to 50
バージョン 3.3 2021.06.25
Restored static structure
Removed dynamic structure
Removed long & short trading zones
バージョン 3.2 2021.06.24
Replaced dynamic structure with dynamic long & short trading zones
Changed line style on both the chart & the left hand panel
バージョン 3.1 2021.06.15
Volume info modifications
バージョン 3.0 2021.06.07
Modified volume calculations
バージョン 2.9 2021.06.04
Changed structure labels
バージョン 2.8 2021.05.27
Changes to line style for better visuals
バージョン 2.7 2021.05.26
Changed market info response from static to dynamic
バージョン 2.6 2021.05.25
Modification to market info calculations
Modification to entry criteria
Modification to structure period & levels
バージョン 2.5 2021.05.21
Complete overhaul of the entire structure system from static to dynamic
Removed analysis & volume period parameter changes - all are now pre-coded
Improvements of volume calculations
Changes to chart labels
バージョン 2.4 2021.05.07
Rectified volume info calculations
バージョン 2.3 2021.05.06
Modified volume info calculations
バージョン 2.2 2021.05.06
Modified entry criteria
バージョン 2.1 2021.05.04
Improvements to structure calculations
バージョン 2.0 2021.04.27
Improvements to volume info calculations
Added labels to risk management levels [take profit, entry zone & stop loss]
バージョン 1.9 2021.04.20
Adjustable volume period
バージョン 1.8 2021.04.20
Corrections to structure analysis
Adjustable analysis period with default set to 50 bars
バージョン 1.7 2021.04.17
Modified structure calculations
バージョン 1.6 2021.04.16
Analysis period & trade signal is set to non-adjustable
バージョン 1.5 2021.04.15
Adjustments to volume info calculations
Analysis period default set to 100 bars
バージョン 1.4 2021.04.14
Analysis period default set to 200 bars
バージョン 1.3 2021.04.07
Added volume info bars
Structure is now set to always show on chart
バージョン 1.2 2021.03.27
Modified Alert Parameters
バージョン 1.1 2021.03.24
Adjusted Market Info Calculations