Correlation Index Pro
- Indicateurs
- Makarii Gubaydullin
- Version: 1.10
- Mise à jour: 3 octobre 2023
- Activations: 5
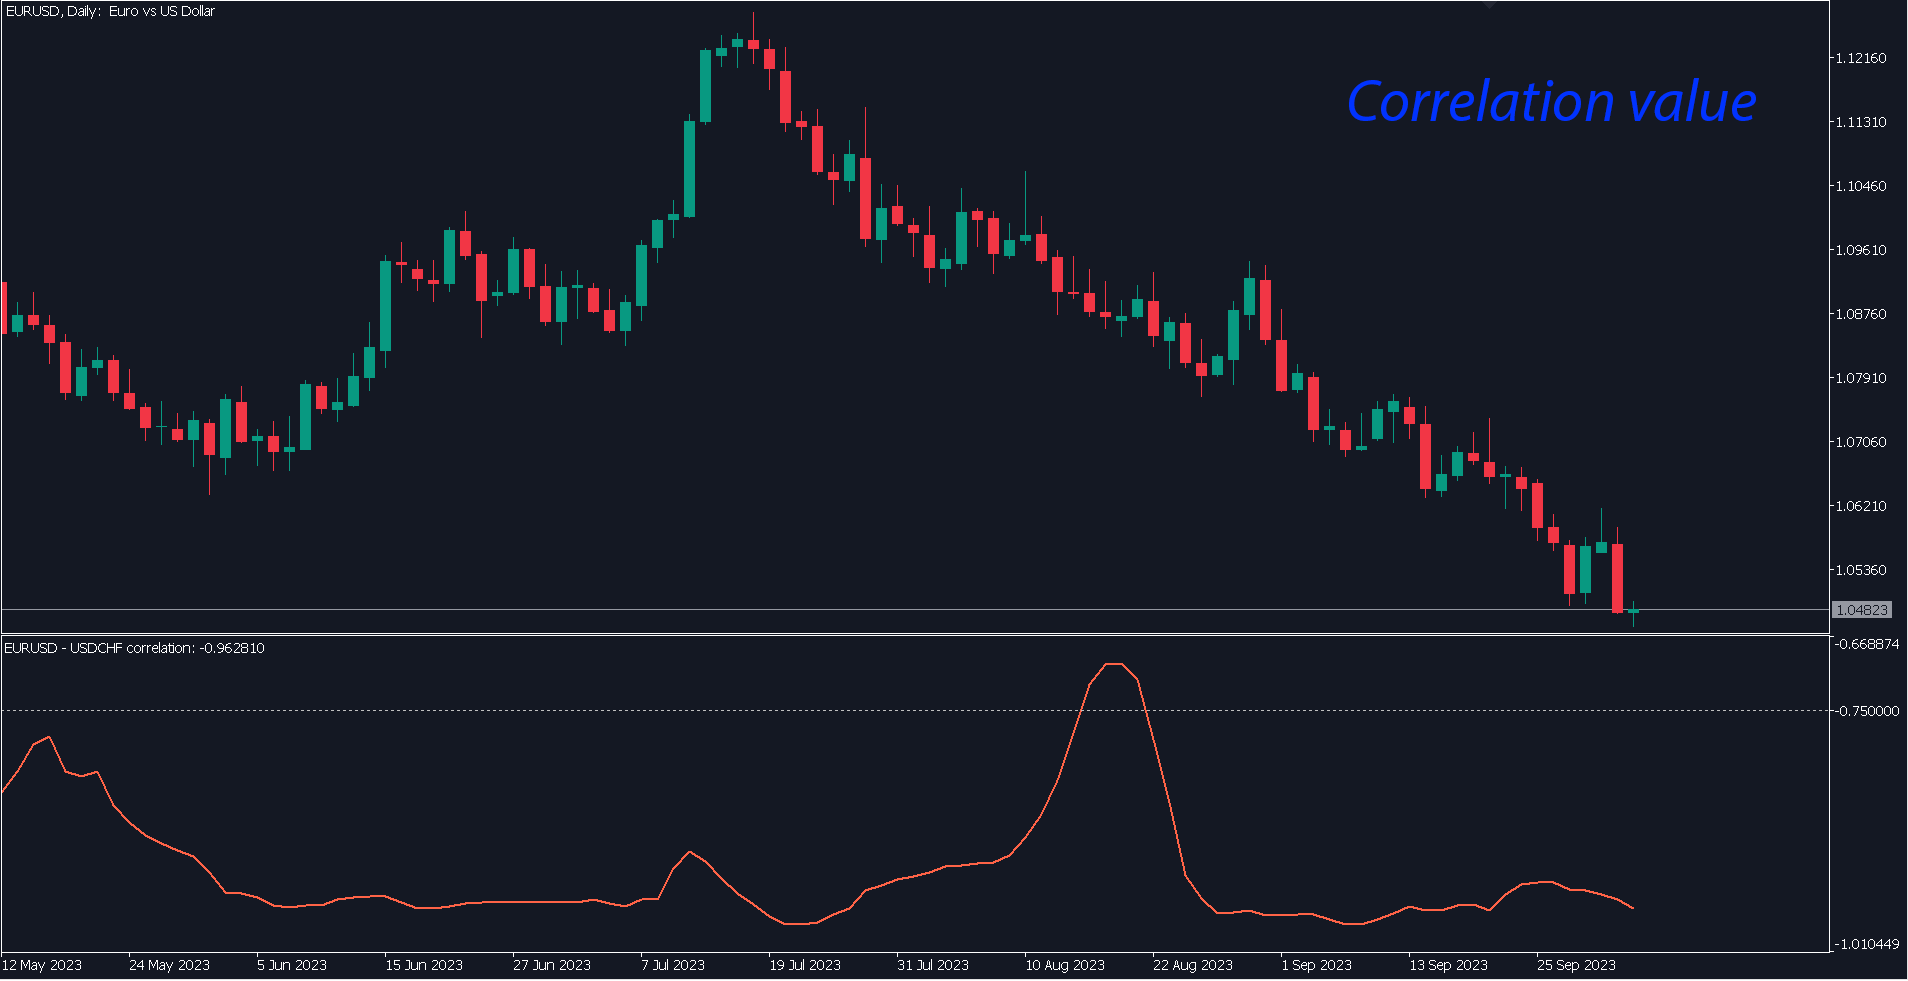
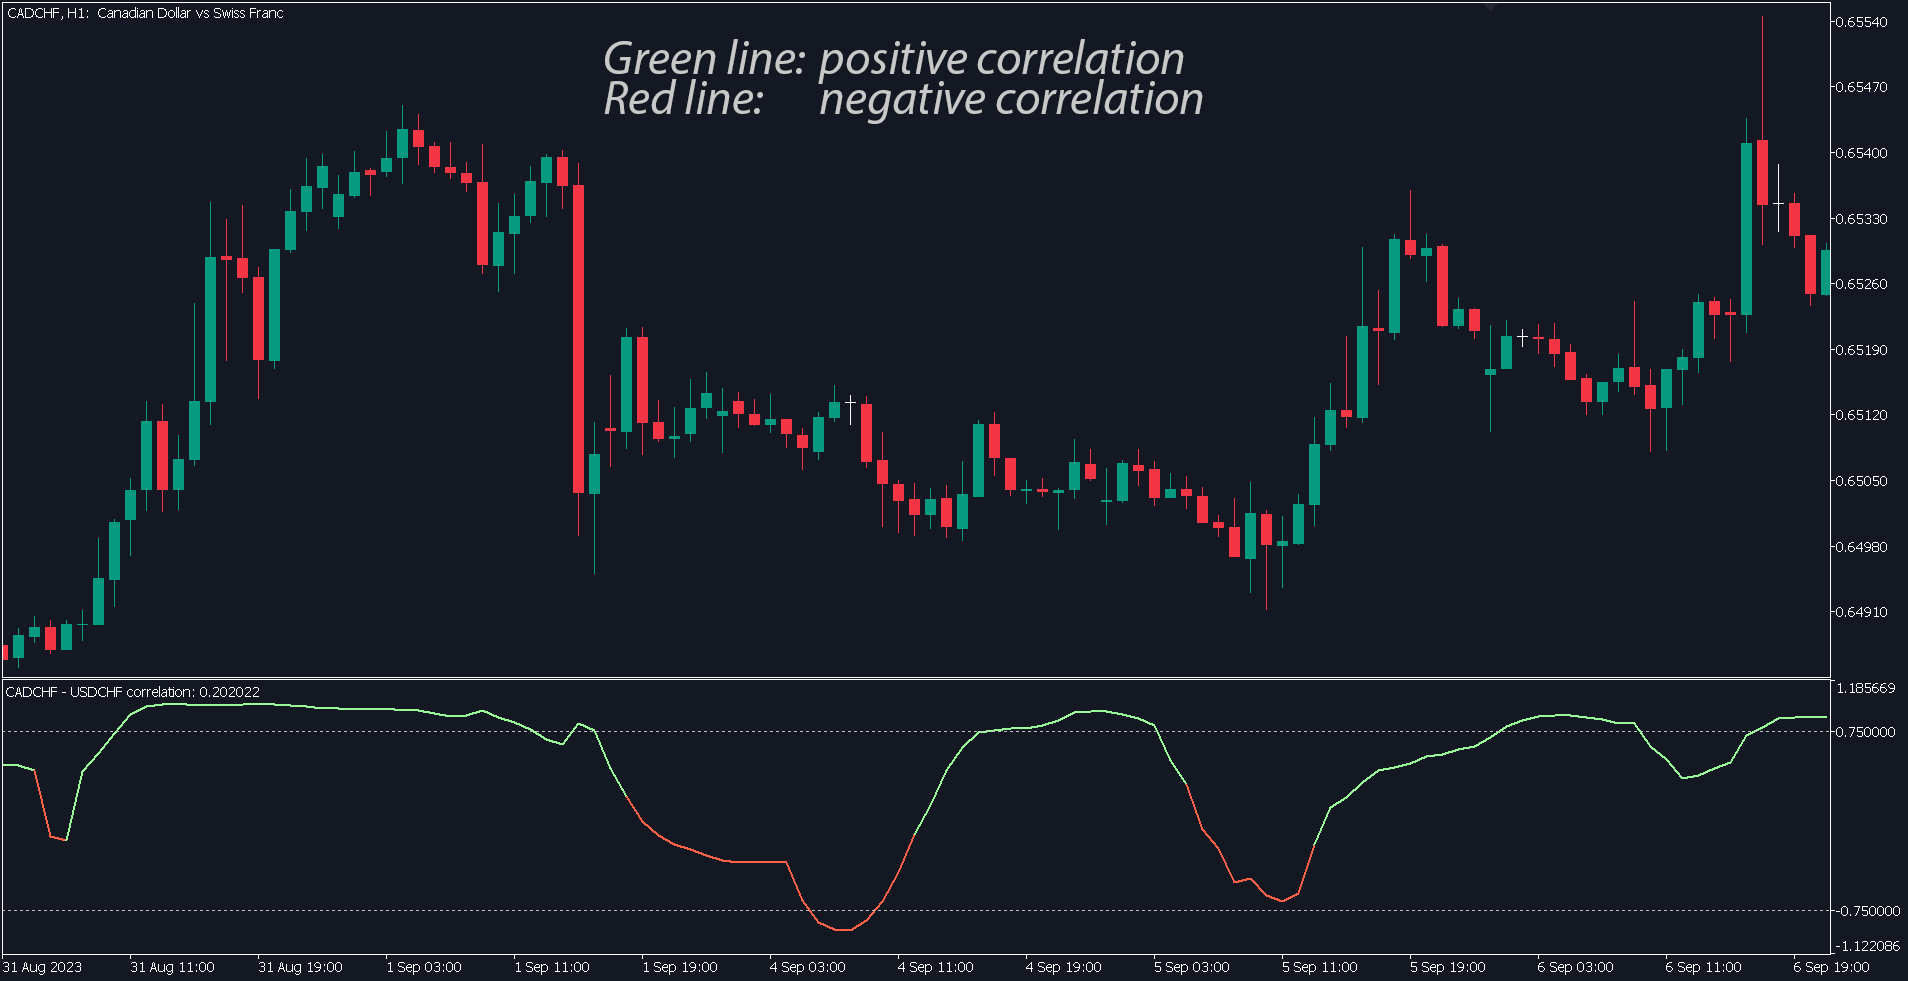
Correlation value between two Symbols.
- A value of +1 means a complete positive correlation;
- A value of -1 means a complete inverse correlation;
- A value of 0 means there is no explicit correlation (prices do not depend on each other, or the correlation is random);
My #1 Utility: includes 65+ functions | Contact me if you have any questions
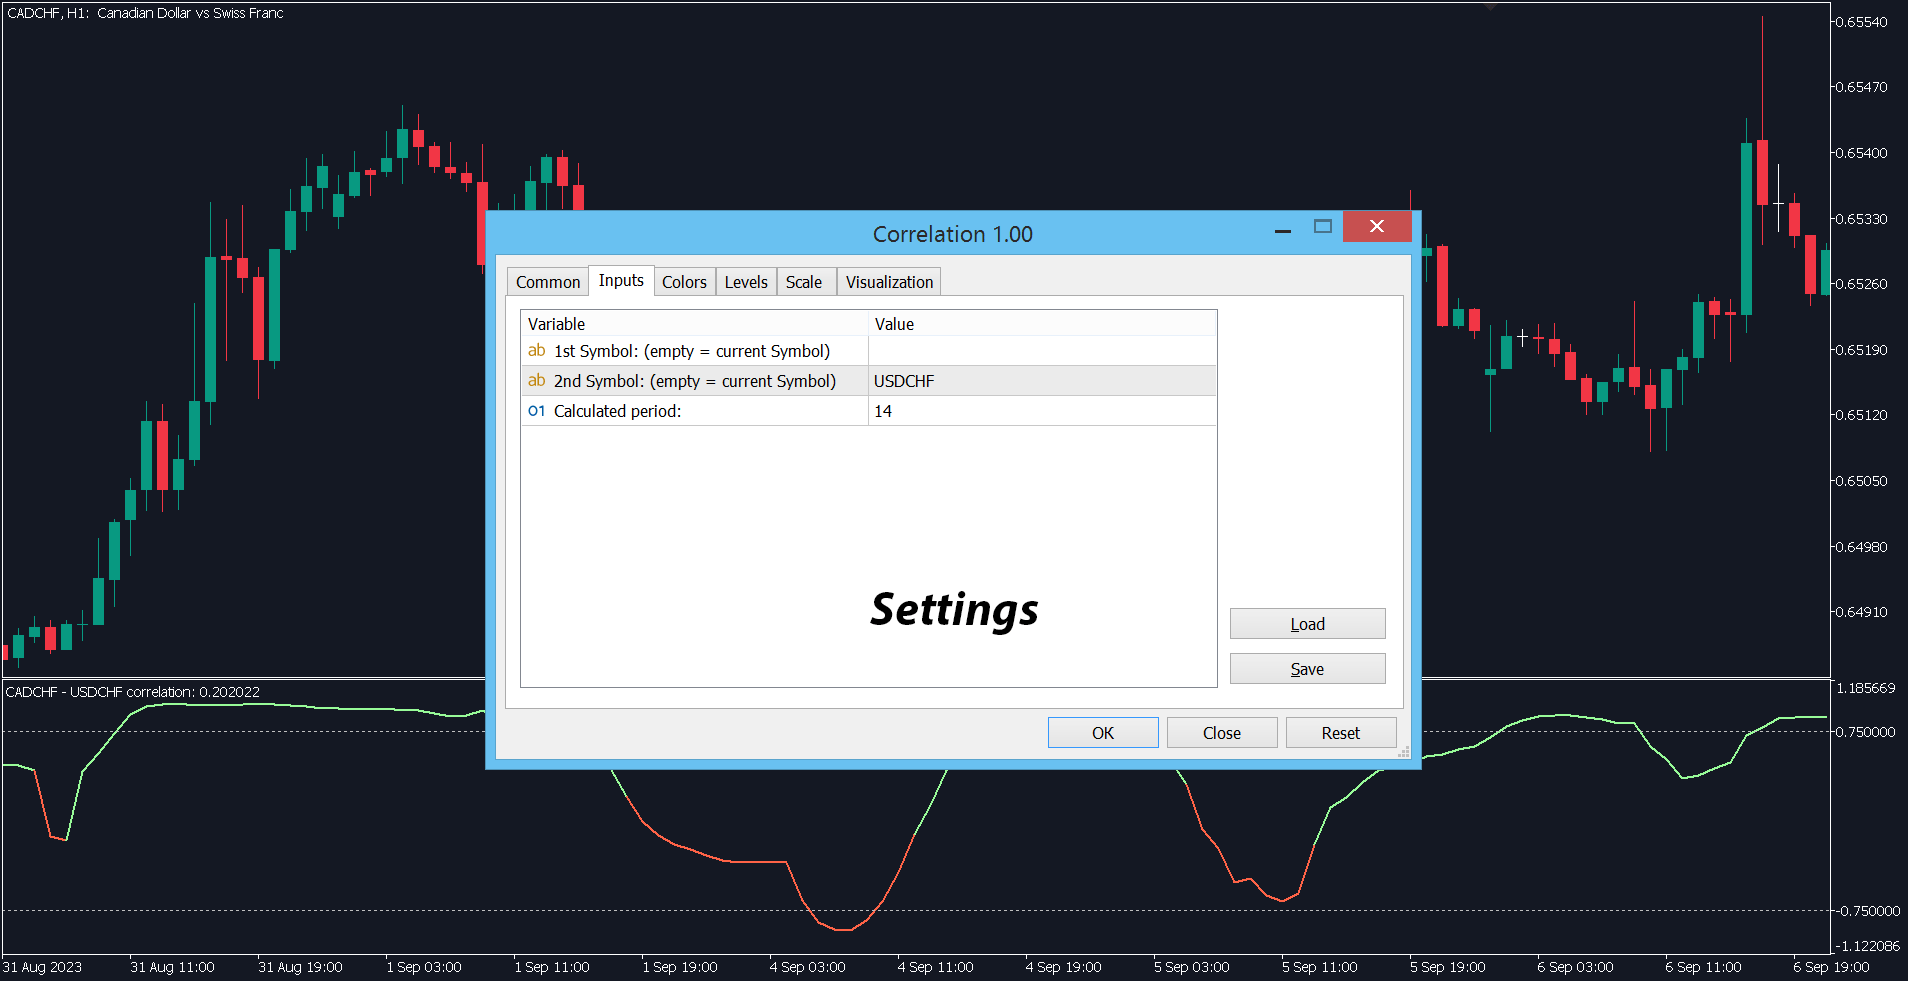
In the settings of the indicator, you can configure:
- Symbols (currency pairs) to be used in calculations.
Leave one value empty if you want one of the symbols to always match the chart symbol. - The period (the number of bars of the timeframe used) that will be used for the calculation.
-
All styles, sizes and colors are customizable.
The red line visualizes negative values, and the green line represents positive values.
The program file must be placed in the "Indicators" directory.