Discussion of article "Growing Neural Gas: Implementation in MQL5"
Looks cool :)
But what it is, and how to use it, I have yet to figure out :)
Looks cool :)
But what it is, and how to use it, we need to figure out more :)
can be used as the first hidden layer - for dimensionality reduction or clustering itself, can be used in probabilistic networks, and a lot of other options.
Thanks for the material!
I will try to learn it at my leisure :)
Thanks for the new article on an interesting networking method. If you go through the literature, there are dozens, if not hundreds of them. But the problem for traders is not in the lack of tools, but in using them correctly. The article would be even more interesting if it contained an example of using this method in an Expert Advisor.

Thanks for the new article on an interesting networking method. If you go through the literature, there are dozens, if not hundreds of them. But the problem for traders is not in the lack of tools, but in using them correctly. The article would be even more interesting if it contained an example of using this method in an Expert Advisor.
1. The article is good. It is presented in an accessible way, the code is not complicated.
2. The drawbacks of the article include the fact that nothing at all is said about the input data for the network. You could have written a few words about what is input - vector of quotes for the period/indicator data, vector of price deviations, normalised quotes or something else. For practical use of the algorithm, the issue of input data and its preparation is key. I recommend using a vector of relative price changes for such algorithms: x[i]=price[i+1]-price[i].
In addition, beforehand, the input vector can be normalised (x_normal[i]=x[i]/M), for which, the maximum deviation of the price for the period under consideration can be used as M (here and below, for brevity, I do not write variable declarations):
M=x[ArrayMaximum(x)]-x[ArrayMinimum(x)];
In this case, all input vectors will lie in a unit hypercube with side [-0.5,0.5], which will significantly increase the quality of the clustering. You can also use the standard normal deviation or any other averaging variables on the relative deviations of quotes over the period as M.
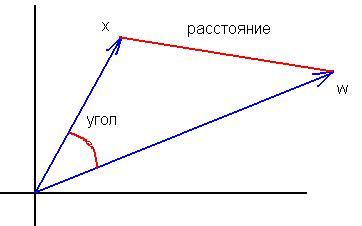
3. The paper suggests using the square of the norm of the difference as the distance between the vector of neuron weights and the input vector:
for(i=0, sum=0; i<m; i++, sum+=Pow(x[i]-w[i],2));
In my opinion, this distance function is not effective, in this clustering task. More effective is the function calculating the scalar product or normalised scalar product, i.e. the cosine of the angle between the vector of weights and the input vector:
for(i=0, norma_x=0, norma_w=0; i<m; i++, norma_x+=x[i]*x[i], norma_w+=w[i]*w[i]);
norma_x=sqrt(norma_x); norma_w=sqrt(norma_w);
for(i=0, sum=0; i<m; i++, sum+=x[i]*w[i]);
if(norma_x*norma_w!=0) sum=sum/(norma_x*norma_w);
Then in each cluster will be grouped vectors similar to each other by the directions of oscillations, but not by the magnitude of these oscillations, which will significantly reduce the dimensionality of the problem to be solved and increase the characteristics of the distributions of weights of the trained neural network.
4.It has been correctly observed that it is necessary to define a stopping criterion for training the network. The stopping criterion should determine the required number of clusters of the trained network. And it (number), in its turn, depends on the general problem to be solved. If the task is to forecast a time series for 1-2 samples ahead, and for this purpose, for example, a multilayer perseptron will be used, then the number of clusters should not differ much from the number of neurons of the input layer of the perseptron.

In general, the number of bars in history does not exceed 5,300,000 on the most detailed minute chart (10 years*365 days*24 hours*60 minutes). On the hourly chart it is 87,000 bars. That is, creation of a classifier with the number of clusters more than 10000-20000 is not justified because of the "overtraining" effect, when each vector of quotes has its own separate cluster.
I apologise for possible errors.
1. Thank you, I did my best for you:)
2. Yes, I agree. But still the inputs - this is a separate big problem, on which alone you can write dozens of articles.
3. And here I disagree completely. In the case of normalised inputs, comparison of scalar products is equivalent to comparison of Euclidean norms - expand the formulas.
4. Since the maximum number of clusters is already one of the parameters of the algorithm.
max_nodes
I would proceed, for example, as follows: measure the winner's error at the last N steps and evaluate its dynamics in some way (e.g., measure the slope of the regression line) If the error changes little, stop. If the error is still decreasing, and the training data have already run out, then it is worth considering their smoothing to suppress noise, or somehow eliminate the deficit of examples.
Hi Alex,
Thanks for clear explanation on the subject.
Would it be possible to share some practical code for Reconstruction future price, for instance from optimal signals.
The idea is:
1. Input (Source): multiple currencies (18)
2. Destination: Optimal signal of the currency we would like to predict (pic: 2. Optimal_Signals)
3. Find a neuro-connections between Source and Destination and explode it in trading.

Another question about NN reconstruction:
Is it possible instead of Random Samples use our samples instead , like on pic 2:
Our brain can reconstruct the picture in less then a second, let's see how much time it takes for NN do the same, just a joke, it is not challenge.

Random generated Samples are not very interesting to see as there is no meaning behind or use, however if we can draw dots ourselves with some meaning behind it , it would be much better fun. :-0)

- Free trading apps
- Over 8,000 signals for copying
- Economic news for exploring financial markets
You agree to website policy and terms of use
New article Growing Neural Gas: Implementation in MQL5 is published:
The article shows an example of how to develop an MQL5-program implementing the adaptive algorithm of clustering called Growing neural gas (GNG). The article is intended for the users who have studied the language documentation and have certain programming skills and basic knowledge in the area of neuroinformatics.
Author: Алексей