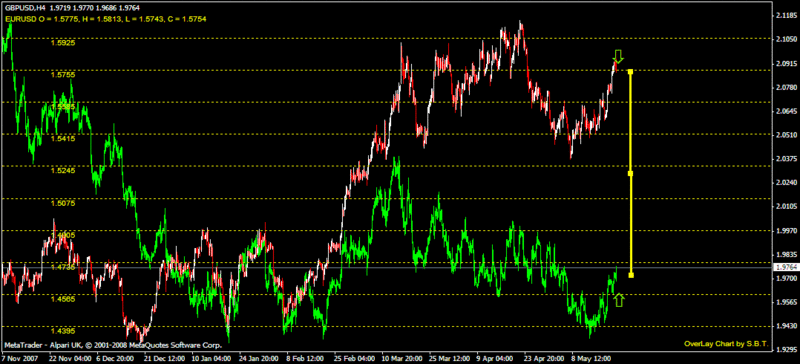
I find 100 bars in history for spotting the needed divergence hurts. What works better for me is zooming out on the 4 hour. Overlay the charts.
In the pic im posting its a signal for euro short cable long. Before entering I figure out "guess" how far i will let it go against be before I average down the trade. this is normally on on a cumulative loss between the 2 open orders. I tried to run it with shorter history but found to much noise in the charts to trade effectively. Conditions reverse while im averaged down holding multiple losing positions. The law of very large numbers on you side should help things out tremendously. The larger data pool should keep you out of small moves looking to take the big steak. Using the larger timeframe and data pool im getting about 80% winning trades. when with shorter time frames using smaller time frames and smaller data pool i find its way to stressful to trade. As the losers mount up quickly.
I hope this helps.

This is very interesting. Can somebody please explain how one does an overlay of two charts on MQL4 (Meta Trader)?
Thanks
Someone wrote an indicator to plot overlays.
Look in the bottom righthand side of the chart.
Thanks, got it.
Its called OverLayChart.
ya i hijacked the indicator from lightpatch. it should be in there under mt4 indicators.
ya i hijacked the indicator from lightpatch. it should be in there under mt4 indicators.
woops i thought wrong... here it is
I've programmed it as an EA and made an indicator too, but tester will not allow me to do backtests, so now I'm running it on demo. It hasn't lost the past 2 days..
Guess my question is, have any of you guys tried this strategy manually? What is the probability that the trades will profit? I just wanna manage my expectations. 
Forexflash, maybe you can shed some light on the below queries as I am still improving the program:
- why are we using daily averages (not H1 or H4)?
- and does it have to be 100 time periods?
Thanks!!!
What's the different with trading EURGBP? 
Sounds nice. Will write an EA for it.
- Free trading apps
- Over 8,000 signals for copying
- Economic news for exploring financial markets
You agree to website policy and terms of use
This is statistical arbitrage.
Arbitrage is simple. See the difference, buy this, sell the other. If you can't take decision based on current data in the front of your eyes and need sophisticated indicator, it's no longer arbitrage, it's the speculation based on indicators!!!
I put the pairs one over another (GBPUSD and EURUSD, at least they have the same pipsize) and I saw where it is crossing. Chose a couple of pairs (like this), a timeframe, and look up last (100) bars , by putting the GBPUSD chart over EURUSD. Calculate the average difference between these two, then trade them. Lot sizes are correlated. For example on the given period EURUSD moves 850 pips, while GBPUSD moves 630, and now EURUSD is above GBPUSD on chart, with a difference between them greater than average. The EA would enter SHORT EURUSD 0.06 , LONG GBPUSD 0.09 (850 pips rounds to 900). As long as these trades are open, the system reminds how the chart looked at the beginning and recalculates their position based on current values and the chart at that time. When the equivalent GBPUSD value on EURUSD chart touches EURUSD, trades are closed in profit.
The EA is not existing , I just told you what's in my mind.
Will somebody programmed the EA?