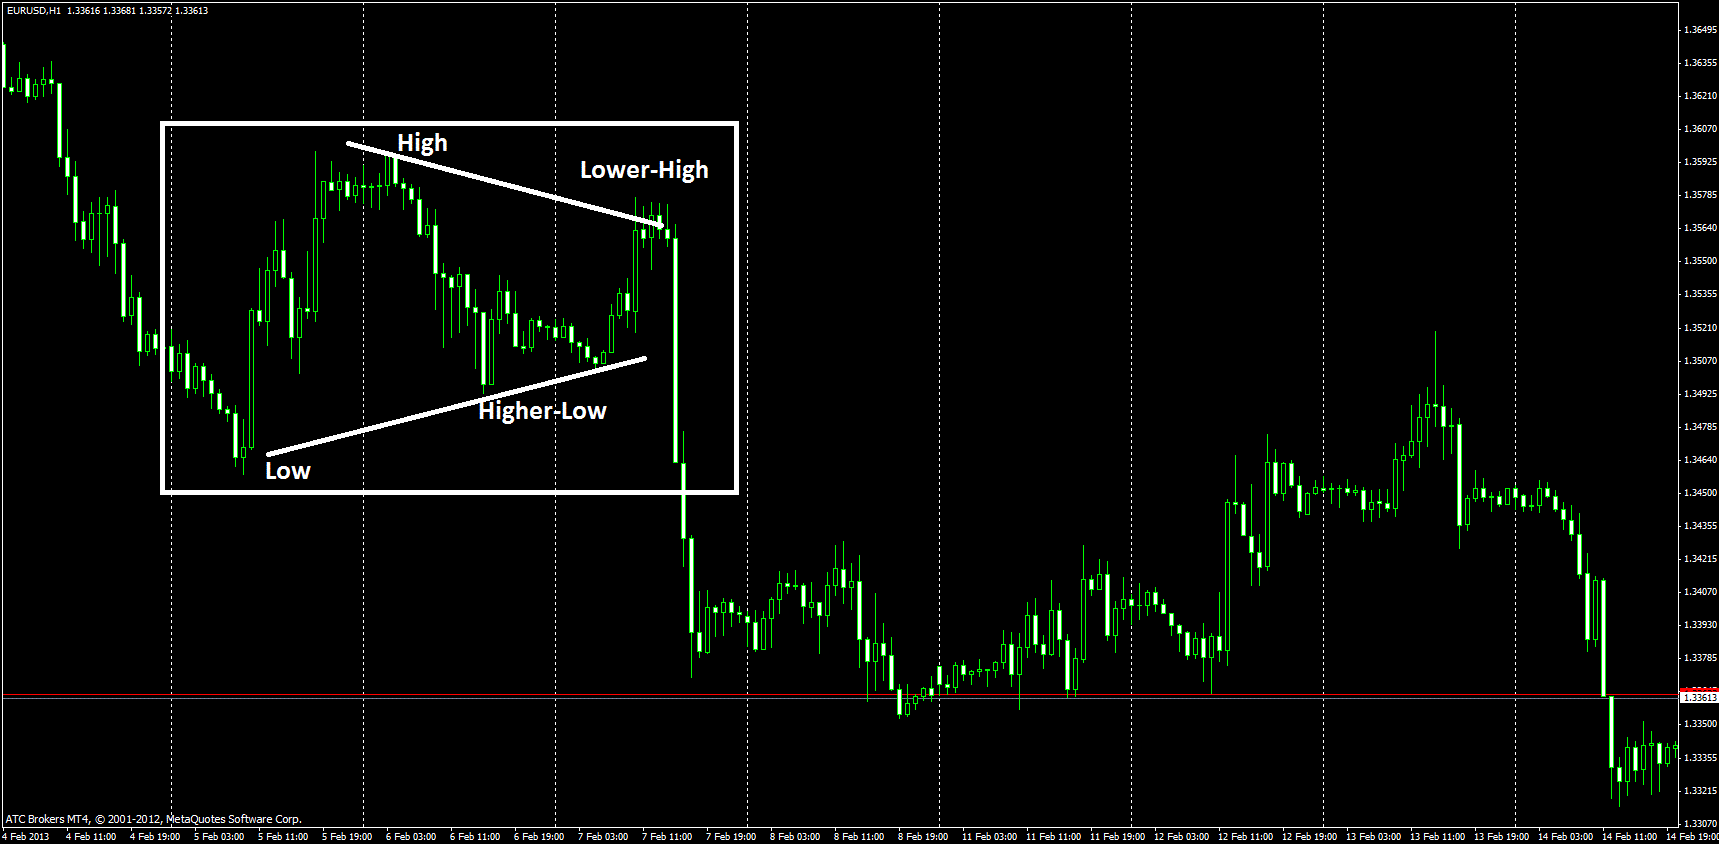
In my experience the main problem with the "horizontal sideways" market trend detection is that it can only be detected after the fact. Better to assume that it is always sideways (since it is - even when it is trending up or down - draw a channel and you will see what I mean) and solve cases like that (the "horizontal sideways" cases) with MM, since you are not going to be able to normally detect it.
Even in cases like these :
the assumption is that there is no horizontal sideways but a continuation of a trend determined before the horizontal phase
Better to assume that it is always sideways (since it is - even when it is trending up or down - draw a channel and you will see what I mean) and solve cases like that (the "horizontal sideways" cases) with MM, since you are not going to be able to normally detect it.
This is a great way of looking at the market. I guess I was sort of thinking in this manner anyway, hunting the trend, but not necessarily thinking of the market as always being sideways. I'll definitely give this a shot, it's simple but yet looks effective.
What is that indicator that you are using? It looks similar to a FractalAMA but the curves are smoother, any chance you could share the indicator + your settings? Thanks in advance.
That is something I am still working on, but you can use some similar ones for that purpose too (Ocean NMA, Kaufman AMA with a filter, Fractal AMA, there are more attempts to do similar tasks)
...What is that indicator that you are using? It looks similar to a FractalAMA but the curves are smoother, any chance you could share the indicator + your settings? Thanks in advance.
That is something I am still working on, but you can use some similar ones for that purpose too (Ocean NMA, Kaufman AMA with a filter, Fractal AMA, there are more attempts to do similar tasks)
Thanks I'll check them out. If you are ever inclined to share the source I'll sign an NDA, I have 17 years of programming experience so any improvements I would share back with you.
Predictable "volume" in forex
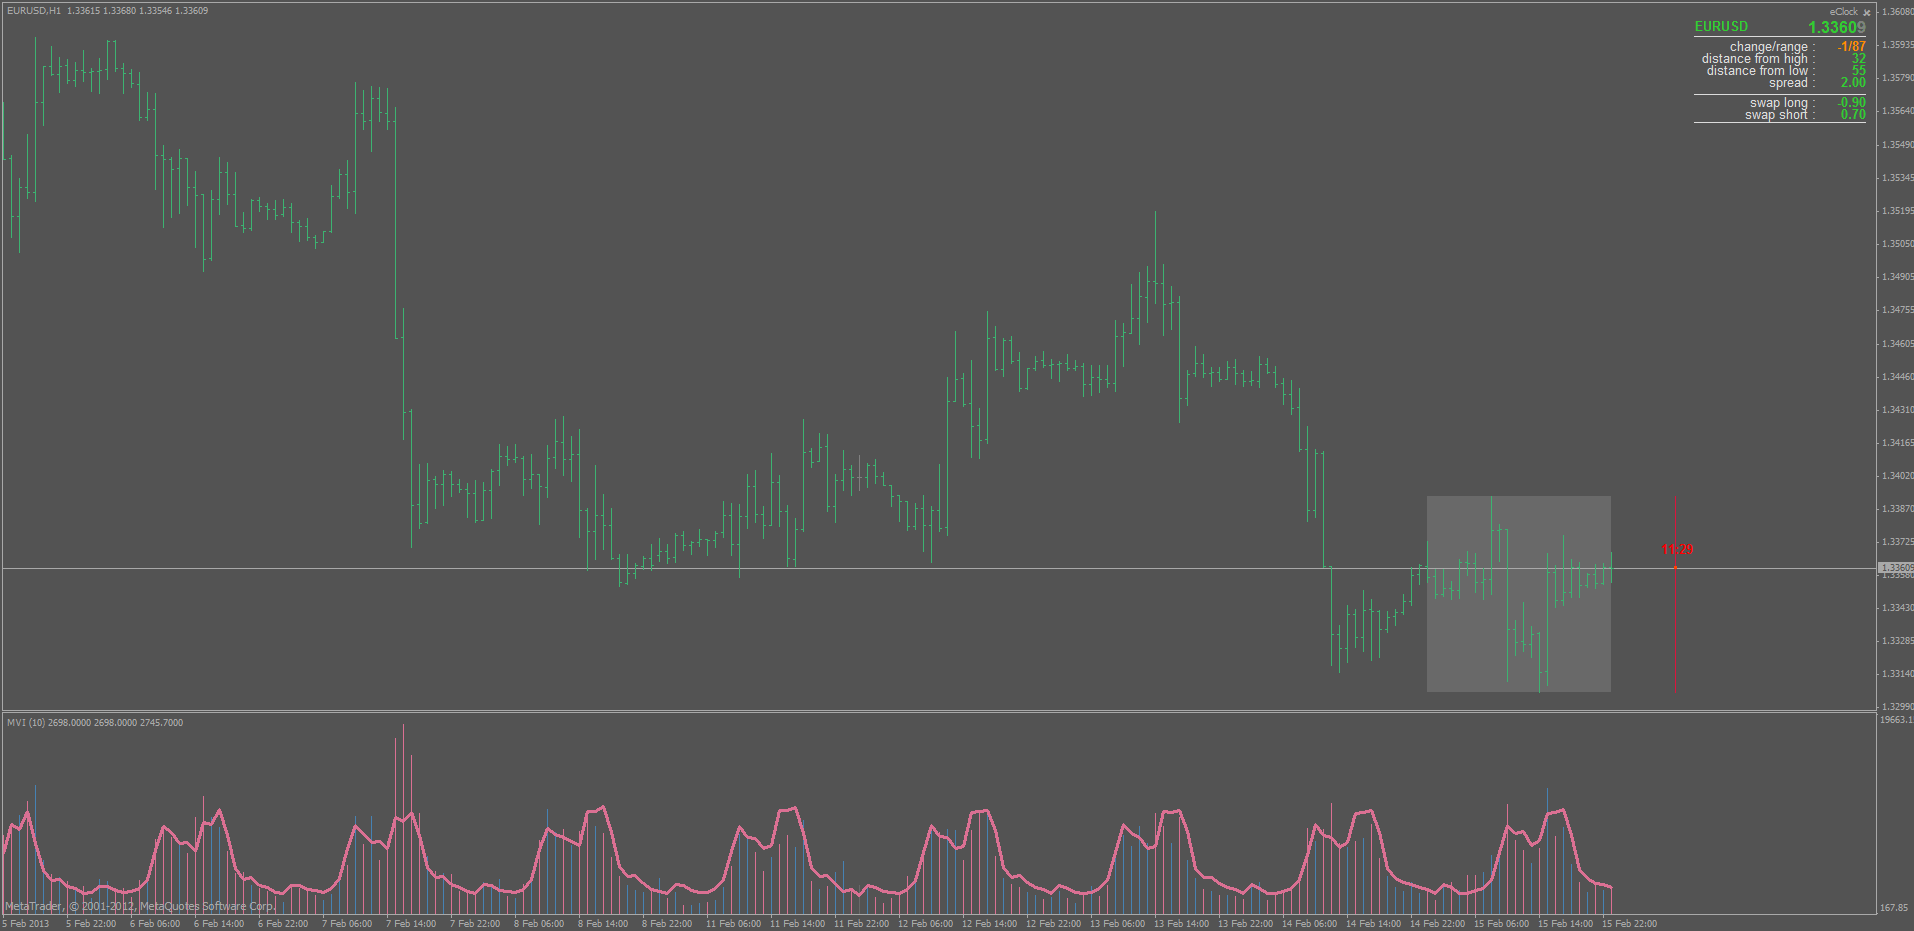
You even don't need to guesstimate when will it pick up when it comes to intra-day time. Starts with a start of European Session and the ends at the end of NY session. And it is even highly predictable (see the example bellow - the continuous line is actually a prediction)
The problem starts when we really want to use forex "volumes" for trend determination and then we find ourselves in a situation that tick volumes (since metatrader has only those) can not be used for that (trend estimation)
here it is...rough guesstimation, when volatility will pick up considerably
Trading Session hours as a market condition filter is what institutional traders use as it's reliable though never 100% as theres no holy grail certainly. Others have tried using volatility with different success rates as volatility while persistent isnt as persistent as we thought as some papers have stated recently. Additionally, volatility in part is a mixed signal as low volatility can refer to both trends and quiet stable non-moving periods while high volatility can mean either price breakout or unstable non-directional price conditions.
The common old ADX is still used successfully by some as i heard, but you can try out a variant/improved ADX method known as the 3X ADX method by BC Low which is already coded in this forum 4 months ago
Yours sincerely,
Wintersky
The most simple answer would be a market that moves in a tight range and is stuck in a rectangular pattern.
- Free trading apps
- Over 8,000 signals for copying
- Economic news for exploring financial markets
You agree to website policy and terms of use


Hello,
Does anyone know a good way to detect a sideways market? Specifically in the screenshot below I want to weed out the trades that occur in the red box and keep the ones in the blue boxes.