
Indicator for Point and Figure Charting
Introduction
There are lots of chart types that provide information on the current market situation. Many of them, such as Point and Figure chart, are the legacy of the remote past.
This chart type has been known since the end of the XIX century. It was first mentioned by Charles Dow in his Wall Street Journal editorial written on July 20, 1901 who labeled it the "book" method. And although Dow referenced the "book" method as far back as 1886, he was the first to officially set down its use to this day.
Despite the fact that Dow only described this method in editorials, you can now find a lot of books that give the details of this method. One of the books I would recommend to novice traders is a book by Thomas J. Dorsey entitled "Point and Figure Charting: The Essential Application for Forecasting and Tracking Market Prices".
Description
Point and Figure chart is a set of vertical columns: columns of X's are rising prices and columns of O's are falling prices. It is unique in that it is plotted based on price action, not time. Thus, having removed one value from the charting data (time), we get charts with trend lines plotted at an angle of 45 degrees.
Point and Figure charts are plotted using two predefined values:
- Box Size is the amount of price movement required to add an X or an O (originally, the value was expressed as the amount of dollars per share but over time it developed into points which is what we will use in our indicator).
- Reversal Amount is the amount of price reversal expressed in Box Size units required to change columns from X's to O's or vice versa (e.g. a reversal amount of 3 and a box size of 10 points will correspond to 30 points).
So we select a starting point and put an X for a price increase or an O for a fall, provided that the price has changed by the value equal to the Box Size multiplied by the Reversal Amount. Further, if the price continues to move in the same direction changing by the Box Size, we add an X at the top of the X's column for a rise or an O at the bottom of the O's column for a decrease, respectively. If the price has moved in the opposite direction by the value of the Box Size multiplied by the Reversal Amount, we put an X for a rise in the price or an O for a fall in the price, thus starting a new column of X's or a new column of O's, respectively.
For convenience, Point and Figure chart is usually plotted on checkered paper. For a better understanding, let's review a small example of Point and Figure charting. Suppose we have the following data:
| Date | High price | Low price |
|---|---|---|
| 07.03.2013 12:00 - 07.03.2013 20:00 | 1.3117 | 1.2989 |
| 07.03.2013 20:00 - 08.03.2013 04:00 | 1.3118 | 1.3093 |
| 08.03.2013 04:00 - 08.03.2013 12:00 | 1.3101 | 1.3080 |
| 08.03.2013 12:00 - 08.03.2013 20:00 | 1.3134 | 1.2955 |
We will plot the Point and Figure chart, given that the Box Size is equal to 10 and the Reversal Amount is equal to 3:
- At first, we see an increase in the price by 128 points, from 1.2989 to 1.3117, so we draw 12 X's.
- The price then falls from 1.3118 to 1.3093 by 25 points which is not enough for reversal so we leave it at that.
- Further, we can see that the price continues to fall to 1.3080. Given the previous value of 1.3118, it has now changed by 38 points, so we can start a new column by adding two O's (although the price movement exceeded the value of three Box Sizes, we only put two O's as the following column of O's always starts one Box Size lower).
- The price then rises from 1.3080 to 1.3134 by 54 points, subsequently dropping to 1.2955, which is 179 points. Thus the next column consists of four X's, followed by a column of O's made up of 16 O's.
Let's see it depicted below:

Fig. 1. Japanese Candlestick chart (left) and Point and Figure chart (right).
The above example of Point and Figure charting is very rough and is provided here to help beginners better understand the concept.
Charting Principle
There are several Point and Figure charting techniques, with one of them being already described above. These charting techniques differ in data they use. For example, we can use daily data without considering intraday movements, thus getting a rough plot. Or we can consider intraday price movement data so as to get a more detailed and smooth plot.
To achieve a smoother and more accurate Point and Figure charting, it was decided to use the minute data for calculations and charting as the price movement over a minute is not very significant and is usually up to six points, with two or three points not being rare. Thus, we will use opening price data on every minute bar.
The charting principle per se is fairly simple:
- We take a starting point, i.e. the opening price of the first minute bar.
- Further, if the price moves the distance equal to the Box Size multiplied by the Reversal Amount, or more, we draw the respective symbols (O's for a downward movement and X's for an upward movement). The data on the last symbol price is stored for further charting.
- In case the price moves by the Box Size in the same direction, a corresponding symbol is drawn.
- Further, in case of price reversal, the calculation will be based on the price of the last symbol, rather than the highest price of the pair. In other words, if the price movement is not more than 50% of the Box Size, it is simply ignored.
Let's now determine the Point and Figure charting style. The MQL5 language supports seven indicator plotting styles: line, section (segment), histogram, arrow (symbol), filled area (filled channel), bars and Japanese candlesticks.
Arrows (symbols) would be perfect for ideal visual representation but this style requires a varying number of indicator buffers (which is simply not supported in MQL5) or an enormous number thereof as plotting of every single X or an O in a column requires a separate indicator buffer. This means that if you decide to use this style, you should define volatility and have sufficient memory resources.
So we have decided for Japanese candlesticks as the charting style, precisely, colored Japanese candlesticks. Different colors are supposed to be used to differentiate columns of X's from columns of O's. Thus the indicator only needs five buffers, allowing for efficient use of the available resources.
Columns are divided into Box Sizes using horizontal lines. The result we get is quite decent:
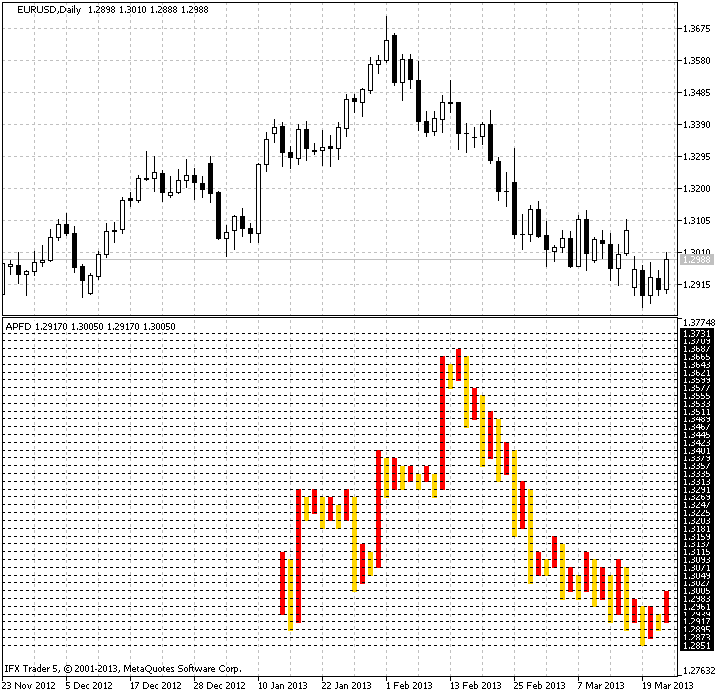
Fig. 2. Charting using the indicator for EURUSD on the Daily timeframe.
Algorithm of the Indicator
First, we need to determine the input parameters of the indicator. Since the Point and Figure chart doesn't take account of time and we use data for plotting from the minute bars, we need to determine the amount of data to be processed so as not to unnecessarily use the system resources. In addition, there is no point in plotting a Point and Figure chart using the entire history. So we introduce the first parameter - the History. It will take into consideration the number of the minute bars for calculation.
Further, we need to determine the Box Size and Reversal Amount. For this purpose, we will introduce the Cell and CellForChange variables, respectively. We will also bring in the color parameter for X's, ColorUp, and for O's, ColorDown. And finally, the last parameter will be the line color - LineColor.
// +++ Program start +++
//+------------------------------------------------------------------+
//|                                                         APFD.mq5 |
//|                                            Aktiniy ICQ:695710750 |
//|                                                    ICQ:695710750 |
//+------------------------------------------------------------------+
#property copyright "Aktiniy ICQ:695710750"
#property link      "ICQ:695710750"
#property version   "1.00"
//--- Indicator plotting in a separate window
#property indicator_separate_window
#property indicator_buffers 5
#property indicator_plots   1
//--- plot Label1
#property indicator_label1  "APFD"
#property indicator_type1   DRAW_COLOR_CANDLES
#property indicator_style1  STYLE_SOLID
#property indicator_color1  clrRed,clrGold
#property indicator_width1  1
//--- Set the input parameters
input int   History=10000;
input int   Cell=5;
input int   CellForChange=3;
input color ColorUp=clrRed;
input color ColorDown=clrGold;
input color LineColor=clrAqua;
//--- Declare indicator buffers
double CandlesBufferOpen[];
double CandlesBufferHigh[];
double CandlesBufferLow[];
double CandlesBufferClose[];
double CandlesBufferColor[];
//--- Array for copying calculation data from the minute bars
double OpenPrice[];
// Variables for calculations
double PriceNow=0;
double PriceBefore=0;
//--- Introduce auxiliary variables
char   Trend=0;      // Direction of the price trend
double BeginPrice=0; // Starting price for the calculation
char   FirstTrend=0; // Direction of the initial market trend
int    Columns=0;    // Variable for the calculation of columns
double InterimOpenPrice=0;
double InterimClosePrice=0;
double NumberCell=0; // Variable for the calculation of cells
double Tick=0;       // Tick size
double OldPrice=0;   // Value of the last calculation price
//--- Create arrays to temporary store data on column opening and closing prices
double InterimOpen[];
double InterimClose[];
// +++ Program start +++
Let's now consider the OnInit() function. It will bind indicator buffers to one-dimensional arrays. We will also set the value of the indicator without rendering for a more accurate display and
calculate the value of the auxiliary variable Tick (size of one tick) for calculations. In addition, we will set the color scheme and indexing order in indicator buffers as time series. This is required to conveniently calculate values of the indicator.
// +++ The OnInit function +++
//+------------------------------------------------------------------+
//| Custom indicator initialization function                         |
//+------------------------------------------------------------------+
int OnInit()
  {
//--- indicator buffers mapping
   SetIndexBuffer(0,CandlesBufferOpen,INDICATOR_DATA);
   SetIndexBuffer(1,CandlesBufferHigh,INDICATOR_DATA);
   SetIndexBuffer(2,CandlesBufferLow,INDICATOR_DATA);
   SetIndexBuffer(3,CandlesBufferClose,INDICATOR_DATA);
   SetIndexBuffer(4,CandlesBufferColor,INDICATOR_COLOR_INDEX);
//--- Set the value of the indicator without rendering
   PlotIndexSetDouble(0,PLOT_EMPTY_VALUE,0);
//--- Calculate the size of one tick
   Tick=SymbolInfoDouble(Symbol(),SYMBOL_TRADE_TICK_SIZE);
//--- Set the color scheme
   PlotIndexSetInteger(0,PLOT_LINE_COLOR,0,ColorUp);
   PlotIndexSetInteger(0,PLOT_LINE_COLOR,1,ColorDown);
//--- Set the indexing order in arrays as time series
   ArraySetAsSeries(CandlesBufferClose,true);
   ArraySetAsSeries(CandlesBufferColor,true);
   ArraySetAsSeries(CandlesBufferHigh,true);
   ArraySetAsSeries(CandlesBufferLow,true);
   ArraySetAsSeries(CandlesBufferOpen,true);
//--- Check the input parameter for correctness
   if(CellForChange<2)
      Alert("The CellForChange parameter must be more than 1 due to plotting peculiarities");
//---
   return(0);
  }
// +++ The OnInit function +++
We have reached the very "heart" of the indicator, the OnCalculate() function where the calculations will be made. Calculations of indicator values are broken down into six basic functions that will be called from OnCalculate(). Let's have a look at them:
1. Function for copying data
This function copies data from the minute bars to an array for calculations. First, we resize the receiving array and then copy opening prices into it using the CopyOpen() function.
//+------------------------------------------------------------------+
//| Function for copying data for the calculation                    |
//+------------------------------------------------------------------+
int FuncCopy(int HistoryInt)
  {
//--- Resize the array for copying calculation data
   ArrayResize(OpenPrice,(HistoryInt));
//--- Copy data from the minute bars to the array
   int Open=CopyOpen(Symbol(),PERIOD_M1,0,(HistoryInt),OpenPrice);
//---
   return(Open);
  }
2. Function for calculating the number of columns
This function calculates the number of columns for Point and Figure charting.
Calculations are done in a loop iterating over the number of bars on the minute time frame that were copied in the above function. The loop itself consists of three main blocks for different trend types:
- 0 - indefinite trend.
- 1 - uptrend.
- -1 - downtrend.
The indefinite trend will be used only once for determining the initial price movement. Direction of the price movement will be determined when the absolute value of the difference between the current market and the initial price exceeds the value of the Box Size multiplied by the Reversal Amount.
If there is a downward breakout, the initial trend will be identified as a downtrend and a corresponding entry will be made to the Trend variable. An uptrend is identified in the exactly opposite way. In addition, the value of the variable for the number of columns, ColumnsInt, will be increased.
Once the current trend is identified, we set two conditions for each direction. If the price continues to move in the direction of the current trend by the Box Size, the ColumnsInt variable value will remain unchanged. Should the price reverse by the Box Size multiplied by the Reversal Amount, a new column will appear and the ColumnsInt variable value will increase by one.
And so forth until all columns are identified.
To round the number of cells in the loop, we will use the MathRound() function that allows us to round the resulting values to the nearest integers. Optionally, this function can be replaced with the MathFloor() function (rounding down to the nearest integer) or the MathCeil() function (rounding up to the nearest integer), depending on the plot required.
//+------------------------------------------------------------------+
//| Function for calculating the number of columns                   |
//+------------------------------------------------------------------+
int FuncCalculate(int HistoryInt)
  {
   int ColumnsInt=0;

//--- Zero out auxiliary variables
   Trend=0;                 // Direction of the price trend
   BeginPrice=OpenPrice[0]; // Starting price for the calculation
   FirstTrend=0;            // Direction of the initial market trend
   Columns=0;               // Variable for the calculation of columns
   InterimOpenPrice=0;
   InterimClosePrice=0;
   NumberCell=0;            // Variable for the calculation of cells
//--- Loop for the calculation of the number of main buffers (column opening and closing prices)
   for(int x=0; x<HistoryInt; x++)
     {
      if(Trend==0 && (Cell*CellForChange)<fabs((BeginPrice-OpenPrice[x])/Tick))
        {
         //--- Downtrend
         if(((BeginPrice-OpenPrice[x])/Tick)>0)
           {
            NumberCell=fabs((BeginPrice-OpenPrice[x])/Tick)/Cell;
            NumberCell=MathRound(NumberCell);
            InterimOpenPrice=BeginPrice;
            InterimClosePrice=BeginPrice-(NumberCell*Cell*Tick);
            InterimClosePrice=NormalizeDouble(InterimClosePrice,Digits());
            Trend=-1;
           }
         //--- Uptrend
         if(((BeginPrice-OpenPrice[x])/Tick)<0)
           {
            NumberCell=fabs((BeginPrice-OpenPrice[x])/Tick)/Cell;
            NumberCell=MathRound(NumberCell);
            InterimOpenPrice=BeginPrice;
            InterimClosePrice=BeginPrice+(NumberCell*Cell*Tick);
            InterimClosePrice=NormalizeDouble(InterimClosePrice,Digits());
            Trend=1;
           }
         BeginPrice=InterimClosePrice;
         ColumnsInt++;
         FirstTrend=Trend;
        }
      //--- Determine further actions in case of the downtrend
      if(Trend==-1)
        {
         if(((BeginPrice-OpenPrice[x])/Tick)>0 && (Cell)<fabs((BeginPrice-OpenPrice[x])/Tick))
           {
            NumberCell=fabs((BeginPrice-OpenPrice[x])/Tick)/Cell;
            NumberCell=MathRound(NumberCell);
            InterimClosePrice=BeginPrice-(NumberCell*Cell*Tick);
            InterimClosePrice=NormalizeDouble(InterimClosePrice,Digits());
            Trend=-1;
            BeginPrice=InterimClosePrice;
           }
         if(((BeginPrice-OpenPrice[x])/Tick)<0 && (Cell*CellForChange)<fabs((BeginPrice-OpenPrice[x])/Tick))
           {
            ColumnsInt++;
            NumberCell=fabs((BeginPrice-OpenPrice[x])/Tick)/Cell;
            NumberCell=MathRound(NumberCell);
            InterimOpenPrice=BeginPrice+(Cell*Tick);
            InterimClosePrice=BeginPrice+(NumberCell*Cell*Tick);
            InterimClosePrice=NormalizeDouble(InterimClosePrice,Digits());
            Trend=1;
            BeginPrice=InterimClosePrice;
           }
        }
      //--- Determine further actions in case of the uptrend
      if(Trend==1)
        {
         if(((BeginPrice-OpenPrice[x])/Tick)>0 && (Cell*CellForChange)<fabs((BeginPrice-OpenPrice[x])/Tick))
           {
            ColumnsInt++;
            NumberCell=fabs((BeginPrice-OpenPrice[x])/Tick)/Cell;
            NumberCell=MathRound(NumberCell);
            InterimOpenPrice=BeginPrice-(Cell*Tick);
            InterimClosePrice=BeginPrice-(NumberCell*Cell*Tick);
            InterimClosePrice=NormalizeDouble(InterimClosePrice,Digits());
            Trend=-1;
            BeginPrice=InterimClosePrice;
           }
         if(((BeginPrice-OpenPrice[x])/Tick)<0 && (Cell)<fabs((BeginPrice-OpenPrice[x])/Tick))
           {
            NumberCell=fabs((BeginPrice-OpenPrice[x])/Tick)/Cell;
            NumberCell=MathRound(NumberCell);
            InterimClosePrice=BeginPrice+(NumberCell*Cell*Tick);
            InterimClosePrice=NormalizeDouble(InterimClosePrice,Digits());
            Trend=1;
            BeginPrice=InterimClosePrice;
           }
        }
     }
//---
   return(ColumnsInt);
  }
3. Function for coloring columns
This function is intended for coloring columns as required using the preset color scheme. For this purpose, we will write a loop iterating over the number of columns and set the appropriate colors to even and odd columns, taking into consideration the initial trend value (initial column).
//+------------------------------------------------------------------+
//| Function for coloring columns                                    |
//+------------------------------------------------------------------+
int FuncColor(int ColumnsInt)
  {
   int x;
//--- Fill the buffer of colors for drawing
   for(x=0; x<ColumnsInt; x++)
     {
      if(FirstTrend==-1)
        {
         if(x%2==0) CandlesBufferColor[x]=1; // All even buffers of color 1
         if(x%2>0) CandlesBufferColor[x]=0;  // All odd buffers of color 0
        }
      if(FirstTrend==1)
        {
         if(x%2==0) CandlesBufferColor[x]=0; // All odd buffers of color 0
         if(x%2>0) CandlesBufferColor[x]=1;  // All even buffers of color 1
        }
     }
//---
   return(x);
  }
4. Function for determining the column size
Once we have determined the number of columns to be used and set the necessary colors, we need to determine the height of columns. To do this, we will create temporary arrays, InterimOpen[] and InterimClose[], in which we will store opening and closing prices for each column. The size of these arrays will be equal to the number of columns.
Then, we will have a loop that is almost completely identical to the loop from the FuncCalculate() function, its difference being in that apart from all the above it also stores the opening and closing prices for each of the columns. This separation is implemented so as to know the number of columns in the chart in advance. Theoretically, we could initially set a knowingly greater number of columns for array memory allocation and only do with one loop only. But in that case we would have a greater use of memory resources.
Let's now take a more detailed look at determining the column height. After the price moved the distance equal to the required number of Box Sizes, we calculate their number, rounding it to the nearest integer. Then we add the total number of Box Sizes of the current column to the column opening price, thus getting the column closing price, which also becomes the last used price. It will be involved in all further actions.
//+------------------------------------------------------------------+
//| Function for determining the column size                         |
//+------------------------------------------------------------------+
int FuncDraw(int HistoryInt)
  {
//--- Determine the sizes of temporary arrays
   ArrayResize(InterimOpen,Columns);
   ArrayResize(InterimClose,Columns);
//--- Zero out auxiliary variables
   Trend=0;                 // Direction of the price trend
   BeginPrice=OpenPrice[0]; // Starting price for the calculation
   NumberCell=0;            // Variable for the calculation of cells
   int z=0;                 // Variable for indices of temporary arrays
//--- Loop for filling the main buffers (column opening and closing prices)
   for(int x=0; x<HistoryInt; x++)
     {
      if(Trend==0 && (Cell*CellForChange)<fabs((BeginPrice-OpenPrice[x])/Tick))
        {
         //--- Downtrend
         if(((BeginPrice-OpenPrice[x])/Tick)>0)
           {
            NumberCell=fabs((BeginPrice-OpenPrice[x])/Tick)/Cell;
            NumberCell=MathRound(NumberCell);
            InterimOpen[z]=BeginPrice;
            InterimClose[z]=BeginPrice-(NumberCell*Cell*Tick);
            InterimClose[z]=NormalizeDouble(InterimClose[z],Digits());
            Trend=-1;
           }
         //--- Uptrend
         if(((BeginPrice-OpenPrice[x])/Tick)<0)
           {
            NumberCell=fabs((BeginPrice-OpenPrice[x])/Tick)/Cell;
            NumberCell=MathRound(NumberCell);
            InterimOpen[z]=BeginPrice;
            InterimClose[z]=BeginPrice+(NumberCell*Cell*Tick);
            InterimClose[z]=NormalizeDouble(InterimClose[z],Digits()); // Normalize the number of decimal places
            Trend=1;
           }
         BeginPrice=InterimClose[z];
        }
      //--- Determine further actions in case of the downtrend
      if(Trend==-1)
        {
         if(((BeginPrice-OpenPrice[x])/Tick)>0 && (Cell)<fabs((BeginPrice-OpenPrice[x])/Tick))
           {
            NumberCell=fabs((BeginPrice-OpenPrice[x])/Tick)/Cell;
            NumberCell=MathRound(NumberCell);
            InterimClose[z]=BeginPrice-(NumberCell*Cell*Tick);
            InterimClose[z]=NormalizeDouble(InterimClose[z],Digits());
            Trend=-1;
            BeginPrice=InterimClose[z];
           }
         if(((BeginPrice-OpenPrice[x])/Tick)<0 && (Cell*CellForChange)<fabs((BeginPrice-OpenPrice[x])/Tick))
           {
            z++;
            NumberCell=fabs((BeginPrice-OpenPrice[x])/Tick)/Cell;
            NumberCell=MathRound(NumberCell);
            InterimOpen[z]=BeginPrice+(Cell*Tick);
            InterimClose[z]=BeginPrice+(NumberCell*Cell*Tick);
            InterimClose[z]=NormalizeDouble(InterimClose[z],Digits());
            Trend=1;
            BeginPrice=InterimClose[z];
           }
        }
      //--- Determine further actions in case of the uptrend
      if(Trend==1)
        {
         if(((BeginPrice-OpenPrice[x])/Tick)>0 && (Cell*CellForChange)<fabs((BeginPrice-OpenPrice[x])/Tick))
           {
            z++;
            NumberCell=fabs((BeginPrice-OpenPrice[x])/Tick)/Cell;
            NumberCell=MathRound(NumberCell);
            InterimOpen[z]=BeginPrice-(Cell*Tick);
            InterimClose[z]=BeginPrice-(NumberCell*Cell*Tick);
            InterimClose[z]=NormalizeDouble(InterimClose[z],Digits());
            Trend=-1;
            BeginPrice=InterimClose[z];
           }
         if(((BeginPrice-OpenPrice[x])/Tick)<0 && (Cell)<fabs((BeginPrice-OpenPrice[x])/Tick))
           {
            NumberCell=fabs((BeginPrice-OpenPrice[x])/Tick)/Cell;
            NumberCell=MathRound(NumberCell);
            InterimClose[z]=BeginPrice+(NumberCell*Cell*Tick);
            InterimClose[z]=NormalizeDouble(InterimClose[z],Digits());
            Trend=1;
            BeginPrice=InterimClose[z];
           }
        }
     }
//---
   return(z);
  }
5. Function for array reversal
The function reverses the obtained column array data so as to further display the chart programmatically from right to left. The array reversal is performed in a loop, with High and Low values being assigned to the candlesticks. This is done because the indicator is only displayed for the candlesticks for which all indicator buffer values are not equal to zero.
//+------------------------------------------------------------------+
//| Function for array reversal                                      |
//+------------------------------------------------------------------+
int FuncTurnArray(int ColumnsInt)
  {
//--- Variable for array reversal
   int d=ColumnsInt;
   for(int x=0; x<ColumnsInt; x++)
     {
      d--;
      CandlesBufferOpen[x]=InterimOpen[d];
      CandlesBufferClose[x]=InterimClose[d];
      if(CandlesBufferClose[x]>CandlesBufferOpen[x])
        {
         CandlesBufferHigh[x]=CandlesBufferClose[x];
         CandlesBufferLow[x]=CandlesBufferOpen[x];
        }
      if(CandlesBufferOpen[x]>CandlesBufferClose[x])
        {
         CandlesBufferHigh[x]=CandlesBufferOpen[x];
         CandlesBufferLow[x]=CandlesBufferClose[x];
        }
     }
//---
   return(d);
  }
6. Function for drawing horizontal lines
This function makes a grid of "boxes" using horizontal lines (objects). At the beginning of the function, we determine the maximum and minimum price values from the array of calculation data. These values are further used to gradually plot lines up and down from the starting point.
//+------------------------------------------------------------------+
//| Function for drawing horizontal lines                            |
//+------------------------------------------------------------------+
int FuncDrawHorizontal(bool Draw)
  {
   int Horizontal=0;
   if(Draw==true)
     {
      //--- Create horizontal lines (lines for separation of columns)
      ObjectsDeleteAll(0,ChartWindowFind(),OBJ_HLINE); // Delete all old horizontal lines
      int MaxPriceElement=ArrayMaximum(OpenPrice);     // Determine the maximum price level
      int MinPriceElement=ArrayMinimum(OpenPrice);     // Determine the minimum price level
      for(double x=OpenPrice[0]; x<=OpenPrice[MaxPriceElement]+(Cell*Tick); x=x+(Cell*Tick))
        {
         ObjectCreate(0,DoubleToString(x,Digits()),OBJ_HLINE,ChartWindowFind(),0,NormalizeDouble(x,Digits()));
         ObjectSetInteger(0,DoubleToString(x,Digits()),OBJPROP_COLOR,LineColor);
         ObjectSetInteger(0,DoubleToString(x,Digits()),OBJPROP_STYLE,STYLE_DOT);
         ObjectSetInteger(0,DoubleToString(x,Digits()),OBJPROP_SELECTED,false);
         ObjectSetInteger(0,DoubleToString(x,Digits()),OBJPROP_WIDTH,1);
         Horizontal++;
        }
      for(double x=OpenPrice[0]-(Cell*Tick); x>=OpenPrice[MinPriceElement]; x=x-(Cell*Tick))
        {
         ObjectCreate(0,DoubleToString(x,Digits()),OBJ_HLINE,ChartWindowFind(),0,NormalizeDouble(x,Digits()));
         ObjectSetInteger(0,DoubleToString(x,Digits()),OBJPROP_COLOR,LineColor);
         ObjectSetInteger(0,DoubleToString(x,Digits()),OBJPROP_STYLE,STYLE_DOT);
         ObjectSetInteger(0,DoubleToString(x,Digits()),OBJPROP_SELECTED,false);
         ObjectSetInteger(0,DoubleToString(x,Digits()),OBJPROP_WIDTH,1);
         Horizontal++;
        }
      ChartRedraw();
     }
//---
   return(Horizontal);
  }
Now that we have described all the basic functions, let's see the order in which they are called in OnCalculate():
- Start the function for copying data for calculations (provided that there are no calculated bars yet).
- Call the function for calculating the number of columns.
- Determine the column colors.
- Determine the column sizes.
- Call the function for data reversal in arrays.
- Call the function for plotting horizontal lines that will divide columns into "boxes".
// +++ Main calculations and plotting +++
//+------------------------------------------------------------------+
//| Custom indicator iteration function                              |
//+------------------------------------------------------------------+
int OnCalculate(const int rates_total,
                const int prev_calculated,
                const datetime &time[],
                const double &open[],
                const double &high[],
                const double &low[],
                const double &close[],
                const long &tick_volume[],
                const long &volume[],
                const int &spread[])
  {
//--- Reverse the array to conveniently get the last price value
   ArraySetAsSeries(close,true);
//---
   if(prev_calculated==0)
     {
      //--- Start the function for copying data for the calculation
      int ErrorCopy=FuncCopy(History);
      //--- In case of error, print the message
      if(ErrorCopy==-1)
        {
         Alert("Failed to copy. Data is still loading.");
         return(0);
        }
      //--- Call the function for calculating the number of columns
      Columns=FuncCalculate(History);
      //--- Call the function for coloring columns
      int ColorCalculate=FuncColor(Columns);
      //--- Call the function for determining column sizes
      int z=FuncDraw(History);
      //--- Start the function for array reversal
      int Turn=FuncTurnArray(Columns);
      //--- Start the function for drawing horizontal lines
      int Horizontal=FuncDrawHorizontal(true);
      //--- Store the value of the last closing price in the variable
      OldPrice=close[0];
     }
//--- If the price is one box size different from the previous one,
//--- the indicator is recalculated
   if(fabs((OldPrice-close[0])/Tick)>Cell)
      return(0);
//--- return value of prev_calculated for next call
   return(rates_total);
  }
// +++ Main calculations and plotting +++
That is the end of the core code of the indicator. But since the indicator has its disadvantages in that it contains complex arrays, it sometimes needs to be reloaded.
To implement this, we will use the OnChartEvent() function that handles events of pressing the "С" key - clear and the "R" key - redraw. In order to clear, a zero value is assigned to one of the indicator buffers. The function for chart redrawing represents a repetition of the previous calculations and assignment of the values to indicator buffers.
// +++ Secondary actions for the "С" key - clear and the "R" key - redraw +++
//+------------------------------------------------------------------+
//| ChartEvent function                                              |
//+------------------------------------------------------------------+
void OnChartEvent(const int id,
                  const long &lparam,
                  const double &dparam,
                  const string &sparam)
  {
//---
   if(id==CHARTEVENT_KEYDOWN)
     {
      //--- 67 - The "C" key code clears the indicator buffer
      if(lparam==67)
        {
         for(int x=0; x<Bars(Symbol(),PERIOD_CURRENT); x++)
            CandlesBufferOpen[x]=0;
         ChartRedraw();
        }
      // 82 - The "R" key code redraws the indicator
      if(lparam==82)
        {
         //--- Start the copying function
         int ErrorCopy=FuncCopy(History);
         //--- In case of error, print the message
         if(ErrorCopy==-1)
            Alert("Failed to copy data.");
         //--- Call the function for calculating the number of columns
         Columns=FuncCalculate(History);
         //--- Call the function for coloring columns
         int ColorCalculate=FuncColor(Columns);
         //--- Call the function for determining column sizes
         int z=FuncDraw(History);
         //--- Start the function for array reversal
         int Turn=FuncTurnArray(Columns);
         //--- Start the function for drawing horizontal lines
         int Horizontal=FuncDrawHorizontal(true);
        }
     }
  }
//+------------------------------------------------------------------+
// +++ Secondary actions for the "С" key - clear and the "R" key - redraw +++
We can now take a deep breath as we are done with the description of the algorithm and indicator code and can proceed to have a look at some Point and Figure chart patterns that generate signals for the execution of trades.
Standard Signals
There are two approaches in trading and analyzing Point and Figure charts: based on patterns and based on support and resistance lines. The latter is peculiar in that support and resistance lines are plotted at an angle of 45 degrees (this is not always so in a designed indicator as it is plotted using Japanese candlesticks whose size changes depending on the size of the main chart, which can lead to angle distortion).
Let's now consider the patterns as such:
-
"Double Top" and "Double Bottom" patterns.
"Double Top" occurs when the price goes up, then falls forming a certain column of O's and rises again, exceeding the previous column of X's by one Box Size. This pattern is a buy signal.
"Double Bottom" is the exact opposite of the "Double Top" pattern. There is a certain price fall (a column of O's) followed by a column of X's and another column of O's that falls one box below the previous column of O's, thus forming a sell signal.
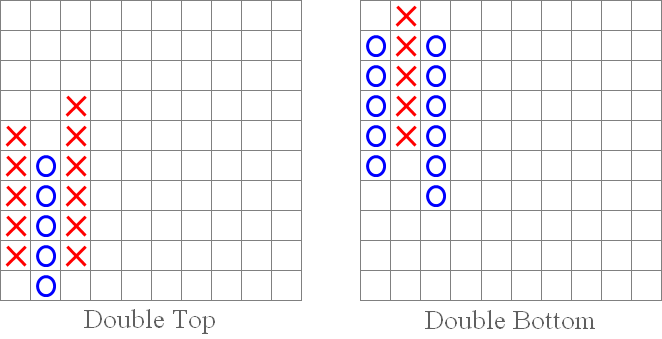
Fig. 3. "Double Top" and "Double Bottom" patterns.
-
"Triple Top" and "Triple Bottom" patterns.
These patterns are less frequent but represent very strong signals. Essentially, they are similar to the "Double Top" and "Double Bottom" patterns, being their continuation. Before they convey a signal, they repeat the movements of the above two patterns.
A "Triple Top" occurs when the price hits the same price level twice and then breaks out above that level, representing a buy signal.
The "Triple Bottom" pattern is opposite to "Triple Top" and occurs when the price falls to the same level twice and then breaks out below that level, thus conveying a sell signal.
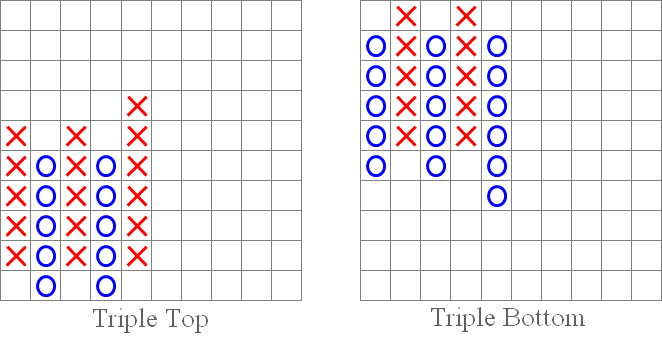
Fig. 4. "Triple Top" and "Triple Bottom" patterns.
-
"Symmetrical Triangle Breakout" patterns: upside and downside.
We all remember the technical analysis patterns. The "Symmetrical Triangle Breakout" pattern is similar to "Symmetrical Triangle" in technical analysis. An upside breakout (as shown below in the figure on the left) is a buy signal. Conversely, a downside breakdown is a sell signal (figure on the right).
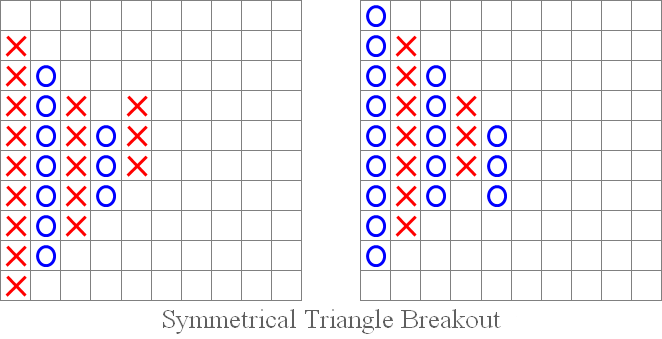
Fig. 5. "Symmetrical Triangle Breakout": upside and downside.
-
"Bullish Catapult" and "Bearish Catapult" patterns.
"Catapults" are in some way similar to the "Ascending Triangle" and "Descending Triangle" patterns of technical analysis. Their signals are essentially alike - as soon as the price breaks above or below the parallel side of the triangle, a buy or a sell signal occurs, respectively. In the case of the "Bullish Catapult", the price breaks out above, which is a buy signal (figure on the left), while in the case of the "Bearish Catapult" the price breaks out below, which is a sell signal (figure on the right).
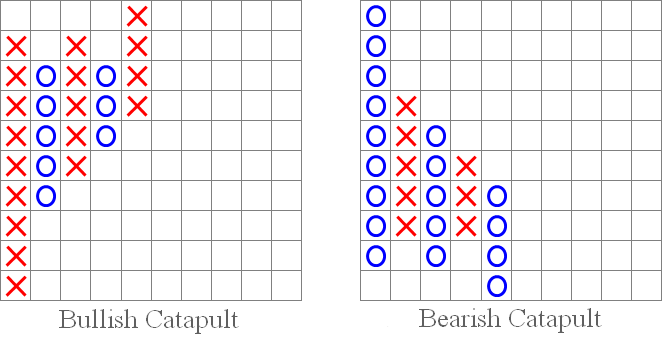
Fig. 6. "Bullish Catapult" and "Bearish Catapult" patterns.
-
"45-Degree Trend Line" pattern.
The "45-Degree Trend Line" pattern creates a support or a resistance line. If there is a breakout of that line, we either get a sell signal (as shown in the figure on the right) or a buy signal (as in the figure on the left).
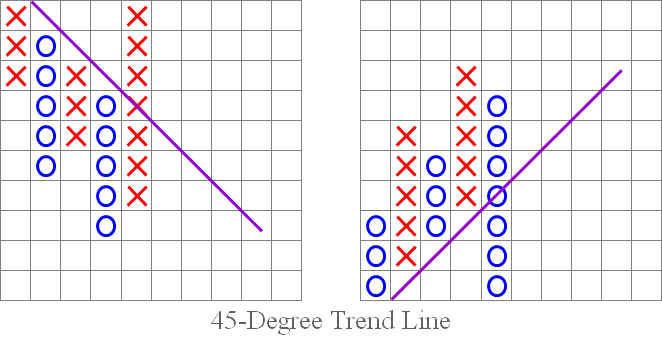
Fig. 7. "45-Degree Trend Line" pattern.
We have reviewed the standard Point and Figure chart patterns and signals. Let's now find some of them in the indicator chart provided at the beginning of the article:
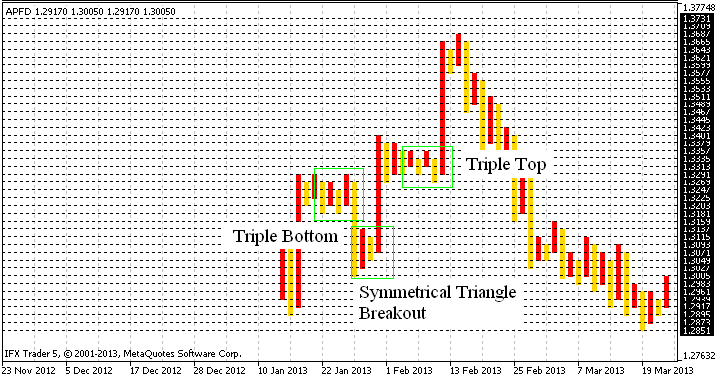
Fig. 8. Identifying patterns in the Point and Figure chart.
Conclusion
We have reached the final stage of the article. I would like to say here that Point and Figure chart is not lost in time and is still actively used, which once again proves its worth.
The developed indicator, although not devoid of drawbacks, such as block charting instead of the usual X's and O's and the inability to be tested (or rather, incorrect operation) in the Strategy Tester, yields quite accurate charting results.
I also want to note that this algorithm, in a slightly modified version, can potentially be used for Renko charting, as well as for integration of both chart types in a single code with menu options, allowing you to select, as appropriate. I do not exclude the possibility of plotting the chart directly in the main window, which again will require a slight code modification.
In general, the purpose of this article was to share my ideas regarding the indicator development. With this being my first article, I will appreciate any comments or feedback. Thank you for your interest in my article!
Translated from Russian by MetaQuotes Ltd.
Original article: https://www.mql5.com/ru/articles/656
- Free trading apps
- Over 8,000 signals for copying
- Economic news for exploring financial markets
You agree to website policy and terms of use
do you know other p&f indicators for MT5 (of course free!!) ??
https://www.mql5.com/en/code/954
https://www.mql5.com/en/articles/368
Forum on trading, automated trading systems and testing trading strategies
Indicators: Point and Figure
newdigital, 2013.09.12 16:29
Point & Figure Charting
Point & Figure Charting reduces the importance of time on a chart and instead focuses on price movements. Point & Figure charts are made up of X's and O's, X's being new highs and O's being new lows. There are two inputs to a Point & Figure chart:
One of the main uses for Point & Figure charts, and the one emphasized in this section, is that Point & Figure charts make it easier for traders to see classic chart patterns. In the chart below of the E-mini S&P 500 Future, the Point & Figure chart emphasized support and resistance lines as well as areas of price breakouts:
Again, the Point & Figure chart makes it easy for traders to see the double bottom pattern below in the chart of the E-mini S&P 500 Futures contract:
The e-mini chart above illustrates the two bottoms of the double bottom pattern, as well as the confirmation line that is pierced, resulting in a buying opportunity.
Point & Figure is a very unique way to plot market action. The strongsuit of Point & Figure charting is that it eliminates the element of time and focuses on what is truly important - priceI tried and understanded that the error of color the columns is related to the definition of the columns
Instead of one single column,it's better that columns seperate with continous blocks,and all column stick together.(one bearish column stick next bullish column and etc.)
I tried and understanded that the error of color the columns is related to the definition of the columns