
Indicator for Renko charting
Introduction
Articles Indicator for Point and Figure charting and Indicator for Kagi charting described Point and Figure and "Kagi" indicators charting principles. Let's study one of the programming ways of creating Renko chart.
The name "Renko" is derived from the Japanese word "renga", a brick. Renko chart is constructed from a series of bricks whose creation is determined by fluctuations in price. When a price rises, an up brick is placed on the chart and, with drop of prices a down brick is added. "Renko" means a "slow pace" in Japanese. The Renko chart appeared in Japan, probably, somewhere in the 19th century. The USA and Europe first heard about it after Steeve Nison published it in 1994, in his book Beyond Candlesticks: New Japanese Charting Techniques Revealed.
The Renko chart as the above mentioned charts ignores a timeline and is only concerned with price movement. Unlike Point and Figure chart, the Renko places each "brick" in a new column (in a new vertical plane), as for the rest, they have a common creating method: size of a "brick" ("point", "figure") is fixed, price analysis and figures lining are made in a similar way.
So, Renko chart is a set of vertical bars ("bricks"). White (hollow) bricks are used when the direction of the trend is up, while black (filled) bricks are used when the trend is down. The construction is regulated with the prices behaviour. The current price of the taken period is compared with minimum and maximum of the previous brick (white or black). If the stock closes higher than its opening price, a hollow (white) brick is drawn with the bottom of the body representing the opening price and the top of the body representing the closing price. If the stock closes lower than its opening price, a filled (black) brick is drawn with the top of the body representing the opening price and the bottom of the body representing the closing price.
The very first brick of the chart is drawn depending on the price behaviour, the bar opening price is taken for a maximum and a minimum of the previous brick.
A standard Renko chart example, Fig. 1:
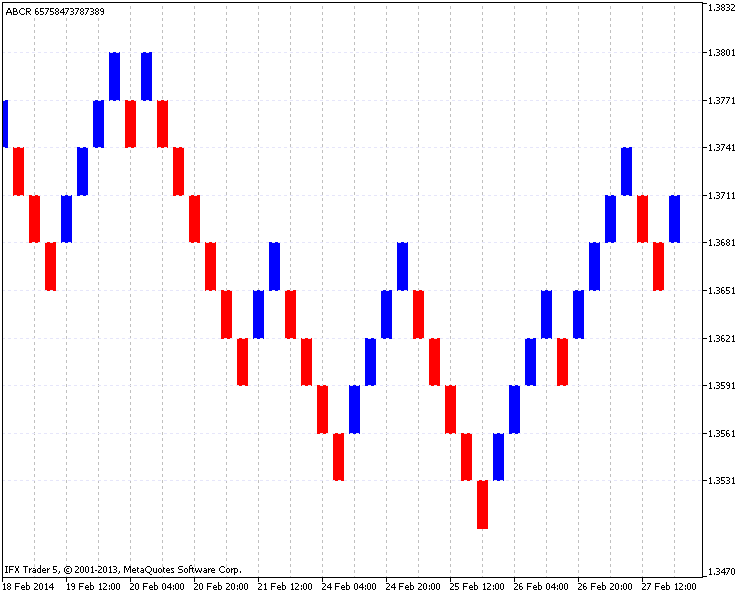
Fig. 1. A standard Renko chart example
1. Charting example
A standard Renko chart is drawn on the basis of the closing price. First, select the timeframe and the box size.
In this example the EURUSD (H4 timeframe) is used, with a 30-point box size. The result of the Renko charting from 03.01.2014 to 31.01.2014 (around one month) is shown in Fig. 2, on the left, there is charting of a given timeframe (here you can see the horizontal extension of bricks), on the right, there is a result of the Renko charting:

Fig.2. The result of the Renko charting in EURUSD (H4, box is 30 points)
Let us take a closer look at the charting principle. In the Fig. 2 red horizontal lines show the size of each brick according to changes in price (30 points), blue colour indicates the most interesting dates.
As you can see on the chart at the end of 03.01.2014 a candlestick closes below 1.3591 previously defined price ranges (red horizontal lines) at 1.3589 (marked with price), which creates a downward brick on the chart.
After that the price is flat (it does not close below 1.3561 or above 1.3651), it is opened till 20:00 10.01.2014 (the candlestick created at 16:00 closes) and closes (above 1.3651 price mark) at 1.3663 (marked with price). Then the price again becomes flat by 20:00 14.01.2014 (candlestick opened at 16:00 closes), where it overcomes price range, creates a new brick and closes at 1.3684.
Then you witness a downtick where price four times breaks through ranges declining on the chart. At 12:00 23.01.2014 (the candlestick opened at 08:00 closes) there is an upward breakthrough of two price ranges what, in its turn, opens two bricks by closing at 1.3639. The first brick is clearly visible, the second one is pulled in a long vertical line (due to the simultaneous opening with the first brick). Further construction continues on the same principles.
2. Renko charting principle
While developing this indicator all the functions have been implemented as independently as possible. One of the main objectives was to maximize the potential of the indicator to easier conduct the market analysis.
The calculations are not made within the current timeframe, i.e. the timeframe is selected in the settings, and regardless of the timeframe, where the indicator was launched, it will show the set up data. It can be achieved by copying the data of the taken period into separate buffer arrays, later calculations are made and the output buffer indicator is filled.
Standard Renko chart is constructed according to Close prices, however, Open, High, Low values are used to improve the analysis.
Since bricks in the Renko chart are similar in size it is useful to know the most dynamic market points driven by the strong price behaviour (in few bricks). For this purpose there is a (disabled) indication represented with a small vertical shadow (like in Japanese Candlestick) of a brick, which raises or lowers on the last brick level of the chosen timeframe bar.
The possibility to construct ZigZag on the main chart expands the graphical analysis.
Fig. 3 represents the indicator in full functionality:

Figure 3. The indicator for EURUSD chart (Daily, step is 25 points)
3. Code and algorithm of the indicator
The indicator code is rather large as it is constructed of 900 lines. As mentioned earlier, maximum separated functions may complicate the understanding of the algorithm. Some functions from the previous article will be used as the basis. In case of misunderstanding some aspects, you can refer to the Kagi chart construction indicator or you can email me.
Each function of the code will be explained in the article. Functions will be described on the spot.
3.1. Indicator input parameters
The Renko chart is the range of up and down bricks of different color. This type of construction requires only five buffers combined in one "Colored candlesticks" graphical construction. The remaining four buffers collect data required to calculate the indicator.
Take the input parameters (25), divided into groups.
- step - a brick size or step;
- type_step - type of step, in points or in percentage (the latter is calculated depend on the current price);
- magic_numb - a magic number required to distinguish graphical objects and used to remove them from the chart;
- levels_number - levels (0- no levels) to divide bricks in the indicator window;
- levels_color - color of levels in the indicator window;
- time_frame - used to set a period for the chart construction (the analyzed period);
- time_redraw - update time of the chart;
- first_date_start - date to start charting;
- type_price - types of price for construction: Close - the standard method based on the closing price; Open - opening price; High - maximum prices and Low - minimum prices;
- shadow_print - if you set the true option, shadows represent the maximum or minimum price caused several bricks opening;
- filter_number - bricks value used for the chart reversal(an extra option responsible for the number of bricks required to reverse the chart);
- zig_zag - used to draw ZigZags on the main chart (an extra drawing on the main chart which facilitates an analysis or used for the chart uptading);
- zig_zag_shadow - used to draw ZigZags according to the maximum and minimum prices (uses the closest maximum and minimum prices to construct zigzags on endpoints);
- zig_zag_width - ZigZag line width;
- zig_zag_color_up - ZigZag upward line color;
- zig_zag_color_down - ZigZag downward line color;
- square_draw - used to draw bricks on the main chart (in this mode you can see prices movements which open bricks);
- square_color_up - brick color on the main upward chart;
- square_color_down - brick color on the main downward chart;
- square_fill - brick coloring on the main chart;
- square_width - brick line width on the main chart;
- frame_draw - used to draw brick frames (represents bricks borders, it is an extra option which is rarely used);
- frame_width - brick line width;
- frame_color_up - color of up bricks borders;
- frame_color_down - color of down bricks borders.
Then the code declares buffers: five main buffers are used for graphical drawing whereas four are used to store design and calculation data. Price[] - buffer to store the copied prices used for construction, Date[] - buffer to store copied data used for drawing on the main chart, Price_high[] and Price_low[] - buffers to store maximum and minimum values applied in ZigZags drawings on the main chart.
After that calculation buffers arrays and auxiliary functions variables are declared: func_draw_renko, func_draw_zig_zag, func_draw_renko_main_chart. They will be explained later.
//+------------------------------------------------------------------+
//|                                                         ABCR.mq5 |
//|                                   Azotskiy Aktiniy ICQ:695710750 |
//|                          https://www.mql5.com/ru/users/Aktiniy |
//+------------------------------------------------------------------+
//--- Auto Build Chart Renko
#property copyright "Azotskiy Aktiniy ICQ:695710750"
#property link      "https://www.mql5.com/ru/users/Aktiniy"
#property version   "1.00"
#property description "Auto Build Chart Renko"
#property description "   "
#property description "This indicator used to draw Renko chart in the indicator window, and in the main chart window"
#property indicator_separate_window
#property indicator_buffers 9
#property indicator_plots   1
//--- plot RENKO
#property indicator_label1  "RENKO"
#property indicator_type1   DRAW_COLOR_CANDLES
#property indicator_color1  clrRed,clrBlue,C'0,0,0',C'0,0,0',C'0,0,0',C'0,0,0',C'0,0,0',C'0,0,0'
#property indicator_style1  STYLE_SOLID
#property indicator_width1  1
//--- construction method
enum type_step_renko
  {
   point=0,   // Point
   percent=1, // Percent
  };
//--- type of price
enum type_price_renko
  {
   close=0, // Close
   open=1,  // Open
   high=2,  // High
   low=3,   // Low
  };
//--- input parameters
input double           step=10;                                 // Step
input type_step_renko  type_step=point;                         // Type of step
input long             magic_numb=65758473787389;               // Magic number
input int              levels_number=1000;                      // Number of levels (0-no levels)
input color            levels_color=clrLavender;                // Color of levels
input ENUM_TIMEFRAMES  time_frame=PERIOD_CURRENT;               // Calculation period
input ENUM_TIMEFRAMES  time_redraw=PERIOD_M1;                   // Chart redraw period
input datetime         first_date_start=D'2013.09.13 00:00:00'; // Start date
input type_price_renko type_price=close;                        // Price for construction
input bool             shadow_print=true;                       // Show shadows
input int              filter_number=0;                         // Bricks number needed to reversal
input bool             zig_zag=true;                            // Whether ZigZag should be drawn on the main chart
input bool             zig_zag_shadow=true;                     // Draw ZigZag at highs and lows of the price
input int              zig_zag_width=2;                         // ZigZag line width
input color            zig_zag_color_up=clrBlue;                // ZigZag up line color
input color            zig_zag_color_down=clrRed;               // ZigZag down line color
input bool             square_draw=true;                        // Whether bricks should be drawn on the main chart
input color            square_color_up=clrBlue;                 // Up brick color on the main chart
input color            square_color_down=clrRed;                // Down brick color on the main chart
input bool             square_fill=true;                        // Brick filling on the main chart
input int              square_width=2;                          // Brick line width on the main chart
input bool             frame_draw=true;                         // Whether to draw frames of the bricks
input int              frame_width=2;                           // Brick frame line width
input color            frame_color_up=clrBlue;                  // Up brick frames color
input color            frame_color_down=clrRed;                 // Down brick frames color
//--- indicator buffers
double         RENKO_open[];
double         RENKO_high[];
double         RENKO_low[];
double         RENKO_close[];
double         RENKO_color[];

double         Price[];      // copy price data to the buffer
double         Date[];       // copy data to the buffer
double         Price_high[]; // copy high prices to the buffer
double         Price_low[];  // copy low prices to the buffer
//--- calculation buffer arrays
double         up_price[];    // up brick price
double         down_price[];  // down brick price
char           type_box[];    // brick type (up, down)
datetime       time_box[];    // brick copy time
double         shadow_up[];   // up high price
double         shadow_down[]; // down low price
int            number_id[];   // Index of Price_high and Price_low arrays
//--- calculation global variables
int obj=0;           //variable for storing number of graphics objects
int a=0;             // variable to count bricks
int bars;            // number of bars
datetime date_stop;  // current data
datetime date_start; // start date variable, for calculations
bool date_change;    // variable for storing details about time changes
3.2. Indicator initializer
Indicator buffers are bound with one-dimensional dynamic arrays, addressing, as well as in timeseries, is set in INDICATOR_DATA and INDICATOR_COLOR_INDEX buffers. The addressing of the rest dynamic arrays (Price[], Date[], Price_high[], Price_low[])is left without changes, as they are only used to store data.
The values that are not displayed on the chart are set. Then the name is assigned to the indicator, the display accuracy is set and display of the current numerical values is prohibited in the indicator window.
After that the date_start variable value (date to start calculations) is assigned. The value to the variable is assigned, the input value is not used as the chart may be too heavy for the indicator buffer. The start date is corrected and the custom is announced. The function of the analysis start date or "func_calc_date_start" performs corrections of time.
//+------------------------------------------------------------------+
//| Custom indicator initialization function                         |
//+------------------------------------------------------------------+
int OnInit()
  {
//--- indicator buffers mapping
   SetIndexBuffer(0,RENKO_open,INDICATOR_DATA);
   ArraySetAsSeries(RENKO_open,true);
   SetIndexBuffer(1,RENKO_high,INDICATOR_DATA);
   ArraySetAsSeries(RENKO_high,true);
   SetIndexBuffer(2,RENKO_low,INDICATOR_DATA);
   ArraySetAsSeries(RENKO_low,true);
   SetIndexBuffer(3,RENKO_close,INDICATOR_DATA);
   ArraySetAsSeries(RENKO_close,true);
   SetIndexBuffer(4,RENKO_color,INDICATOR_COLOR_INDEX);
   ArraySetAsSeries(RENKO_color,true);
//---
   SetIndexBuffer(5,Price,INDICATOR_CALCULATIONS);      // initialize price buffer
   SetIndexBuffer(6,Date,INDICATOR_CALCULATIONS);       // initialize data buffer
   SetIndexBuffer(7,Price_high,INDICATOR_CALCULATIONS); // initialize high price
   SetIndexBuffer(8,Price_low,INDICATOR_CALCULATIONS);  // initialize low price
//--- set data which will not be drawn
   PlotIndexSetDouble(0,PLOT_EMPTY_VALUE,0);
//--- set the indicator appearance
   IndicatorSetString(INDICATOR_SHORTNAME,"ABCR "+IntegerToString(magic_numb)); // indicator name
//--- display accuracy
   IndicatorSetInteger(INDICATOR_DIGITS,_Digits);
//--- prohibit display of the results of the indicator current values
   PlotIndexSetInteger(0,PLOT_SHOW_DATA,false);
//--- assign start date variable value
   date_start=first_date_start;
//---
   return(INIT_SUCCEEDED);
  }
3.3. The analysis start date calculation function
The function is small and it mainly consists of a loop. There is only two input parameters - initially set start date and calculation end date (the current date). The start date is changed in the function and it is displayed as an answer.
The function body begins from measuring the recieving buffer array (all buffers have the same size which is equal to the number of the selected timeframe bars). Then a number of bars is measured on the selected timeframe.
Number of bars of the chosen timeframe and buffer array size are compared in the loop condition. If you have more bars, i.e. they cannot be placed all into the buffer array, the taken timeframe is shortened on ten days which means that ten days are added to the analysis start date. This continues until the buffer array will not be able to include all bars data. The function returns the calculated date.
//+------------------------------------------------------------------+
//| Func Calculate Date Start                                        |
//+------------------------------------------------------------------+
datetime func_calc_date_start(datetime input_data_start,// initially start date set
                              datetime data_stop)       // calculation end date (current date)
//---
  {
   int Array_Size=ArraySize(Price);
   int Bars_Size=Bars(_Symbol,time_frame,input_data_start,data_stop);
   for(;Bars_Size>Array_Size;input_data_start+=864000) // 864000 = 10 days
     {
      Bars_Size=Bars(_Symbol,time_frame,input_data_start,data_stop);
     }
   return(input_data_start);
//---
  }
3.4. The data copying function
First, the data are copied with the data copying functions (func_copy_price and func_copy_date).
Let us consider the price copying function or func_copy_price, which allows you to copy in the array Open, Close, High and Low prices of the set period and timeframe. In case of a successful copy the function returns "true".
At the beginning of the function call the false value is initialized, then an outcome variable of the copied data is initialized and a negative value is assigned. A common array price_interim[] to store temporary copied data and the bars_to_copy variable are declared to prevent saving of copied data.
Further, the function resets earlier declared variables for storing the copied data, calculates the number of bars on the timeframe, and, according to the chosen price (0-Close, 1-Open, 2-High and 3-Low) and a switch statement, assigns the value of previously copied data on the bars_copied variable prices. After that the number of data to be copied is calculated. If the data were copied before, the last copied bar information is deleted to prevent changes on the chart.
A switch copies the required price data into the price_interim[] time array. After that, the result of copying is checked and a switch fills copied data variables.
//+------------------------------------------------------------------+
//| Func Copy Price                                                  |
//+------------------------------------------------------------------+
bool func_copy_price(double &result_array[],
                     ENUM_TIMEFRAMES period,// Timeframe
                     datetime data_start,
                     datetime data_stop,
                     char price_type) // 0-Close, 1-Open, 2-High, 3-Low
  {
//---
   int x=false;        // Variable for answering
   int result_copy=-1; // copied data number
//---
   static double price_interim[]; // Temporal dynamic array for storing copied data
   static int bars_to_copy;       // number of bars to copy
   static int bars_copied_0;      // number of copied bars from Close start date
   static int bars_copied_1;      // number of copied bars from Open start date
   static int bars_copied_2;      // number of copied bars from High start date
   static int bars_copied_3;      // number of copied bars from Low start date
   static int bars_copied;        // number of copied bars from the common variable start date
//--- variables reset due to changes in a start date
   if(date_change==true)
     {
      ZeroMemory(price_interim);
      ZeroMemory(bars_to_copy);
      ZeroMemory(bars_copied_0);
      ZeroMemory(bars_copied_1);
      ZeroMemory(bars_copied_2);
      ZeroMemory(bars_copied_3);
      ZeroMemory(bars_copied);
     }
//--- get an information about the current bars number on the timeframe
   bars_to_copy=Bars(_Symbol,period,data_start,data_stop);
//--- assign a copied function value to a common variable
   switch(price_type)
     {
      case 0:
         //--- Close
         bars_copied=bars_copied_0;
         break;
      case 1:
         //--- Open
         bars_copied=bars_copied_1;
         break;
      case 2:
         //--- High
         bars_copied=bars_copied_2;
         break;
      case 3:
         //--- Low
         bars_copied=bars_copied_3;
         break;
     }
//--- calculate number of bars required to be copied
   bars_to_copy-=bars_copied;
//--- if it is not the first time the data has been copied
   if(bars_copied!=0)
     {
      bars_copied--;
      bars_to_copy++;
     }
//--- change the size of the recieving array
   ArrayResize(price_interim,bars_to_copy);
//--- copy data to the recieving array
   switch(price_type)
     {
      case 0:
         //--- Close
        {
         result_copy=CopyClose(_Symbol,period,0,bars_to_copy,price_interim);
        }
      break;
      case 1:
         //--- Open
        {
         result_copy=CopyOpen(_Symbol,period,0,bars_to_copy,price_interim);
        }
      break;
      case 2:
         //--- High
        {
         result_copy=CopyHigh(_Symbol,period,0,bars_to_copy,price_interim);
        }
      break;
      case 3:
         //--- Low
        {
         result_copy=CopyLow(_Symbol,period,0,bars_to_copy,price_interim);
        }
      break;
     }
//--- check the result of data copying
   if(result_copy!=-1) // if copying to the intermediate array is successful
     {
      ArrayCopy(result_array,price_interim,bars_copied,0,WHOLE_ARRAY); // copy the data from the temporary array to the main one
      x=true;                   // assign the positive answer to the function
      bars_copied+=result_copy; // increase the value of the processed data
     }
//--- return the information about the processed data with one of the copied variables
   switch(price_type)
     {
      case 0:
         //--- Close
         bars_copied_0=bars_copied;
         break;
      case 1:
         //--- Open
         bars_copied_1=bars_copied;
         break;
      case 2:
         //--- High
         bars_copied_2=bars_copied;
         break;
      case 3:
         //--- Low
         bars_copied_3=bars_copied;
         break;
     }
//---
   return(x);
  }
"func_copy_date" or the date copy function. The code of the function is similar to the above mentioned unit, the difference is in the type of the copied data.
//+------------------------------------------------------------------+
//| Func Copy Date                                                   |
//+------------------------------------------------------------------+
bool func_copy_date(double &result_array[],
                    ENUM_TIMEFRAMES period,// timeframe
                    datetime data_start,
                    datetime data_stop)
  {
//---
   int x=false;                    // variable for answer
   int result_copy=-1;             // number of copied data
   static datetime time_interim[]; // temporaty dynamic array for storing the copied data
   static int bars_to_copy;        // bars number required to be copied
   static int bars_copied;         // copied bars with start date
//--- variables reset due to the start date change
   if(date_change==true)
     {
      ZeroMemory(time_interim);
      ZeroMemory(bars_to_copy);
      ZeroMemory(bars_copied);
     }
//---
   bars_to_copy=Bars(_Symbol,period,data_start,data_stop); // Find out the current number of bars on the time interval
   bars_to_copy-=bars_copied; // Calculate the number of bars to be copied
//---
   if(bars_copied!=0) // If it is not the first time the data has been copied
     {
      bars_copied--;
      bars_to_copy++;
     }
//---
   ArrayResize(time_interim,bars_to_copy); // Change the size of the receiving array
   result_copy=CopyTime(_Symbol,period,0,bars_to_copy,time_interim);
//---
   if(result_copy!=-1) // If copying to the intermediate array is successful
     {
      ArrayCopy(result_array,time_interim,bars_copied,0,WHOLE_ARRAY); // Copy the data from the temporary array to the main one
      x=true; // assign the positive answer to the function
      bars_copied+=result_copy; // Increase the value of the processed data
     }
//---
   return(x);
  }
3.5. Bricks calculation
As you can see from the indicator parameters, a brick size can be set both in points and in percentage of the current price. Points is a fixed value but how do calculations in percentage occur? For this purpose there is the "func_calc_dorstep" bricks calculating function.
There are three input parameters: the current price (to calculate percentage of the price, if the brick size is in percentage), the calculation method (points or percentage), and the step size (set with one value which can be in percentage or in points).
At the beginning of the function the variable for the answer is initialized by double type and depending on the calculation method selected by if-else conditional statement is assigned in points. Then the answer variable is converted to int type to keep the value integer even if the calculations resulted in the nonintegral value.
//+------------------------------------------------------------------+
//| Func Calculate Doorstep                                          |
//+------------------------------------------------------------------+
int func_calc_dorstep(double price,      // price
                      char type_doorstep,// step type
                      double doorstep)   // step
  {
   double x=0;          // variable for answer

   if(type_doorstep==0) // If the calculation is to be performed in points
     {
      x=doorstep;
     }

   if(type_doorstep==1) // If the calculation is to be performed in percentage
     {
      x=price/_Point*doorstep/100;
     }

   return((int)x);
  }
3.6. The Main Function - Renko Chart graduating
The main function of Renko chart graduating - "func_draw_renko". This function is responsible for graphical buffers (indicator buffers) and filling of the calculation buffers arrays. Calculation buffers store the information of each brick.
Input parameters of the function are data arrays of prices and bars construction dates. Here you can find an information about type of step and its parameter, the reverse filter and the shadows drawing parameter.
The function can be divided into two parts: the part with bricks calculation number and the part with calculating and graphical buffers filling.
In the beginning of the function buffers are reset to switch off empty boxes. Later auxiliary variables are entered: "doorstep_now" variable is used for step (used to change its size at the percentage step), "point_go" stores information about the distance from the last built brick, "a" variable is used for bricks calculation, "up_price_calc" and "down_price_calc" - the last analyzed high and low prices, "type_box_calc" - the last analyzed brick type (up or down).
Both function parts consist of a loop, the second part completes the first one. Analyze the process in details.
The first loop is processed through all copied values, the "bars" value is responsible for a number of copied data (it is calculated in a "func_concolidation" function, which will be considered later). Further in the loop the function begins calculations of the brick size. Since each bar has a different close price, if the percentage step is used, it should be calculated for each bar separately.
The conditional if statement checks the price direction, whereas the price has to pass one or more step distance. After the price move direction was determined, the condition of the previous movement (the last brick) is checked. This is done because the indicator parameters include the filter parameter (number of bricks required for reversal). After all the conditions are checked the loop is started, it is processed as many times as bricks represent the current price movement.
Display bars are calculated, the calculating buffers arrays are changed in size, and they are reset. After that, first few (used during the first comparison) calculating arrays are assigned primary values.
If the maximum possible number of displayed bars is less than the possible number of bricks, extra bricks are calculated and the message about the low value is displayed. This is done to prevent wrong display of the chart.
The variable of bricks number calculating is reset and the main loop starts. Unlike the previous loop the main loop is also responsible for filling of calculating buffer arrays and bricks counter resetting.
In the end of the function the graphic buffers are filled.
//+------------------------------------------------------------------+
//| Func Draw Renko                                                  |
//+------------------------------------------------------------------+
void func_draw_renko(double &price[],   // prices array
                     double &date[],    // date array
                     int number_filter, // bricks number for reversal
                     bool draw_shadow,  // draw shadow
                     char type_doorstep,// step type
                     double doorstep)   // step
  {
//--- arrays reset
//--- drawing buffer arrays
   ZeroMemory(RENKO_close);
   ZeroMemory(RENKO_color);
   ZeroMemory(RENKO_high);
   ZeroMemory(RENKO_low);
   ZeroMemory(RENKO_open);
//--- additional variables
   int doorstep_now; // current step
   int point_go;     // passed points
//--- additional variables for bricks number calculating
   a=0;
   double up_price_calc=price[0];
   double down_price_calc=price[0];
   char type_box_calc=0;

   for(int z=0; z<bars; z++) //---> bricks calculating loop
     {
      //--- calculate step according to the current price
      doorstep_now=func_calc_dorstep(price[z],type_doorstep,doorstep);
      //--- if price rises
      if((price[z]-up_price_calc)/_Point>=doorstep_now)
        {
         //--- calculate points passed
         point_go=int((price[z]-up_price_calc)/_Point);
         //--- prices was rising or unknown price behavour
         if(type_box_calc==1 || type_box_calc==0)
           {
            for(int y=point_go; y>=doorstep_now; y-=doorstep_now)
              {
               //--- add the next brick
               a++;
               //--- add value of the next brick low price
               down_price_calc=up_price_calc;
               //--- add value of the next brick up price
               up_price_calc=down_price_calc+(doorstep_now*_Point);
               //--- set the brick type (up)
               type_box_calc=1;
              }
           }
         //--- price went down
         if(type_box_calc==-1)
           {
            if((point_go/doorstep_now)>=number_filter)
              {
               for(int y=point_go; y>=doorstep_now; y-=doorstep_now)
                 {
                  //--- add the next brick
                  a++;
                  //--- set the next brick down price
                  down_price_calc=up_price_calc;
                  //--- set the next brick up price
                  up_price_calc=down_price_calc+(doorstep_now*_Point);
                  //--- set the brick type (up)
                  type_box_calc=1;
                 }
              }
           }
        }
      //--- if the price moves downwards
      if((down_price_calc-price[z])/_Point>=doorstep_now)
        {
         //--- calculate the points passed
         point_go=int((down_price_calc-price[z])/_Point);
         //--- if the price went downwards or the direction is unknown
         if(type_box_calc==-1 || type_box_calc==0)
           {
            for(int y=point_go; y>=doorstep_now; y-=doorstep_now)
              {
               //--- add the next brick
               a++;
               //--- set the next brick low price value
               up_price_calc=down_price_calc;
               //--- set the next brick up price value
               down_price_calc=up_price_calc-(doorstep_now*_Point);
               //--- set the britck type (up)
               type_box_calc=-1;
              }
           }
         //--- the price moved upwards
         if(type_box_calc==1)
           {
            if((point_go/doorstep_now)>=number_filter)
              {
               for(int y=point_go; y>=doorstep_now; y-=doorstep_now)
                 {
                  //--- add the next brick
                  a++;
                  //--- set the next brick down price value
                  up_price_calc=down_price_calc;
                  //--- set the next brick up price value
                  down_price_calc=up_price_calc-(doorstep_now*_Point);
                  //--- set the brick type (up)
                  type_box_calc=-1;
                 }
              }
           }
        }
     } //---< bricks calculate loop
//--- calculate the number of display bars
   int b=Bars(_Symbol,PERIOD_CURRENT);
//--- resize arrays
   ArrayResize(up_price,b);
   ArrayResize(down_price,b);
   ArrayResize(type_box,b);
   ArrayResize(time_box,b);
   ArrayResize(shadow_up,b);
   ArrayResize(shadow_down,b);
   ArrayResize(number_id,b);
//--- resize calculation buffers array
   ZeroMemory(up_price);
   ZeroMemory(down_price);
   ZeroMemory(type_box);
   ZeroMemory(time_box);
   ZeroMemory(shadow_up);
   ZeroMemory(shadow_down);
   ZeroMemory(number_id);
//--- fill arrays with the initial values
   up_price[0]=price[0];
   down_price[0]=price[0];
   type_box[0]=0;
//--- calculate odd bricks number
   int l=a-b;
   int turn_cycle=l/(b-1);
   int turn_rest=(int)MathMod(l,(b-1))+2;
   int turn_var=0;
//--- message of partially displayed bricks
   if(a>b)Alert("More bricks than can be placed on the chart, the step is small");

   a=0; //--- reset bricks claculating variable
   for(int z=0; z<bars; z++) //---> Main loop
     {
      //--- calculate the step according to the price
      doorstep_now=func_calc_dorstep(price[z],type_doorstep,doorstep);
      //---if the price moves upwards
      if((price[z]-up_price[a])/_Point>=doorstep_now)
        {
         //--- calculate the points passed
 point_go=int((price[z]-up_price[a])/_Point);
         //--- price moved upwards or its behavour is unknown
         if(type_box[a]==1 || type_box[a]==0)
           {
            for(int y=point_go; y>=doorstep_now; y-=doorstep_now)
              {
               a++; //--- add the next brick
               if((a==b && turn_var<turn_cycle) || (turn_var==turn_cycle && turn_rest==a))
                 {
                  up_price[0]=up_price[a-1];
                  a=1;        // bricks calculator reset
                  turn_var++; // calculator of loops reset
                 }
               //--- the next brick low price value
               down_price[a]=up_price[a-1];
               //--- set the brick up price
               up_price[a]=down_price[a]+(doorstep_now*_Point);

               //--- set the up shadow value
               if(shadow_print==true) shadow_up[a]=price[z]; //to the upper price level
               else shadow_up[a]=up_price[a];                // to the up price level

               //--- set the low price value(to the brick price level)
               shadow_down[a]=down_price[a];
               //--- value of the brick closing time
               time_box[a]=(datetime)Date[z];
               //--- set the brick type (up)
               type_box[a]=1;
               //--- set the index
               number_id[a]=z;
              }
           }
         //--- the price moved downwards
         if(type_box[a]==-1)
           {
            if((point_go/doorstep_now)>=number_filter)
              {
               for(int y=point_go; y>=doorstep_now; y-=doorstep_now)
                 {
                  a++; //--- add the next brick

                  if((a==b && turn_var<turn_cycle) || (turn_var==turn_cycle && turn_rest==a))
                    {
                     up_price[0]=up_price[a-1];
                     a=1;        // bricks counter reset
                     turn_var++; // loops reset cycle
                    }
                  //--- set the next brick low price value
                  down_price[a]=up_price[a-1];
                  //--- set the next brick up price
                  up_price[a]=down_price[a]+(doorstep_now*_Point);

                  //--- set the up shadow value
                  if(shadow_print==true) shadow_up[a]=price[z]; // at the up price level
                  else shadow_up[a]=up_price[a];                // the brick up price level

                  //--- set of the down price value (the brick price level)
                  shadow_down[a]=down_price[a];
                  //--- set the close time
                  time_box[a]=(datetime)Date[z];
                  //--- set the up brick
                  type_box[a]=1;
                  //--- set index
                  number_id[a]=z;
                 }
              }
           }
        }

      //--- if price moves upwards
      if((down_price[a]-price[z])/_Point>=doorstep_now)
        {
         //--- calculate the points passed
         point_go=int((down_price[a]-price[z])/_Point);
         //--- price moved downwards or the direction is unknown
         if(type_box[a]==-1 || type_box[a]==0)
           {
            for(int y=point_go; y>=doorstep_now; y-=doorstep_now)
              {
               a++; //--- add the next brick
               if((a==b && turn_var<turn_cycle) || (turn_var==turn_cycle && turn_rest==a))
                 {
                  down_price[0]=down_price[a-1];
                  a=1;        // set the bricks counter to zero
                  turn_var++; // reset loop counter
                 }
               //--- set the next brick down price
               up_price[a]=down_price[a-1];
               //--- set the next brick up price
               down_price[a]=up_price[a]-(doorstep_now*_Point);

               //--- set the down shadow value
               if(shadow_print==true) shadow_down[a]=price[z]; //--- the last lowest price level
               else shadow_down[a]=down_price[a];              //--- low price level

               //--- set the up price value
               shadow_up[a]=up_price[a];
               //--- set the brick close time
               time_box[a]=set the down shadow value];
               //--- set the brick type (down)
               type_box[a]=-1;
               //--- set index
               number_id[a]=z;
              }
           }
         //--- price moved upwards
         if(type_box[a]==1)
           {
            if((point_go/doorstep_now)>=number_filter)
              {
               for(int y=point_go; y>=doorstep_now; y-=doorstep_now)
                 {
                  a++; //--- add the next brick
                  if((a==b && turn_var<turn_cycle) || (turn_var==turn_cycle && turn_rest==a))
                    {
                     down_price[0]=down_price[a-1];
                     a=1;        // reset bricks counter
                     turn_var++; // reset loop counter
                    }

                  up_price[a]=down_price[a-1]; //--- set the next brick down price
                  down_price[a]=up_price[a]-(doorstep_now*_Point); //--- set the up price value

                  //--- set the down shadow value
                  if(shadow_print==true) shadow_down[a]=price[z]; // at the lowest price level
                  else shadow_down[a]=down_price[a];              // at the down price level

                  //--- set the up price level
                  shadow_up[a]=up_price[a];
                  //--- set the brick close time
                  time_box[a]=(datetime)Date[z];
                  //--- set the brick type (down)
                  type_box[a]=-1;
                  //--- index set
                  number_id[a]=z;
                 }
              }
           }
        }
     } //---< Main loop

//--- fill the draw buffer
   int y=a;
   for(int z=0; z<a; z++)
     {
      if(type_box[y]==1)RENKO_color[z]=0;
      else RENKO_color[z]=1;
      RENKO_open[z]=down_price[y];
      RENKO_close[z]=up_price[y];
      RENKO_high[z]=shadow_up[y];
      RENKO_low[z]=shadow_down[y];
      y--;
     }
  }
3.7. Function for creating the "Trend line" and "rectangle" graphical objects
Function for creating the "trend line" graphical object or "func_create_trend_line" and function for creating the "rectangle" graphical object or "func_create_square_or_rectangle" are based on the data mentioned in the reference to OBJ_RECTANGLE and OBJ_TREND. They are used to create graphical objects in "Renko" chart and to construct "ZigZag" on the main chart.
//+------------------------------------------------------------------+
//| Func Create Trend Line                                           |
//+------------------------------------------------------------------+
void func_create_trend_line(string name,
                            double price1,
                            double price2,
                            datetime time1,
                            datetime time2,
                            int width,
                            color color_line)
  {
   ObjectCreate(0,name,OBJ_TREND,0,time1,price1,time2,price2);
//--- set the line color
   ObjectSetInteger(0,name,OBJPROP_COLOR,color_line);
//--- set the line display style
   ObjectSetInteger(0,name,OBJPROP_STYLE,STYLE_SOLID);
//--- set the width of the line
   ObjectSetInteger(0,name,OBJPROP_WIDTH,width);
//--- display in the foreground (false) or in the (true) background
   ObjectSetInteger(0,name,OBJPROP_BACK,false);
//--- enable (true) or disable (false) the mode of the left line display
   ObjectSetInteger(0,name,OBJPROP_RAY_LEFT,false);
//--- enable (true) or disable (false) the right line display
   ObjectSetInteger(0,name,OBJPROP_RAY_RIGHT,false);
  }
//+------------------------------------------------------------------+
//| Func Create Square or Rectangle                                  |
//+------------------------------------------------------------------+
void func_create_square_or_rectangle(string name,
                                     double price1,
                                     double price2,
                                     datetime time1,
                                     datetime time2,
                                     int width,
                                     color color_square,
                                     bool fill)
  {
//--- create rectangle according to the setpoints
   ObjectCreate(0,name,OBJ_RECTANGLE,0,time1,price1,time2,price2);
//--- set the rectangle color
   ObjectSetInteger(0,name,OBJPROP_COLOR,color_square);
//--- set style of rectangle color
   ObjectSetInteger(0,name,OBJPROP_STYLE,STYLE_SOLID);
//--- set lines width
   ObjectSetInteger(0,name,OBJPROP_WIDTH,width);
//--- activate (true) or disactivate (false) mode of rectangle colouring
   ObjectSetInteger(0,name,OBJPROP_FILL,fill);
//--- display in the foreground (false) or in the background (true)
   ObjectSetInteger(0,name,OBJPROP_BACK,false);
  }
3.8. The "Renko" construction on the main chart
Due to the use of the calculation common buffer arrays the function for the Renko charting or the "func_draw_renko_main_chart" is rather compact.
The input parameters include: the upward and downward brick with their frames, two types of frames width (the first one is used for the brick, the second - for its frame), three display options (of "bricks", their colors and frames).
First, variables with names of objects are declared, then the loop with the generated name of each object is opened and depending on the previous brick type the function of the "trend line" and the "rectangle" graphic objects is launched. The parameters are taken from the calculation buffer arrays.
//+------------------------------------------------------------------+
//| Func Draw Renko Main Chart                                       |
//+------------------------------------------------------------------+
void func_draw_renko_main_chart(color color_square_up,
                                color color_square_down,
                                color color_frame_up,
                                color color_frame_down,
                                int width_square,
                                int width_frame,
                                bool square,
                                bool fill,
                                bool frame)
  {
   string name_square;
   string name_frame;

   for(int z=2; z<=a; z++)
     {
      name_square=IntegerToString(magic_numb)+"_Square_"+IntegerToString(z);
      name_frame=IntegerToString(magic_numb)+"_Frame_"+IntegerToString(z);
      if(type_box[z]==1)
        {
         if(square==true)func_create_square_or_rectangle(name_square,up_price[z],down_price[z],time_box[z-1],time_box[z],width_square,color_square_up,fill);
         if(frame==true)func_create_square_or_rectangle(name_frame,up_price[z],down_price[z],time_box[z-1],time_box[z],width_frame,color_frame_up,false);
        }
      if(type_box[z]==-1)
        {
         if(square==true)func_create_square_or_rectangle(name_square,up_price[z],down_price[z],time_box[z-1],time_box[z],width_square,color_square_down,fill);
         if(frame==true)func_create_square_or_rectangle(name_frame,up_price[z],down_price[z],time_box[z-1],time_box[z],width_frame,color_frame_down,false);
        }
     }
  }
3.9. The "ZigZag" construction on the main chart
The next kind of supplement to the indicator is the "ZigZag" charting function or "func_draw_zig_zag".
The input parameters: the drawing way (on the maximum or the minimum prices, or on the chart points), the line width, the upward or downward line color.
The "zig_zag_shadow" parameter change can be seen in the 4 picture. If "true" is switched on, the indicator draws the "ZigZag" lines on the shadow points (minimum and maximum prices), in the "false" option, the "ZigZag" lines are drawn on the "Renko" maximum and minimum points.
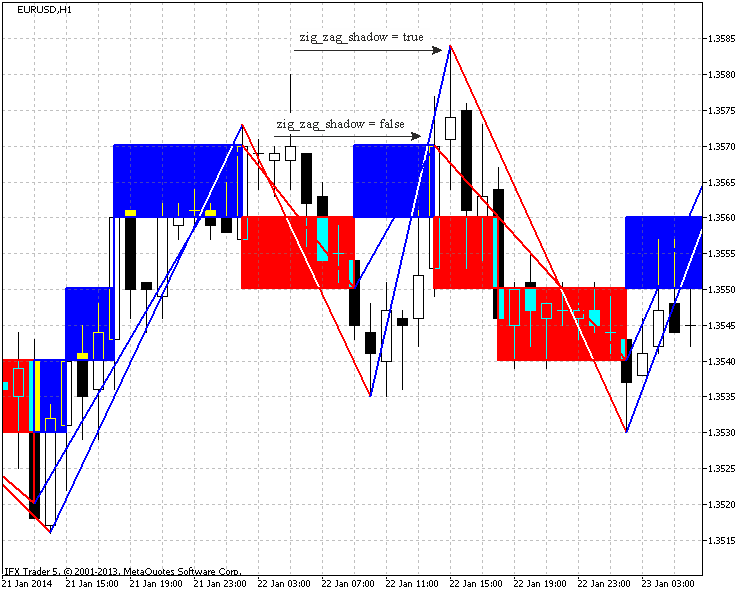
Fig.4. The impact of the "zig_zag_shadow" parameter on EURUSD, H1, 10 points.
To construct the "trend line" object two points (starting and ending) are required, enter two variables for the price parameter and two variables for the date parameter. If conditional statements set the first point depending on the initial brick type.
The loop which constructs all objects launches. As you can see, the loop launches from the second brick analysis, as the first point is already set. Then the if conditional statement checks the type of the brick (the price behaviour). The variable of the object name is filled and, depending on the move change, the loop splits. In turn, depending on the drawing method it is divided into two variants.
If it is displayed on the minimum and maximum prices, the Price_high[] and Price_low[] data arrays search close minimum and maximum points. The search is restricted with the near bars.
If it is graduated on the chart points, the data is assigned from the buffers arrays.
The "trend line" constructing function is called. The function finishes analysing and charting of the "ZigZag".
//+------------------------------------------------------------------+
//| Func Draw Zig Zag                                                |
//+------------------------------------------------------------------+
void func_draw_zig_zag(bool price_shadow,
                       int line_width,
                       color line_color_up,
                       color line_color_down)
  {
   double price_1=0;
   double price_2=0;
   datetime date_1=0;
   datetime date_2=0;

   if(type_box[1]==1)price_1=down_price[1];
   if(type_box[1]==-1)price_1=up_price[1];
   date_1=time_box[1];
   int id=0; //  Low & High array storing variable
   int n=0;  // variable for name forming

   string name_line; //--- variable responsible for the "trend line" name

   for(int z=2; z<=a; z++)
     {
      if(type_box[z]!=type_box[z-1])
        {
         n++;
         name_line=IntegerToString(magic_numb)+"_Line_"+IntegerToString(n);
         if(type_box[z]==1)
           {
            if(price_shadow==true)
              {
               id=number_id[z-1];
               if((id-1)>0 && Price_low[id-1]<Price_low[id])id--;
               if(Price_low[id+1]<Price_low[id])id++;
               price_2=Price_low[id];
               date_2=(datetime)Date[id];
              }
            else
              {
               price_2=down_price[z-1];
               date_2=time_box[z-1];
              }
            func_create_trend_line(name_line,price_1,price_2,date_1,date_2,line_width,line_color_down);
            price_1=price_2;
            date_1=date_2;
           }
         if(type_box[z]==-1)
           {
            if(price_shadow==true)
              {
               id=number_id[z-1];
               if((id-1)>0 && Price_high[id-1]>Price_high[id])id--;
               if(Price_high[id+1]>Price_high[id])id++;
               price_2=Price_high[id];
               date_2=(datetime)Date[id];
              }
            else
              {
               price_2=up_price[z-1];
               date_2=time_box[z-1];
              }
            func_create_trend_line(name_line,price_1,price_2,date_1,date_2,line_width,line_color_up);
            price_1=price_2;
            date_1=date_2;
           }
        }
     }
  }
3.10. Deleting previously created graphical objects
The magic number is used to determine the indicator's objects. It simplifies launching of several indicators on the one chart and objects deleting process.
The next function is the function for deleting objects or the "func_delete_objects". The name (set depending on the objects: trend line or rectangle) and the number of objects are two input parameters. The function chooses the objects and deletes the objects with already assigned name.
//+------------------------------------------------------------------+
//| Func Delete Objects                                              |
//+------------------------------------------------------------------+
void func_delete_objects(string name,
                         int number)
  {
   string name_del;
   for(int x=0; x<=number; x++)
     {
      name_del=name+IntegerToString(x);
      ObjectDelete(0,name_del);
     }
  }
The function consolidating all functions for deleting all indicator objects was created.
//+------------------------------------------------------------------+
//| Func All Delete                                                  |
//+------------------------------------------------------------------+
void func_all_delete()
  {
//--- the graphical objects calculating
   obj=ObjectsTotal(0,-1,-1);
//--- all indicator graphical objects deleting
   func_delete_objects(IntegerToString(magic_numb)+"_Line_",obj);
   func_delete_objects(IntegerToString(magic_numb)+"_Square_",obj);
   func_delete_objects(IntegerToString(magic_numb)+"_Frame_",obj);
//--- the chart redrawing
   ChartRedraw(0);
  }
3.11. Function for levels creation
The "func_create_levels" function for level creation simplifies the chart display in the indicator window. It has only two input parameters: number of created levels and their color.
In the body of the function the IndicatorSetInteger is used to set the number of displayed levels, then price and color are set for each level.
//+------------------------------------------------------------------+
//| Func Create Levels                                               |
//+------------------------------------------------------------------+
void func_create_levels(int level_number,
                        color level_color)
  {
//--- set the number of levels in the indicator window
   IndicatorSetInteger(INDICATOR_LEVELS,level_number);
 which brick is taken to draw levels
   int k=0;
   if(a>level_number)k=a-level_number;
//--- set levels prices
   for(int z=0;(z<=level_number && k<=a); z++,k++)
     {
      IndicatorSetDouble(INDICATOR_LEVELVALUE,z,up_price[k]);
      IndicatorSetInteger(INDICATOR_LEVELCOLOR,z,level_color);
     }
  }
3.12. The consolidation function
The "func_consolidation" function was created to consolidate all functions.
The function calls all the executed functions.
//+------------------------------------------------------------------+
//| Func Consolidation                                               |
//+------------------------------------------------------------------+
void func_concolidation()
  {
//--- deleting all the graphical objects of the indicator
   func_all_delete();
//--- the current date
   date_stop=TimeCurrent();
//--- the initial date changing due to the restricted buffer size
   if((bars=Bars(_Symbol,time_frame,date_start,date_stop))>ArraySize(Price))
     {
      date_start=func_calc_date_start(date_start,date_stop);
      Alert("The initial date was changed due to the lack of the chart size");
      date_change=true;
      //--- calculation of bars on the taken timeframe
      bars=Bars(_Symbol,time_frame,date_start,date_stop);
     }
//---
   bool result_copy_price=func_copy_price(Price,time_frame,date_start,date_stop,type_price);
   bool result_copy_date=func_copy_date(Date,time_frame,date_start,date_stop);
//--- change the date parameter
   if(result_copy_price=true && result_copy_date==true)date_change=false;
//---
   if(zig_zag_shadow==true)
     {
      func_copy_price(Price_high,time_frame,date_start,date_stop,2);
      func_copy_price(Price_low,time_frame,date_start,date_stop,3);
     }
//---
   func_draw_renko(Price,Date,filter_number,shadow_print,type_step,step);
   if(zig_zag==true)func_draw_zig_zag(zig_zag_shadow,zig_zag_width,zig_zag_color_up,zig_zag_color_down);
//---
   func_draw_renko_main_chart(square_color_up,square_color_down,frame_color_up,frame_color_down,square_width,frame_width,square_draw,square_fill,frame_draw);
   func_create_levels(levels_number,levels_color);
//--- redraw the chart
   ChartRedraw(0);
  }
3.13. OnCalculate() and OnChartEvent() functions
Before proceeding to the OnCalculate()function, let's take a look at the "func_new_bar" function which analyses the new bar.
It is the simplified function described in the IsNewBar.
//+------------------------------------------------------------------+
//| Func New Bar                                                     |
//+------------------------------------------------------------------+
bool func_new_bar(ENUM_TIMEFRAMES period_time)
  {
//---
   static datetime old_times; // array for storing old values
   bool res=false;            // analysis result variable
   datetime new_time[1];      // new bar time
//---
   int copied=CopyTime(_Symbol,period_time,0,1,new_time); // copy the time of the new bar into the new_time box
//---
   if(copied>0) // все ок. data have been copied
     {
      if(old_times!=new_time[0])    // if the bar's old time is not equal to new one
        {
         if(old_times!=0) res=true; // if it is not the first launch, true = new bar
         old_times=new_time[0];     // store the bar's time
        }
     }
//---
   return(res);
  }
The OnCalculate() function launches consolidation of all functions if a new bar is created during the chart updating.
//+------------------------------------------------------------------+
//| Custom indicator iteration function                              |
//+------------------------------------------------------------------+
int OnCalculate(const int rates_total,
                const int prev_calculated,
                const int begin,
                const double &price[])
  {
//---
   if(func_new_bar(time_redraw)==true)
     {
      func_concolidation();
     }
//--- return value of prev_calculated for next call
   return(rates_total);
  }
The OnChartEvent() function deletes all graphical objects by pressing "C", pressing "R" launches the chart redrawing (the consolidation function).
//+------------------------------------------------------------------+
//| OnChartEvent                                                     |
//+------------------------------------------------------------------+
void OnChartEvent(const int id,         // event ID
                  const long& lparam,   // long type event parameter
                  const double& dparam, // double type event parameter
                  const string& sparam) // string type event parameter
  {
//--- Keyboard button pressing event
   if(id==CHARTEVENT_KEYDOWN)
     {
      if(lparam==82) //--- "R" key has been pressed
        {
         //--- call of the consolidation function
         func_concolidation();
        }
      if(lparam==67) //--- "C" key has been pressed
        {
         //--- deletion of all objects of the indicator
         func_all_delete();
        }
     }
  }
3.14. OnDeinit() Function
And, finally, the OnDeinit()function. This function launches the function for deleting all graphical objects of the indicator.
//+------------------------------------------------------------------+
//| Custom indicator deinitialization function                       |
//+------------------------------------------------------------------+
void OnDeinit(const int reason)
  {
//--- delete all graphical objects of the indicator
   func_all_delete();
  }
4. Using Renko chart in practice
Renko chart is built according to the price movements strategy.
Let's start with the most popular strategy: sell when the moving upwards brick starts moving downwards and buy in the opposite case.
This is shown in Fig. 5:
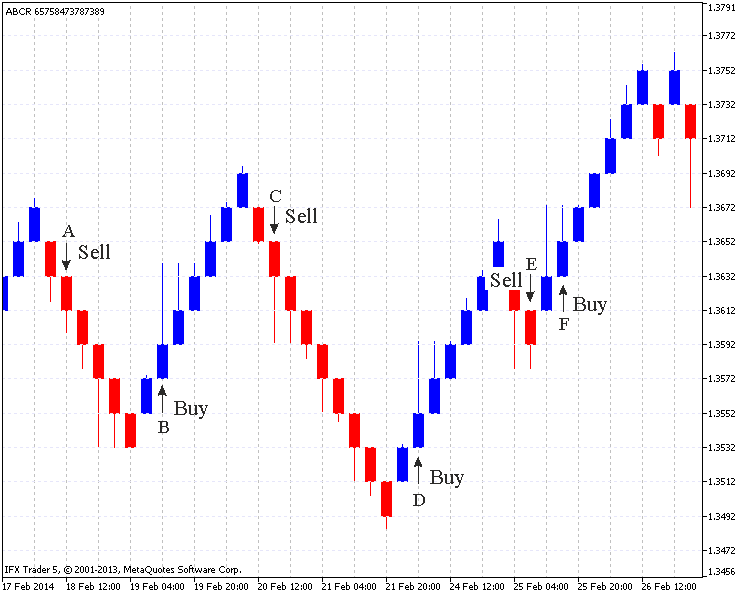
Fig.5. Standard Renko chart (EURUSD H4, 20 points)
The Fig. 5 shows six points (A,B,C,D,E,F) of the market entrance.
In the "A" point the upward brick changes to the downward brick.
The reversed brick as in (B,C,D) points is created with one movement. However, on the "E" point two bricks were created with one movement as to the down shadows are created at the same level.
In this case the entrance is possible between "E" and "F" points. It is not a successful entrance, as the price moves in an opposite direction, the analogical situation is on the "F" point: where one movement creates two bricks as well. The up shadows are at the same level. Although with a strong movement the price doesn't change its direction.
The implication is that the most favorable entrance to the market is when one reversal brick (look at the shadows) is created with one movement. If we two bricks are created at a time, this entrance may be unsafe.
The "ZigZag" graduating at this chart may be used for the graphical analysis. The Fig. 6 shows few examples: the "support" and "resistance" lines, the "head and shoulders" model setting.
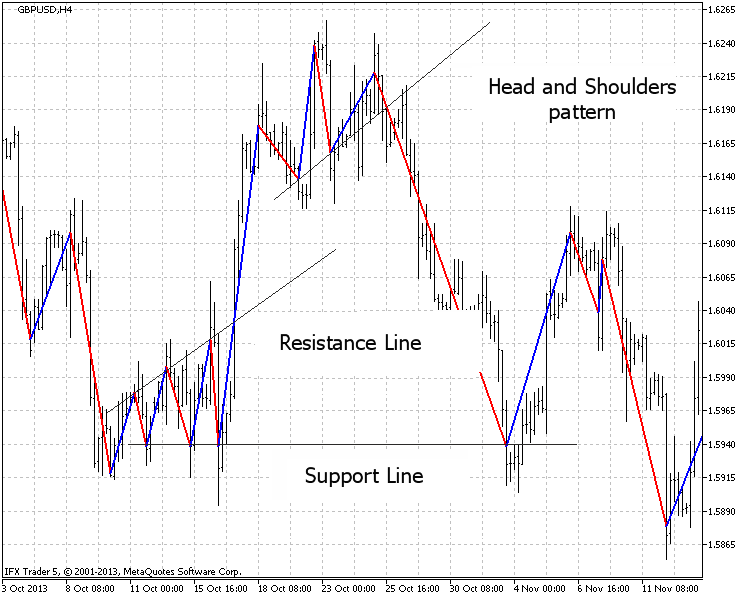
Fig.6. The graphical analysis (GBPUSD H4, 20 points)
The "Equidistant channel" graphical analysis is shown in the Fig. 7.
The indicator is set to analyze timeframe and the graduation is displayed on the fourhour timeframe.
Such settings let the custom follow signals at the several timeframes simultaneously, which means one indicator can be used on the one timeframe and the other on the second.
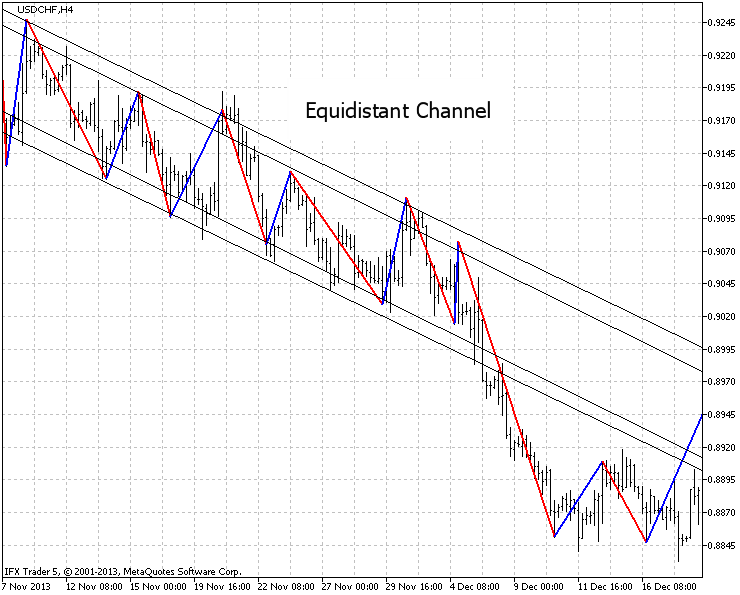
Fig.7. Analyzis of the "Equidistant channel" USDCHF, H4, settings on H1, 20 points.
Fig. 8 represents one more example of different timeframes on one chart.
The time chart shows the possible close reversals, the fourhour chart deletes useless signals, the daily chart approves long duration of the tendencies movements.
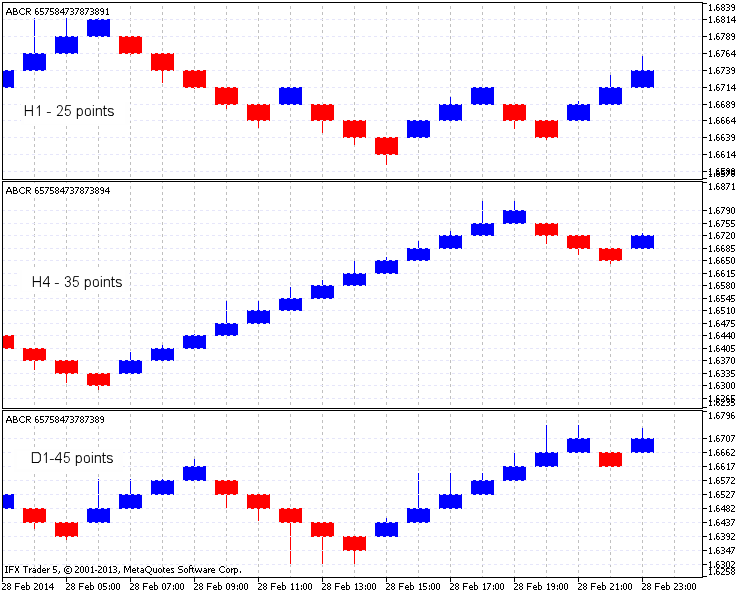
Fig.8. The Renko indicator on GBPUSD, H1, H4 and D1
One more example of indicator is in the Fig. 9. The rule says: build the upward line between the closest red bricks with at least one blue brick between them and sell after the brick is created under the line.
And the opposite: build the downward line between the closest blue bricks with at least one red brick between them and sell after the brick is created above the line.
Colors are mentioned according to the Fig. 9. Fig. 9. Blue and red arrows mark the line drawing places and big arrows mark signals for selling and buying.
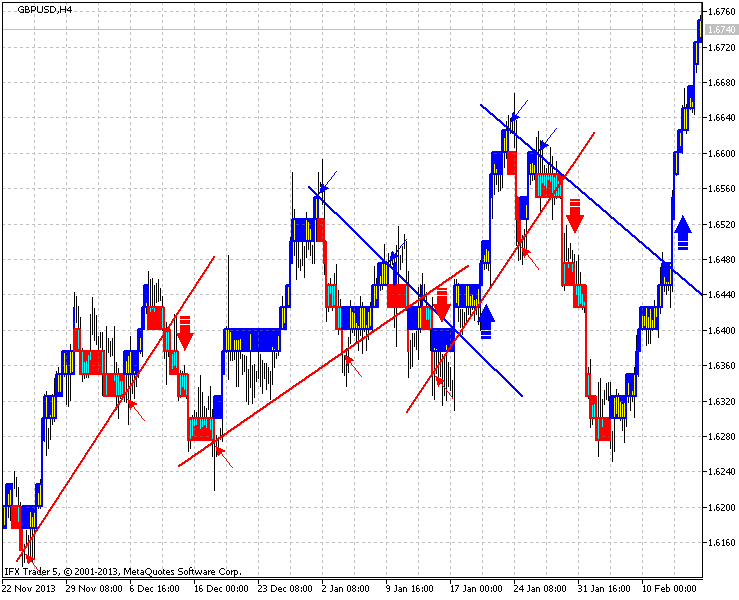
Fig.9. An example of GBPUSD, H4, 25 points indicator
Conclusion
The Renko chart is interesting for the beginners and professional traders. Many years have passed, however, it is still used in the markets.
In this article I wanted to draw your attention towards the chart and to improve the Renko chart analysis. I tried to show the detailed method of the Renko chart construction.
I will be glad to consider new ideas and improvements for the indicator and, perhaps, implement them in the future. There are several ways of the indicator implementation, you may find your methods of its implementation as well.
Thank you for your interest! I wish you successful trading and new trade strategy implementation.
Translated from Russian by MetaQuotes Ltd.
Original article: https://www.mql5.com/ru/articles/792
 Continuous futures contracts in MetaTrader 5
 Why Is It Important to Update MetaTrader 4 to the Latest Build by August 1?
- Free trading apps
- Over 8,000 signals for copying
- Economic news for exploring financial markets
You agree to website policy and terms of use
Dear Dmitry
Thank you for your Great indicator, we really need it on MT5
I wanted to do the same as Wiesehofer, but still don't have no DATA Window for iCustom
I also tried for hours and added a new buffer (BoxesBuffer) and copied RENKO_color[] without any result
Thank you for your time and help
Maybe You use this code:
This code send the signal (Alert), every time, when color is changes.
I had small time for work on this code, I hope there are no errors.
Thank You...
Hello!
Oups :( Just realized that the indicator repaint :(