
The ZigZag Indicator: Fresh Approach and New Solutions

Introduction
Every trader surely knows the ZigZag indicator intended for the analysis of price movements of given or greater amplitude. A ZigZag line is a broken line whose nodes are located at highs and lows of the price chart.
There are many variations of this indicator: 1, 2, 3, 4, 5, 6, 7, 8, 9, 10, 11, 12, 13, 14, 15, 16. Yet, a lot of MQL5 program developers are keen on creating their own 'ideal' ZigZag. The main downsides of the ZigZag indicator are delays, incorrect markings of questionable nodes (external bar) and unsatisfactory performance.
In my opinion, the most elegant ZigZag implementation was proposed by Yuri Kulikov (Yurich). Besides, there are some very good MQL4 articles, such as "Layman's Notes: ZigZag..." and "Show Must Go On, or Once Again about ZigZag". The subject seems to have been substantially explored, with a great number of publications being available. Yet there is something magnetizing about it. Now, it has also caught my interest, particularly in the possibility of creating an advanced ZigZag indicator.
This article describes a method for creating an advanced ZigZag using the Envelopes indicator. It is assumed that we can find a certain combination of input parameters for a series of Envelopes, whereby most ZigZag nodes lie within the confines of the Envelopes bands.
A Method for Creating an Advanced ZigZag Indicator
We will set an objective: to find coordinates of two nodes - the current and the predicted node (Fig. 1). The current node is a node that is not yet completed whose coordinates are still being searched for or adjusted. Moreover, it is always on the current (zero) bar. While being in the future, a predicted node must show the estimated level of the next ZigZag node.

Fig. 1. Predicting new ZigZag nodes: the current node and the next node.
So the objective is set and we have an idea of how to use Moving Average Envelopes as a basis for building an advanced indicator (Fig. 2). We will search for envelopes whose deviation from ZigZag nodes is minimal. It appears quite logical that envelopes for ZigZag peaks and troughs must be searched separately.

Fig. 2. ZigZag indicators and Moving Average Envelopes.
To increase the statistical significance of the forecast, instead of using only one or even 10 Envelopes indicators, we should use a pool of 100 or more indicators with different input data. They will differ in averaging period of the main indicator line and the price used (High for peaks and Low for troughs). Let's introduce the following notations and formulas:
- ZZ - the ZigZag indicator;
- ENV - the main line of the Envelopes indicator (coincides with the iMA indicator);
- Envelopes(i) - value of the main line of the Envelopes indicator on the i'th bar;
- ZZ(High) - ZigZag peak value;
- ZZ(Low) - ZigZag trough value;
- ENV(High) - value of the main line of the Envelopes indicator corresponding to a ZigZag peak;
- ENV(Low) - value of the main line of the Envelopes indicator corresponding to a ZigZag trough;
- n_high - number of ZigZag peaks;
- n_low - number of ZigZag troughs.
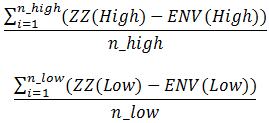
We have two indicator pools: one for peaks and the other one for troughs (around 100 indicators in each one). We will calculate the deviation of ZigZag nodes from the main line of the Envelopes indicator for each indicator in the pool and find the arithmetic mean of deviations for each pool indicator using the above formulas. The following figure demonstrates a diagram of deviations with respect to the identified nodes ZZ from the main line ENV for one indicator.

Fig. 3. Diagram of deviations of ZZ nodes from ENV.
The arithmetic mean of the deviations will be used for determining the level to which the main line of the Envelopes indicator should be moved to plot the envelope bands. So, we will need the arithmetic mean of deviations from ZigZag peaks to draw the upper line and the arithmetic mean of deviations from troughs to draw the lower line of the Envelopes indicator.
It is upper and lower lines of envelopes that we are going to use to find characteristic points and predict ZigZag nodes. Once again, we are interested in the pool of envelopes consisting of a set of the Envelopes indicators. The arithmetic mean of deviations of ZigZag nodes from the main line of a given envelope is calculated for each indicator. After plotting the resulting lines (the upper and lower line) of the pool in the chart, we will be able to see the following:

Fig. 4. The Envelopes lines on the plane.
If we assume that each line lies on a separate plane, while all of them together create a surface, the above figure only shows the projection of each indicator on the price chart plane. A 3D image of these lines will be roughly as follows:

Fig. 5. The Envelopes lines in 3D.
Let's now have a quick lesson in geometry. Imagine that the pool of lines of the Envelopes indicator is a 3D surface. Take a plane perpendicular to the price chart and cut the surface at the current (zero) bar.
As a result, we get a cross-section of the surface representing a curve (the above figures demonstrate a special case where the curve is a straight line). To do the forecast, it is sufficient to have the coordinates of each point on the curve that will further be used in calculations.
We will need the following cross-section characteristics: maximum and minimum point, as well as the center of gravity of the cross-section (the arithmetic mean of all point values). The obtained characteristic points will be projected on the current (zero) bar, with the relevant data being stored in the history. These characteristic points will serve as the basis for the current and the next ZigZag nodes.
Since the search for Envelope bands is performed separately for peaks and troughs, as a result we should get two cross-sections: one for peaks and the other one for troughs.
To get the forecast, we will use the nearest characteristic point. For example, when searching for a ZigZag peak, we take the characteristic points of the cross-section resulting from the intersection of the surface of the upper lines of the Envelopes indicator with a cutting plane. Conversely, to find a trough we take the characteristic points of the cross-section resulting from the intersection of the surface of the lower lines of the Envelopes indicator with a cutting plane.
Testing New Indicator
Now that we have defined the method, let's create the indicator. We will first find the last nodes of the ZigZag indicator and draw them in the chart. For this purpose, we will use the AdvancedZigZag class written for the task at hand:
//+------------------------------------------------------------------+
//|                                               AdvancedZigZag.mqh |
//|                                           Copyright 2013, DC2008 |
//|                           https://www.mql5.com/ru/users/DC2008 |
//+------------------------------------------------------------------+
#property copyright "Copyright 2013, DC2008"
#property link      "https://www.mql5.com/ru/users/DC2008"
#property version   "1.00"
//+------------------------------------------------------------------+
//|                                                 GetExtremums.mqh |
//+------------------------------------------------------------------+
#include <GetExtremums.mqh>   // author of the code Yurich
#property copyright "Copyright 2012, Yurich"
#property link      "https://www.mql5.com/ru/users/Yurich"
//+------------------------------------------------------------------+
//| ZigZag node structure                                            |
//+------------------------------------------------------------------+
struct MqlZigZag
  {
   double            price;   // Node coordinate
   datetime          t;       // Time
  };
//+------------------------------------------------------------------+
//| The AdvancedZigZag class                                         |
//+------------------------------------------------------------------+
class AdvancedZigZag
  {
private:
   MqlRates          rt[];
   dextremum         zz[];
   int               history;
   double            amplitude;
public:
   dextremum         zHL[];
   MqlZigZag         zzH[],zzL[];
   int               Count(const double range);
   int               Read(const int nodes);
                     AdvancedZigZag(const int bars);
                    ~AdvancedZigZag();
  };
//+------------------------------------------------------------------+
//| Class constructor                                                |
//+------------------------------------------------------------------+
AdvancedZigZag::AdvancedZigZag(const int bars)
  {
   history=bars;
   amplitude=0;
  }
//+------------------------------------------------------------------+
//| The Read method of the class                                     |
//+------------------------------------------------------------------+
int AdvancedZigZag::Read(const int nodes)
  {
   CopyRates(NULL,0,TimeCurrent(),history,rt);
   int cnt=GetExtremums(amplitude,rt,zHL,nodes);
   return(cnt);
  }
//+------------------------------------------------------------------+
//| The Count method of the class                                    |
//+------------------------------------------------------------------+
int AdvancedZigZag::Count(const double range)
  {
   amplitude=range;
   CopyRates(NULL,0,TimeCurrent(),history,rt);
   int cnt=GetExtremums(amplitude,rt,zz);
   ArrayResize(zzH,cnt);
   ArrayResize(zzL,cnt);
   int h=0;
   int l=0;
   for(int i=0; i<cnt; i++)
     {
      if(zz[i].type>0)
        {
         zzH[h]=(MqlZigZag)zz[i];
         h++;
        }
      else
        {
         zzL[l]=(MqlZigZag)zz[i];
         l++;
        }
     }
   ArrayResize(zzH,h);
   ArrayResize(zzL,l);
   return(cnt);
  }
//+------------------------------------------------------------------+
//|                                                                  |
//+------------------------------------------------------------------+
AdvancedZigZag::~AdvancedZigZag()
  {
  }
There are two methods in total:
- The Count method finds all ZigZag nodes over a given time period (number of bars) and saves them in various arrays, separating peaks from troughs. This way it will be easier to do the analysis and calculation of the envelopes;
- The Read method finds the last nodes and saves them in a single array. We need this method for the ZigZag indicator visualization;
TheGetExtremums library (by Yury Kulikov) will also be necessary in searching for nodes.
Let's put the indicator under consideration in an Expert Advisor. Why an Expert Advisor and not an indicator? This is of course a matter of taste but it appears to be more efficient to me that way. Expert Advisor's graphical features are undoubtedly weaker but we gain in performance since same-symbol indicators operate in a single stream, while every EA operates in its own separate stream. Let's take a look at the code:
//+------------------------------------------------------------------+
//|                                                   two_Comets.mq5 |
//|                                           Copyright 2013, DC2008 |
//|                           https://www.mql5.com/ru/users/DC2008 |
//+------------------------------------------------------------------+
#property copyright "Copyright 2013, DC2008"
#property link      "https://www.mql5.com/ru/users/DC2008"
#property version   "1.00"
#include <AdvancedZigZag.mqh>
//--- Depth of history for the indicator calculation
input int      depth_stories=5000;  // Depth stories for calculating the indicator [bars]
//--- Minimum ZigZag amplitude value
input int      amplitude=100;        // The minimum value of the amplitude of the indicator [points]
//--- Declaring the class
AdvancedZigZag Azz(depth_stories);
//---
#define NUMBER_MA   227
#define START_MA    5
//--- macros
#define SIZE(i)                     (double)i*0.3<1?1:(int)(i*0.25)
#define ObjF1                       ObjectSetString(0,name,OBJPROP_FONT,"Wingdings")
#define ObjF2                       ObjectSetInteger(0,name,OBJPROP_ANCHOR,ANCHOR_CENTER)
#define ObjF3(T)                    ObjectSetInteger(0,name,OBJPROP_TIME,T)
#define ObjF4(P)                    ObjectSetDouble(0,name,OBJPROP_PRICE,P)
#define ObjF5(size)                 ObjectSetInteger(0,name,OBJPROP_FONTSIZE,size)
#define ObjF6(code)                 ObjectSetString(0,name,OBJPROP_TEXT,CharToString(code))
#define ObjF7(clr)                  ObjectSetInteger(0,name,OBJPROP_COLOR,clr)
#define ObjF8                       ObjectSetInteger(0,name,OBJPROP_COLOR,clrMagenta)
#define ObjF9                       ObjectSetInteger(0,name,OBJPROP_WIDTH,3)
#define ObjF10                      ObjectSetInteger(0,name,OBJPROP_BACK,true)
#define ObjFont                     ObjF1;ObjF2;
#define ObjCoordinates(T,P)         ObjF3(T);ObjF4(P);
#define ObjProperty(size,code,clr)  ObjF5(size);ObjF6(code);ObjF7(clr);
#define ObjZZ                       ObjF8;ObjF9;ObjF10;
//---
double      MA[1],sumHi[NUMBER_MA],sumLo[NUMBER_MA];
int         handle_MA_H[NUMBER_MA],handle_MA_L[NUMBER_MA];
datetime    t[1];
int         H,L;
int         t_min,t_max;
int         err=-1;
double      sumH[2],maxH[2],minH[2];
double      sumL[2],maxL[2],minL[2];
string      name;
int         count;
int         shift;
//+------------------------------------------------------------------+
//| Expert initialization function                                   |
//+------------------------------------------------------------------+
int OnInit()
  {
   shift=PeriodSeconds()/30;
//--- calculation of ZigZag nodes using historical data
   Azz.Count(amplitude*Point());
   H=ArraySize(Azz.zzH);
   L=ArraySize(Azz.zzL);
   if(H<30 || L<30)
     {
      Print("Not enough data to calculate ZigZag nodes: "+
            "increase the depth of history; "+
            "or decrease the amplitude value.");
      return(-1);
     }
//---
   for(int i=0; i<NUMBER_MA; i++)
     {
      handle_MA_H[i]=iMA(NULL,0,i+START_MA,0,MODE_SMA,PRICE_HIGH);
      handle_MA_L[i]=iMA(NULL,0,i+START_MA,0,MODE_SMA,PRICE_LOW);
     }
//---
   return(0);
  }
//+------------------------------------------------------------------+
//| Expert deinitialization function                                 |
//+------------------------------------------------------------------+
void OnDeinit(const int reason)
  {
   ObjectsDeleteAll(0,-1,-1);
   for(int i=0; i<NUMBER_MA; i++)
     {
      IndicatorRelease(handle_MA_H[i]);
      IndicatorRelease(handle_MA_L[i]);
     }
//---
  }
//+------------------------------------------------------------------+
//| Expert tick function                                             |
//+------------------------------------------------------------------+

void OnTick()
  {
//--- get the current bar's opening time value
   CopyTime(NULL,0,0,1,t);
//--- ZigZag: last 7 nodes
   count=Azz.Read(7);
   for(int i=1; i<count; i++)
     {
      name="ZZ"+(string)i;
      ObjectCreate(0,name,OBJ_TREND,0,0,0);
      ObjectSetInteger(0,name,OBJPROP_COLOR,clrRed);
      ObjectSetInteger(0,name,OBJPROP_WIDTH,10);
      ObjectSetInteger(0,name,OBJPROP_BACK,true);
      ObjectSetDouble(0,name,OBJPROP_PRICE,0,Azz.zHL[i-1].value);
      ObjectSetInteger(0,name,OBJPROP_TIME,0,Azz.zHL[i-1].time);
      ObjectSetDouble(0,name,OBJPROP_PRICE,1,Azz.zHL[i].value);
      ObjectSetInteger(0,name,OBJPROP_TIME,1,Azz.zHL[i].time);
     }
//--- check for integrity of preliminary calculations
   if(err<0)
     {
      //--- calculate the sums of deviations of the nodes from MA for ZigZag peaks
      ArrayInitialize(sumHi,0.0);
      for(int j=H-1; j>=0; j--)
        {
         for(int i=0; i<NUMBER_MA; i++)
           {
            err=CopyBuffer(handle_MA_H[i],0,Azz.zzH[j].t,1,MA);
            if(err<0) return;
            sumHi[i]+=Azz.zzH[j].price-MA[0];
           }
        }
      //--- calculate the sums of deviations of the nodes from MA for ZigZag troughs
      ArrayInitialize(sumLo,0.0);
      for(int j=L-1; j>=0; j--)
        {
         for(int i=0; i<NUMBER_MA; i++)
           {
            err=CopyBuffer(handle_MA_L[i],0,Azz.zzL[j].t,1,MA);
            if(err<0) return;
            sumLo[i]+=MA[0]-Azz.zzL[j].price;
           }
        }
     }
  }
//+------------------------------------------------------------------+
We need to clarify a few things here:
- The iEnvelopes indicator is replaced by the iMA indicator. There is nothing false or misleading in it. The thing is that the main line of iEnvelopes coincides with iMA! It is therefore more convenient to use the Moving Average indicator.
- We use two pools of moving averages, consisting of 227 lines each, thus making 454 iMA indicators in total! Is it much or little? Basically, it is a big number. But, first of all, we can change the number of indicators, if necessary, and secondly, we need statistics. What is the point in searching envelopes for a dozen nodes? We need at least a hundred.
- Indicator values are loaded in the OnTick() block instead of OnInit(). If the data loading block is placed in OnInit(), it is very likely that some data may be late to load and the indicators will as a result not be calculated accurately and in full. After all the data for the calculations is obtained, the err variable value will get positive and this block will be excluded from operation.
So, the resulting indicator plots the last seven ZigZag nodes and calculates the coordinates of all other nodes over a given history (Fig. 6). The calculation is only performed once and we further use the calculated data. You can of course implement it in such a way so as to allow the data to be updated regularly but in this article we will keep it to a single pass.
")
Fig. 6. The ZigZag indicator (7 nodes).
Further, let's plot the cross-sections of the surfaces of the Envelopes indicators. To do this, we will add the following to the OnTick() method:
//--- PEAKS
   sumH[0]=0.0;
   maxH[0]=0.0;
   minH[0]=0.0;
   for(int i=0; i<NUMBER_MA; i++)
     {
      CopyBuffer(handle_MA_H[i],0,t[0],1,MA);
      double envelope=MA[0]+sumHi[i]/H;
      if(i==0 || envelope<minH[0])
        {
         minH[0]=envelope;
         t_min=SIZE(i);
        }
      if(envelope>maxH[0])
        {
         maxH[0]=envelope;
         t_max=SIZE(i);
        }
      sumH[0]+=envelope;
      name="H"+(string)i;
      ObjectCreate(0,name,OBJ_TEXT,0,0,0);
      ObjFont
      ObjCoordinates(t[0]-(NUMBER_MA-i*2)*shift,envelope)
      ObjProperty(SIZE(i),158,clrBlue)
     }
//--- TROUGHS
   sumL[0]=0.0;
   maxL[0]=0.0;
   minL[0]=0.0;
   for(int i=0; i<NUMBER_MA; i++)
     {
      CopyBuffer(handle_MA_L[i],0,t[0],1,MA);
      double envelope=MA[0]-sumLo[i]/L;
      if(i==0 || envelope<minL[0])
        {
         minL[0]=envelope;
         t_min=SIZE(i);
        }
      if(envelope>maxL[0])
        {
         maxL[0]=envelope;
         t_max=SIZE(i);
        }
      sumL[0]+=envelope;
      name="L"+(string)i;
      ObjectCreate(0,name,OBJ_TEXT,0,0,0);
      ObjFont
      ObjCoordinates(t[0]+(NUMBER_MA-i*2)*shift,envelope)
      ObjProperty(SIZE(i),158,clrGold)
     }
To discern the cross-section points of the surface formed by the envelopes lines, the points vary in size: the greater the averaging period of the main line of the Envelopes indicators, the larger the points (Fig. 7). Moreover, the cross-sections are rotated around a vertical axis passing through the current (zero) bar in different directions: peaks are at 90 degrees to the right and troughs are at 90 degrees to the left.
Now they can be seen in the price chart plane. Initially, they were lying in the cutting plane (Fig. 5) and could not be observed. We could only picture them to ourselves, without having any idea about their shape. The cross-section lines have turned out to be of a very peculiar shape. This is also done for the convenience of graphic analysis. Visually the cross-sections resemble two flying comets:

Fig. 7. Cross-section of the Envelopes indicator pool.
Let's proceed to the calculation of the cross-section characteristics: the maximum and the minimum, as well the center of gravity (the arithmetic mean). The resulting values will be displayed as points on the current bar, with the point size corresponding to the size of the relevant characteristic. In addition, we will save them in the history for further analysis. So, we will add the following to the existing code:
//--- PEAKS

...

//--- midi
   string str=(string)t[0];
   name="Hmidi"+str;
   ObjectCreate(0,name,OBJ_TEXT,0,0,0);
   ObjFont
   ObjCoordinates(t[0],sumH[0]/NUMBER_MA)
   ObjProperty(10,119,clrBlue)
//--- max
   name="Hmax"+str;
   ObjectCreate(0,name,OBJ_TEXT,0,0,0);
   ObjFont
   ObjCoordinates(t[0],maxH[0])
   ObjProperty(t_max,158,clrBlue)
//--- min
   name="Hmin"+str;
   ObjectCreate(0,name,OBJ_TEXT,0,0,0);
   ObjFont
   ObjCoordinates(t[0],minH[0])
   ObjProperty(t_min,158,clrBlue)

...

//--- TROUGHS

...

//--- midi
   name="Lmidi"+str;
   ObjectCreate(0,name,OBJ_TEXT,0,0,0);
   ObjFont
   ObjCoordinates(t[0],sumL[0]/NUMBER_MA)
   ObjProperty(10,119,clrGold)
//--- max
   name="Lmax"+str;
   ObjectCreate(0,name,OBJ_TEXT,0,0,0);
   ObjFont
   ObjCoordinates(t[0],maxL[0])
   ObjProperty(t_max,158,clrGold)
//--- min
   name="Lmin"+str;
   ObjectCreate(0,name,OBJ_TEXT,0,0,0);
   ObjFont
   ObjCoordinates(t[0],minL[0])
   ObjProperty(t_min,158,clrGold)
Now let's see what it looks like when represented graphically:

Fig. 8. Cross-section characteristics: the maximum and the minimum, as well as the center of gravity plotted for peaks and troughs separately.
We just need to add the last finishing touch by finding and plotting advanced ZigZag nodes. We enhance the code by adding the following:
//--- ZigZag: advanced nodes
   if(Azz.zHL[0].type>0) // peak
     {
      ObjectDelete(0,"MIN");
      ObjectDelete(0,"MINfuture");
      name="MAX";
      ObjectCreate(0,name,OBJ_TREND,0,0,0);
      ObjZZ
      ObjectSetDouble(0,name,OBJPROP_PRICE,0,Azz.zHL[1].value);
      ObjectSetInteger(0,name,OBJPROP_TIME,0,Azz.zHL[1].time);
      ObjectSetInteger(0,name,OBJPROP_TIME,1,t[0]);
      double price=minH[0];
      ObjectSetDouble(0,name,OBJPROP_PRICE,1,price);
      if(Azz.zHL[0].value>minH[0])
        {
         price=sumH[0]/NUMBER_MA;
         ObjectSetDouble(0,name,OBJPROP_PRICE,1,price);
        }
      if(Azz.zHL[0].value>sumH[0]/NUMBER_MA)
        {
         price=maxH[0];
         ObjectSetDouble(0,name,OBJPROP_PRICE,1,price);
        }
      //--- into the future
      name="MAXfuture";
      ObjectCreate(0,name,OBJ_TREND,0,0,0);
      ObjZZ
      ObjectSetDouble(0,name,OBJPROP_PRICE,0,price);
      ObjectSetInteger(0,name,OBJPROP_TIME,0,t[0]);
      ObjectSetDouble(0,name,OBJPROP_PRICE,1,maxL[0]);
      ObjectSetInteger(0,name,OBJPROP_TIME,1,t[0]+NUMBER_MA*shift);
      if(price<maxL[0])
         ObjectSetDouble(0,name,OBJPROP_PRICE,1,sumL[0]/NUMBER_MA);
      if(price<sumL[0]/NUMBER_MA)
         ObjectSetDouble(0,name,OBJPROP_PRICE,1,minL[0]);
     }
   if(Azz.zHL[0].type<0) // trough
     {
      ObjectDelete(0,"MAX");
      ObjectDelete(0,"MAXfuture");
      name="MIN";
      ObjectCreate(0,name,OBJ_TREND,0,0,0);
      ObjZZ
      ObjectSetDouble(0,name,OBJPROP_PRICE,0,Azz.zHL[1].value);
      ObjectSetInteger(0,name,OBJPROP_TIME,0,Azz.zHL[1].time);
      ObjectSetInteger(0,name,OBJPROP_TIME,1,t[0]);
      double price=maxL[0];
      ObjectSetDouble(0,name,OBJPROP_PRICE,1,price);
      if(Azz.zHL[0].value<maxL[0])
        {
         price=sumL[0]/NUMBER_MA;
         ObjectSetDouble(0,name,OBJPROP_PRICE,1,price);
        }
      if(Azz.zHL[0].value<sumL[0]/NUMBER_MA)
        {
         price=minL[0];
         ObjectSetDouble(0,name,OBJPROP_PRICE,1,price);
        }
      //--- into the future
      name="MINfuture";
      ObjectCreate(0,name,OBJ_TREND,0,0,0);
      ObjZZ
      ObjectSetDouble(0,name,OBJPROP_PRICE,0,price);
      ObjectSetInteger(0,name,OBJPROP_TIME,0,t[0]);
      ObjectSetDouble(0,name,OBJPROP_PRICE,1,minH[0]);
      ObjectSetInteger(0,name,OBJPROP_TIME,1,t[0]+NUMBER_MA*shift);
      if(price>minH[0])
         ObjectSetDouble(0,name,OBJPROP_PRICE,1,sumH[0]/NUMBER_MA);
      if(price>sumH[0]/NUMBER_MA)
         ObjectSetDouble(0,name,OBJPROP_PRICE,1,maxH[0]);
     }
So, we have got the new advanced ZigZag indicator that predicts the position of new nodes (Fig. 9). The nodes themselves are located in the characteristic cross-section points: the maximum, the minimum and the center of gravity. The working title of the indicator is "Two Comets".
It should be noted that the completion time of the next node, which is in the future, has remained unknown. Basically, we can only predict one node coordinate - the price.

Fig. 9. The advanced ZigZag indicator predicts the nodes: the current and the next one.
Analysis of the Results and Recommendations for Developers
The indicator observations have shown that:
- Deviations of the ZigZag node coordinates from the predicted nodes are within the tolerance region. The vast number of nodes lies in the shadow of the corresponding cross-section. This is certainly just a qualitative assessment. More accurate results will follow in the future articles.
- Cross-sections of the envelopes lines demonstrate the market behavior and expected price momentum! Pay attention to the comet tail that is made up of points with the smallest averaging period (the smallest in size). It is directed in the direction of the price. The comet's tail bends in the most intricate ways and the more it is turned in the opposite direction, the bigger the chance to see the trend change. Simply watch the behavior of the indicator on different time frames with different amplitudes. This is extremely interesting!
- The characteristic points of cross-sections form lines that may exhibit strong resistance to the price movement. Therefore they can be considered as support and resistance lines.
- When the points of the center of gravity of the cross-section get ahead of it (as the peaks in Fig. 9), this is an indication of the presence of the upward trend.
So what we got as a result is a very interesting indicator that can be tried out in a trading strategy!
Conclusion
- The method for predicting ZigZag indicator nodes reviewed in the article allowed us to create the new indicator - "Two Comets".
- The advanced ZigZag shows possible coordinates of new nodes, even though this is only a forecast.
- The algorithm considered in the article can be used to plot similar advanced indicators, not necessarily being ZigZag indicators, e.g. fractals or semaphore indicators.
- Novice MQL5 programmers may find it interesting to see how they can create macros in their programs to reduce the amount of repeated code.
Translated from Russian by MetaQuotes Ltd.
Original article: https://www.mql5.com/ru/articles/646
- Free trading apps
- Over 8,000 signals for copying
- Economic news for exploring financial markets
You agree to website policy and terms of use
zzH[h]=(MqlZigZag)zz[i];
h++;
}
else
{
& nbsp; zzL[l]=(MqlZigZag)zz[i]; cannot cast 'dextremum' to 'MqlZigZag'
cannot cast 'dextremum' to 'MqlZigZag' AdvancedZigZag.mqh 74 17
cannot cast 'dextremum' to 'MqlZigZag' AdvancedZigZag. mqh 79 17
cannot be read
zzH[h]=(MqlZigZag)zz[i]; h++; } else { & nbsp; zzL[l]=(MqlZigZag)zz[i];
cannot cast 'dextremum' to 'MqlZigZag' AdvancedZigZag.mqh 74 17 cannot cast 'dextremum' to 'MqlZigZag' AdvancedZigZag.mqh 79 17 Cannot read
In order to fix MqlZigZag error change the file advancedzigzag.mqh as show below, the right file is attached.
In order to fix MqlZigZag error change the file advancedzigzag.mqh as show below, the right file is attached.
Thank you for the quick fix, Livio Alves.
@ Sergey Pavlov, you have opened up another dimension of coding to me. Thank you to the extent of that dimension!