
The Last Crusade
Introduction
There are three default means of instrument price presentation available in the МetaТrader 5 terminal (as well as in МetaТrader 4): bars, candlesticks and lines. Essentially, all of them represent the same - time charts. In addition to the traditional method of time-related price presentation, there still exist other non-time-related means that are quite popular with investors and speculators: Renko and Kagi charts, three line break and point and figure charts.
I will not assert their advantage over the classics but taking the time variable out of sight helps some traders to focus on the price variable. I suggest we consider here point and figure charts along with a relevant charting algorithm, have a look at well-known market products that serve to generate such charts and write a plain and simple script implementing the algorithm. A book by Thomas J. Dorsey "Point and Figure Charting: The Essential Application for Forecasting and Tracking Market Prices" will be our ABC book.
Bull's-Eye Broker is the most popular software package for drawing off-line charts. The software is available for 21 day trial (numerous trials possible) and the new Beta version is available during Beta period. This software package will be used to estimate our script performance results. One of the best on-line resources in terms of point and figure charting is StockCharts. The website is stock exchange oriented therefore it unfortunately does not provide Forex instruments prices.
To compare the performance results of the script we would introduce, Gold futures, Light Crude Oil futures and S&P 500 CFD charts will be generated using the software and the website; a EURUSD price chart will be drawn using Bull's-Eye Broker alone (remember the StockChart limitations).
Algorithm for Point and Figure Charting
So, here is the algorithm.
There are two key parameters in point and figure charting:
- Box size which is the minimum instrument price change; changes smaller than the minimum price change do not affect the chart;
- Reversal which is the number of boxes representing the price movement in the direction opposite to the current chart direction following which such movement will be displayed in the new column.
Since charting requires the history of quotes stored in the form of Open-High-Low-Close prices, we assume as follows:
- The chart is drawn based on High-Low prices;
- The High price is rounded down to the box size (MathFloor), the Low price is rounded up to the box size (MathCeil).
Let me give an example. Assume we want to draw a Light Crude Oil chart with a box size being equal to $1 (one) and a 3 (three) box reversal. This means that all High prices are rounded down to the nearest $1 and all Low prices are rounded up in the same manner:
| Date | High | Low | XO High | XO Low |
|---|---|---|---|---|
| 2012.02.13 | 100.86 | 99.08 | 100 | 100 |
| 2012.02.14 | 101.83 | 100.28 | 101 | 101 |
| 2012.02.15 | 102.53 | 100.62 | 102 | 101 |
| 2012.02.16 | 102.68 | 100.84 | 102 | 101 |
| 2012.02.17 | 103.95 | 102.24 | 103 | 102 |
X's (crosses) are used to illustrate an upward price movement on the chart, while O's (naughts) represent a falling price movement.
How to determine the initial direction of the price (whether the first column is X or O):
Keep in mind XO High and XO Low [Bars-1] values and wait until:
- XO Low value decreases by the reversal number of boxes as compared to the initial XO High (the first column is О); or
- XO High value increases by the reversal number of boxes as compared to the initial XO Low (the first column is Х).
In our Light Crude Oil example, we should keep in mind XO High[Bars-1]=100 and XO Low[Bars-1]=100.
Then wait to see what occurs earlier:
- XO Low[i] value of the next bar becomes less than or equal to $97 suggesting that the first column is O; or
- XO High[i] value of the next bar becomes greater than or equal to $103 suggesting that the first column is Х.
We can determine the first column on February 17: XO High price has reached $103 and the first column is X. Make it by drawing four X's from $100 to $103.
How to determine further chart movement:
If the current column is X, check if XO High of the current bar has increased by the box size in comparison to the current XO price (i.e. on February 20, we will first check if XO High is greater than or equal to $104). If XO High[2012.02.20] is $104 or $105 or higher, we will add the relevant number of X's to the existing column of X's.
If XO High of the current bar has not increased by the box size in comparison to the current XO price, check if XO Low of the current bar is less than XO High by the reversal number of boxes (in our example, if XO Low[2012.02.20] is less than or equal to $103-3*$1=$100, or $99 or less than that). If it is less, than we draw a column of O's to the right of the column of X's from $102 to $100.
In case the current column is O, all the above considerations shall apply vice versa.
IMPORTANT: every new column of O's is always drawn to the right of and one box lower than the High value of the preceding column of X's and every new column of X's is always drawn to the right of and one box higher than the Low value of the preceding column of O's.
The charting principles are now clear. Let us proceed to support and resistance lines.
Support and resistance lines in conventional point and figure charts are always angled at 45 degrees.
The first line depends on the first column. If the first column is X, the first line will be a resistance line starting one box higher than the first column maximum, angled at 45 degrees DOWN and to the right. If the first column is O, the first line will be a support line starting one box lower than the first column minimum, angled at 45 degrees UP and to the right. Support and resistance lines are drawn until they reach the price chart.
As soon as the support/resistance line reaches the price chart, we start drawing a resistance/support line, accordingly. When drawing, the key principle is to ensure that the plotted line is more to the right of the preceding trend line on the chart. Thus, to draw a support line, we first identify the minimum chart value under the resistance line we have just drawn and plot the support line starting one box lower than the identified minimum UP to the right until it reaches the chart or the last column of the chart.
If the support line drawn starting from the minimum under the preceding resistance line goes up and stumbles on the chart under the same resistance line, move to the right and find a new price minimum within the range from the lowest minimum under the resistance to the end of the resistance line. Continue until the trend line so drawn goes to the right, beyond the preceding trend line.
All of the above will be more clear when illustrated with real chart examples provided further below.
By now we have already sorted out the charting algorithm. Let us add a few neat features to our script:
- Mode selection: charting for a current symbol only or for all symbols in MarketWatch;
- Time frame selection (it appears more logical to draw charts of 100 pips on Daily time frames and charts of 1-3 pips on M1);
- Setting the box size in pips;
- Setting the number of boxes for reversal;
- Setting the number of characters to display volumes (in the script - tick volumes as I haven't come across brokers who supply real volumes) in columns and rows (like the MarketDepth indicator);
- Setting the history depth based on which the chart will be drawn;
- Selection of the output format - results can be saved as plain text files or image files;
- And finally, a feature for novices - autocharting (automatically sets the box size based on the required height of the chart).
Now that the descriptions of the algorithm and requirements have been given, it is high time to present the script.
//+------------------------------------------------------------------+ //| Point&Figure text charts | //| BSD Lic. 2012, Roman Rich | //| http://www.FXRays.info | //+------------------------------------------------------------------+ #property copyright "Roman Rich" #property link "http://www.FXRays.info" #property version "1.00" #property script_show_inputs #include "cIntBMP.mqh" // Include the file containing cIntBMP class input bool mw=true; // All MarketWatch? input ENUM_TIMEFRAMES tf=PERIOD_M1; // Time frame input long box=2; // Box size in pips (0 - auto) enum cChoice{c10=10,c25=25,c50=50,c100=100}; input cChoice count=c50; // Chart height in boxes for autocharting enum rChoice{Two=2,Three,Four,Five,Six,Seven}; input rChoice reverse=Five; // Number of boxes for reversal enum vChoice{v10=10,v25=25,v50=50}; input vChoice vd=v10; // Characters for displaying volumes enum dChoice{Little=15000,Middle=50000,Many=100000,Extremely=1000000}; input dChoice depth=Little; // History depth input bool pic=true; // Image file? input int cellsize=10; // Cell size in pixels //+------------------------------------------------------------------+ //| cIntBMP class descendant | //+------------------------------------------------------------------+ class cIntBMPEx : public cIntBMP { public: void Rectangle(int aX1,int aY1,int aSizeX,int aSizeY,int aColor); void Bar(int aX1,int aY1,int aSizeX,int aSizeY,int aColor); void LineH(int aX1,int aY1,int aSizeX,int aColor); void LineV(int aX1,int aY1,int aSizeY,int aColor); void DrawBar(int aX1,int aY1,int aX2,int aY2,int aColor); void TypeTextV(int aX,int aY,string aText,int aColor); }; cIntBMPEx bmp; // cIntBMPEx class instance uchar Mask_O[192]= // The naughts { 217,210,241,111,87,201,124,102,206,165,150,221,237,234,248,255,255,255,255,255,255,255,255,255, 73,42,187,137,117,211,201,192,235,140,120,212,60,27,182,178,165,226,255,255,255,255,255,255, 40,3,174,250,249,253,255,255,255,255,255,255,229,225,245,83,54,190,152,135,216,255,255,255, 68,36,185,229,225,245,255,255,255,255,255,255,255,255,255,247,246,252,78,48,188,201,192,235, 140,120,212,145,126,214,255,255,255,255,255,255,255,255,255,255,255,255,188,177,230,124,102,206, 237,234,248,58,24,181,209,201,238,255,255,255,255,255,255,255,255,255,168,153,222,124,102,206, 255,255,255,199,189,234,63,30,183,186,174,229,247,246,252,204,195,236,60,27,182,204,195,236, 255,255,255,255,255,255,232,228,246,117,93,203,52,18,179,83,54,190,196,186,233,255,255,255 }; uchar Mask_X[192]= // The crosses { 254,252,252,189,51,51,236,195,195,255,255,255,255,255,255,235,192,192,248,234,234,255,255,255, 255,255,255,202,90,90,184,33,33,251,243,243,212,120,120,173,0,0,173,0,0,255,255,255, 255,255,255,254,252,252,195,69,69,192,60,60,178,15,15,233,186,186,253,249,249,255,255,255, 255,255,255,255,255,255,241,210,210,173,0,0,209,111,111,255,255,255,255,255,255,255,255,255, 255,255,255,255,255,255,205,99,99,192,60,60,181,24,24,241,210,210,255,255,255,255,255,255, 255,255,255,249,237,237,176,9,9,241,213,213,226,165,165,189,51,51,254,252,252,255,255,255, 255,255,255,230,177,177,185,36,36,255,255,255,255,255,255,189,51,51,222,153,153,255,255,255, 255,255,255,240,207,207,200,84,84,255,255,255,255,255,255,227,168,168,211,117,117,255,255,255 }; //+------------------------------------------------------------------+ //| Instrument selection | //+------------------------------------------------------------------+ void OnStart() { int mwSymb; string symb; int height=0,width=0; string pnfArray[]; if(mw==true) { mwSymb=0; while(mwSymb<SymbolsTotal(true)) { symb=SymbolName(mwSymb,true); ArrayFree(pnfArray); ArrayResize(pnfArray,0,0); PNF(symb,pnfArray,height,width,pic,cellsize); pnf2file(symb,pnfArray,0,height); mwSymb++; }; } else { symb=Symbol(); ArrayFree(pnfArray); ArrayResize(pnfArray,0,0); PNF(symb,pnfArray,height,width,pic,cellsize); pnf2file(symb,pnfArray,0,height); }; Alert("Ok."); } //+------------------------------------------------------------------+ //| Chart calculation and drawing | //+------------------------------------------------------------------+ void PNF(string sName, // instrument string& array[], // array for the output int& y, // array height int& z, // array width bool toPic, // if true-output and draw int cs) // set the cell size for drawing { string s,ps; datetime d[]; double o[],h[],l[],c[]; long v[]; uchar matrix[]; long VolByPrice[],VolByCol[],HVolumeMax,VVolumeMax; int tMin[],tMax[]; datetime DateByCol[]; MqlDateTime bMDT,eMDT; string strDBC[]; uchar pnf='.'; int sd; int b,i,j,k=0,m=0; int GlobalMin,GlobalMax,StartMin,StartMax,CurMin,CurMax,RevMin,RevMax,ContMin,ContMax; int height,width,beg=0,end=0; double dBox,price; int thBeg=1,thEnd=2,tv=0; uchar trend='.'; // --------------------------------- BMP ----------------------------------------- int RowVolWidth=10*cs; //--- shift for prices int startX=5*cs; int yshift=cs*7; // --------------------------------- BMP ----------------------------------------- if(SymbolInfoInteger(sName,SYMBOL_DIGITS)<=3) sd=2; else sd=4; b=MathMin(Bars(sName,tf),depth); ArrayFree(d); ArrayFree(o); ArrayFree(h); ArrayFree(l); ArrayFree(c); ArrayFree(v); ArrayFree(matrix); ArrayFree(VolByPrice); ArrayFree(VolByCol); ArrayFree(DateByCol); ArrayFree(tMin); ArrayFree(tMax); ArrayResize(d,b,0); ArrayResize(o,b,0); ArrayResize(h,b,0); ArrayResize(l,b,0); ArrayResize(c,b,0); ArrayResize(v,b,0); ArrayInitialize(d,NULL); ArrayInitialize(o,NULL); ArrayInitialize(h,NULL); ArrayInitialize(l,NULL); ArrayInitialize(c,NULL); ArrayInitialize(v,NULL); CopyTime(sName,tf,0,b,d); CopyOpen(sName,tf,0,b,o); CopyHigh(sName,tf,0,b,h); CopyLow(sName,tf,0,b,l); CopyClose(sName,tf,0,b,c); CopyTickVolume(sName,tf,0,b,v); if(box!=0) { dBox=box/MathPow(10.0,(double)sd); } else { dBox=MathNorm((h[ArrayMaximum(h,0,WHOLE_ARRAY)]-l[ArrayMinimum(l,0,WHOLE_ARRAY)])/count, 1/MathPow(10.0,(double)sd),true)/MathPow(10.0,(double)sd); }; GlobalMin=MathNorm(l[ArrayMinimum(l,0,WHOLE_ARRAY)],dBox,true)-(int)(reverse); GlobalMax=MathNorm(h[ArrayMaximum(h,0,WHOLE_ARRAY)],dBox,false)+(int)(reverse); StartMin=MathNorm(l[0],dBox,true); StartMax=MathNorm(h[0],dBox,false); ContMin=(int)(StartMin-1); ContMax=(int)(StartMax+1); RevMin=(int)(StartMax-reverse); RevMax=(int)(StartMin+reverse); height=(int)(GlobalMax-GlobalMin); width=1; ArrayResize(matrix,height*width,0); ArrayInitialize(matrix,'.'); ArrayResize(VolByPrice,height,0); ArrayInitialize(VolByPrice,0); ArrayResize(VolByCol,width,0); ArrayInitialize(VolByCol,0); ArrayResize(DateByCol,width,0); ArrayInitialize(DateByCol,D'01.01.1971'); ArrayResize(tMin,width,0); ArrayInitialize(tMin,0); ArrayResize(tMax,width,0); ArrayInitialize(tMax,0); for(i=1;i<b;i++) { CurMin=MathNorm(l[i],dBox,true); CurMax=MathNorm(h[i],dBox,false); switch(pnf) { case '.': { if(CurMax>=RevMax) { pnf='X'; ContMax=(int)(CurMax+1); RevMin=(int)(CurMax-reverse); beg=(int)(StartMin-GlobalMin-1); end=(int)(CurMax-GlobalMin-1); SetMatrix(matrix,beg,end,height,(int)(width-1),pnf); SetVector(VolByPrice,beg,end,v[i]); VolByCol[width-1]=VolByCol[width-1]+v[i]; DateByCol[width-1]=d[i]; trend='D'; break; }; if(CurMin<=RevMin) { pnf='O'; ContMin=(int)(CurMin-1); RevMax=(int)(CurMin+reverse); beg=(int)(CurMin-GlobalMin-1); end=(int)(StartMax-GlobalMin-1); SetMatrix(matrix,beg,end,height,(int)(width-1),pnf); SetVector(VolByPrice,beg,end,v[i]); VolByCol[width-1]=VolByCol[width-1]+v[i]; DateByCol[width-1]=d[i]; trend='U'; break; }; break; }; case 'X': { if(CurMax>=ContMax) { pnf='X'; ContMax=(int)(CurMax+1); RevMin=(int)(CurMax-reverse); end=(int)(CurMax-GlobalMin-1); SetMatrix(matrix,beg,end,height,(int)(width-1),pnf); SetVector(VolByPrice,beg,end,v[i]); VolByCol[width-1]=VolByCol[width-1]+v[i]; DateByCol[width-1]=d[i]; break; }; if(CurMin<=RevMin) { pnf='O'; ContMin=(int)(CurMin-1); RevMax=(int)(CurMin+reverse); tMin[width-1]=beg-1; tMax[width-1]=end+1; beg=(int)(CurMin-GlobalMin-1); end--; width++; ArrayResize(matrix,height*width,0); ArrayResize(VolByCol,width,0); ArrayResize(DateByCol,width,0); ArrayResize(tMin,width,0); ArrayResize(tMax,width,0); SetMatrix(matrix,0,(int)(height-1),height,(int)(width-1),'.'); SetMatrix(matrix,beg,end,height,(int)(width-1),pnf); SetVector(VolByPrice,beg,end,v[i]); VolByCol[width-1]=0; VolByCol[width-1]=VolByCol[width-1]+v[i]; DateByCol[width-1]=d[i]; tMin[width-1]=beg-1; tMax[width-1]=end+1; break; }; break; }; case 'O': { if(CurMin<=ContMin) { pnf='O'; ContMin=(int)(CurMin-1); RevMax=(int)(CurMin+reverse); beg=(int)(CurMin-GlobalMin-1); SetMatrix(matrix,beg,end,height,(int)(width-1),pnf); SetVector(VolByPrice,beg,end,v[i]); VolByCol[width-1]=VolByCol[width-1]+v[i]; DateByCol[width-1]=d[i]; break; }; if(CurMax>=RevMax) { pnf='X'; ContMax=(int)(CurMax+1); RevMin=(int)(CurMax-reverse); tMin[width-1]=beg-1; tMax[width-1]=end+1; beg++; end=(int)(CurMax-GlobalMin-1); width++; ArrayResize(matrix,height*width,0); ArrayResize(VolByCol,width,0); ArrayResize(DateByCol,width,0); ArrayResize(tMin,width,0); ArrayResize(tMax,width,0); SetMatrix(matrix,0,(int)(height-1),height,(int)(width-1),'.'); SetMatrix(matrix,beg,end,height,(int)(width-1),pnf); SetVector(VolByPrice,beg,end,v[i]); VolByCol[width-1]=0; VolByCol[width-1]=VolByCol[width-1]+v[i]; DateByCol[width-1]=d[i]; tMin[width-1]=beg-1; tMax[width-1]=end+1; break; }; break; }; }; }; //--- credits s="BSD License, 2012, FXRays.info by Roman Rich"; k++; ArrayResize(array,k,0); array[k-1]=s; s=SymbolInfoString(sName,SYMBOL_DESCRIPTION)+", Box-"+DoubleToString(box,0)+",Reverse-"+DoubleToString(reverse,0); k++; ArrayResize(array,k,0); array[k-1]=s; // --------------------------------- BMP ----------------------------------------- if(toPic==true) { //-- BMP image size on the chart display int XSize=cs*width+2*startX+RowVolWidth; int YSize=cs*height+yshift+70; //-- creating a bmp image sized XSize x YSize with the background color clrWhite bmp.Create(XSize,YSize,clrWhite); //-- displaying cells of the main field for(i=height-1;i>=0;i--) for(j=0;j<=width-1;j++) { bmp.Bar(RowVolWidth+startX+cs*j,yshift+cs*i,cs,cs,clrWhite); bmp.Rectangle(RowVolWidth+startX+cs*j,yshift+cs*i,cs,cs,clrLightGray); } bmp.TypeText(10,yshift+cs*(height)+50,array[k-2],clrDarkGray); bmp.TypeText(10,yshift+cs*(height)+35,array[k-1],clrGray); } // --------------------------------- BMP ----------------------------------------- //--- calculating trend lines i=0; while(thEnd<width-1) { while(thBeg+i<thEnd) { if(trend=='U') { i=ArrayMinimum(tMin,thBeg,thEnd-thBeg); j=tMin[i]; } else { i=ArrayMaximum(tMax,thBeg,thEnd-thBeg); j=tMax[i]; } thBeg=i; tv=j; i=0; while(GetMatrix(matrix,j,height,(long)(thBeg+i))=='.') { i++; if(trend=='U') j++; else j--; if(thBeg+i==width-1) { thEnd=width-1; break; }; }; if(thBeg+i<thEnd) { thBeg=thBeg+2; i=0; }; }; thEnd=thBeg+i; if(thEnd==thBeg) thEnd++; for(i=thBeg;i<thEnd;i++) { SetMatrix(matrix,tv,tv,height,(long)(i),'+'); // --------------------------------- BMP ----------------------------------------- if(toPic==true) { //--- support and resistance lines if(trend=='U') { bmp.DrawLine(RowVolWidth+startX+i*cs,yshift+tv*cs, RowVolWidth+startX+(i+1)*cs,yshift+(tv+1)*cs,clrGreen); } if(trend=='D') { bmp.DrawLine(RowVolWidth+startX+i*cs,yshift+(tv+1)*cs, RowVolWidth+startX+(i+1)*cs,yshift+(tv)*cs,clrRed); } //--- broadening of support/resistance lines if(trend=='U') { bmp.DrawLine(RowVolWidth+1+startX+i*cs,yshift+tv*cs, RowVolWidth+1+startX+(i+1)*cs,yshift+(tv+1)*cs,clrGreen); } if(trend=='D') { bmp.DrawLine(RowVolWidth+1+startX+i*cs,yshift+(tv+1)*cs, RowVolWidth+1+startX+(i+1)*cs,yshift+(tv)*cs,clrRed); } } // --------------------------------- BMP ----------------------------------------- if(trend=='U') tv++; else tv--; }; if(trend=='U') trend='D'; else trend='U'; i=0; }; //--- displaying data in columns ArrayResize(strDBC,width,0); TimeToStruct(DateByCol[0],bMDT); TimeToStruct(DateByCol[width-1],eMDT); if((DateByCol[width-1]-DateByCol[0])>=50000000) { for(i=0;i<=width-1;i++) StringInit(strDBC[i],4,' '); for(i=1;i<=width-1;i++) { TimeToStruct(DateByCol[i-1],bMDT); TimeToStruct(DateByCol[i],eMDT); if(bMDT.year!=eMDT.year) strDBC[i]=DoubleToString(eMDT.year,0); }; for(i=0;i<=3;i++) { StringInit(s,vd,' '); s=s+" : "; for(j=0;j<=width-1;j++) s=s+StringSubstr(strDBC[j],i,1); s=s+" : "; k++; ArrayResize(array,k,0); array[k-1]=s; }; } else { if((DateByCol[width-1]-DateByCol[0])>=5000000) { for(i=0;i<=width-1;i++) StringInit(strDBC[i],7,' '); for(i=1;i<=width-1;i++) { TimeToStruct(DateByCol[i-1],bMDT); TimeToStruct(DateByCol[i],eMDT); if(bMDT.mon!=eMDT.mon) { if(eMDT.mon<10) strDBC[i]=DoubleToString(eMDT.year,0)+".0"+DoubleToString(eMDT.mon,0); if(eMDT.mon>=10) strDBC[i]=DoubleToString(eMDT.year,0)+"."+DoubleToString(eMDT.mon,0); } }; for(i=0;i<=6;i++) { StringInit(s,vd,' '); s=s+" : "; for(j=0;j<=width-1;j++) s=s+StringSubstr(strDBC[j],i,1); s=s+" : "; k++; ArrayResize(array,k,0); array[k-1]=s; }; } else { for(i=0;i<=width-1;i++) StringInit(strDBC[i],10,' '); for(i=1;i<=width-1;i++) { TimeToStruct(DateByCol[i-1],bMDT); TimeToStruct(DateByCol[i],eMDT); if(bMDT.day!=eMDT.day) { if(eMDT.mon<10 && eMDT.day<10) strDBC[i]=DoubleToString(eMDT.year,0)+".0" +DoubleToString(eMDT.mon,0)+".0"+DoubleToString(eMDT.day,0); if(eMDT.mon<10 && eMDT.day>=10) strDBC[i]=DoubleToString(eMDT.year,0)+".0" +DoubleToString(eMDT.mon,0)+"."+DoubleToString(eMDT.day,0); if(eMDT.mon>=10&&eMDT.day< 10) strDBC[i]=DoubleToString(eMDT.year,0)+"." +DoubleToString(eMDT.mon,0)+".0"+DoubleToString(eMDT.day,0); if(eMDT.mon>=10&&eMDT.day>=10) strDBC[i]=DoubleToString(eMDT.year,0)+"." +DoubleToString(eMDT.mon,0)+"." +DoubleToString(eMDT.day,0); } }; for(i=0;i<=9;i++) { StringInit(s,vd,' '); s=s+" : "; for(j=0;j<=width-1;j++) s=s+StringSubstr(strDBC[j],i,1); s=s+" : "; k++; ArrayResize(array,k,0); array[k-1]=s; }; }; }; StringInit(s,25+vd+width,'-'); k++; ArrayResize(array,k,0); array[k-1]=s; //--- displaying price chart price=GlobalMax*dBox; HVolumeMax=VolByPrice[ArrayMaximum(VolByPrice,0,WHOLE_ARRAY)]; s=""; for(i=height-1;i>=0;i--) { StringInit(ps,8-StringLen(DoubleToString(price,sd)),' '); s=s+ps+DoubleToString(price,sd)+" : "; for(j=0;j<vd;j++) if(VolByPrice[i]>HVolumeMax*j/vd) s=s+"*"; else s=s+" "; s=s+" : "; for(j=0;j<=width-1;j++) s=s+CharToString(matrix[j*height+i]); s=s+" : "+ps+DoubleToString(price,sd); k++; ArrayResize(array,k,0); array[k-1]=s; s=""; price=price-dBox; }; StringInit(s,25+vd+width,'-'); k++; ArrayResize(array,k,0); array[k-1]=s; //--- simple markup through 10 StringInit(s,vd,' '); s=s+" : "; for(j=0;j<=width-1;j++) if(StringGetCharacter(DoubleToString(j,0), StringLen(DoubleToString(j,0))-1)==57) s=s+"|"; else s=s+" "; s=s+" : "; k++; ArrayResize(array,k,0); array[k-1]=s; //--- displaying volume chart in columns VVolumeMax=VolByCol[ArrayMaximum(VolByCol,0,WHOLE_ARRAY)]; for(i=vd-1;i>=0;i--) { StringInit(s,vd,' '); s=s+" : "; for(j=0;j<=width-1;j++) if(VolByCol[j]>VVolumeMax*i/vd) s=s+"*"; else s=s+" "; s=s+" : "; k++; ArrayResize(array,k,0); array[k-1]=s; }; StringInit(s,25+vd+width,'-'); k++; ArrayResize(array,k,0); array[k-1]=s; //--- column history s=" | Start Date/Time | End Date/Time | "; k++; ArrayResize(array,k,0); array[k-1]=s; TimeToStruct(DateByCol[0],bMDT); s=" 1 | 0000/00/00 00:00:00 | "; s=s+DoubleToString(bMDT.year,0)+"/"; if(bMDT.mon >=10) s=s+DoubleToString(bMDT.mon ,0)+"/"; else s=s+"0"+DoubleToString(bMDT.mon ,0)+"/"; if(bMDT.day >=10) s=s+DoubleToString(bMDT.day ,0)+" "; else s=s+"0"+DoubleToString(bMDT.day ,0)+" "; if(bMDT.hour>=10) s=s+DoubleToString(bMDT.hour,0)+":"; else s=s+"0"+DoubleToString(bMDT.hour,0)+":"; if(bMDT.min >=10) s=s+DoubleToString(bMDT.min ,0)+":"; else s=s+"0"+DoubleToString(bMDT.min ,0)+":"; if(bMDT.sec >=10) s=s+DoubleToString(bMDT.sec ,0)+" | "; else s=s+"0"+DoubleToString(bMDT.sec ,0)+" | "; k++; ArrayResize(array,k,0); array[k-1]=s; for(i=1;i<=width-1;i++) { TimeToStruct(DateByCol[i-1],bMDT); TimeToStruct(DateByCol[i],eMDT); s=""; StringInit(ps,4-StringLen(DoubleToString(i+1,0)),' '); s=s+ps+DoubleToString(i+1,0)+" | "; s=s+DoubleToString(bMDT.year,0)+"/"; if(bMDT.mon >=10) s=s+DoubleToString(bMDT.mon ,0)+"/"; else s=s+"0"+DoubleToString(bMDT.mon ,0)+"/"; if(bMDT.day >=10) s=s+DoubleToString(bMDT.day ,0)+" "; else s=s+"0"+DoubleToString(bMDT.day ,0)+" "; if(bMDT.hour>=10) s=s+DoubleToString(bMDT.hour,0)+":"; else s=s+"0"+DoubleToString(bMDT.hour,0)+":"; if(bMDT.min >=10) s=s+DoubleToString(bMDT.min ,0)+":"; else s=s+"0"+DoubleToString(bMDT.min ,0)+":"; if(bMDT.sec >=10) s=s+DoubleToString(bMDT.sec ,0)+" | "; else s=s+"0"+DoubleToString(bMDT.sec ,0)+" | "; s=s+DoubleToString(eMDT.year,0)+"/"; if(eMDT.mon >=10) s=s+DoubleToString(eMDT.mon ,0)+"/"; else s=s+"0"+DoubleToString(eMDT.mon ,0)+"/"; if(eMDT.day >=10) s=s+DoubleToString(eMDT.day ,0)+" "; else s=s+"0"+DoubleToString(eMDT.day ,0)+" "; if(eMDT.hour>=10) s=s+DoubleToString(eMDT.hour,0)+":"; else s=s+"0"+DoubleToString(eMDT.hour,0)+":"; if(eMDT.min >=10) s=s+DoubleToString(eMDT.min ,0)+":"; else s=s+"0"+DoubleToString(eMDT.min ,0)+":"; if(eMDT.sec >=10) s=s+DoubleToString(eMDT.sec ,0)+" | "; else s=s+"0"+DoubleToString(eMDT.sec ,0)+" | "; k++; ArrayResize(array,k,0); array[k-1]=s; }; y=k; z=25+vd+width; // --------------------------------- BMP ----------------------------------------- if(toPic==true) { //--- displaying dates in YYYY/MM/DD format for(j=0;j<=width-1;j++) { string s0=strDBC[j]; StringReplace(s0,".","/"); bmp.TypeTextV(RowVolWidth+startX+cs*j,yshift+cs*(height-1)+5,s0,clrDimGray); } //--- volume cell support for(i=height-1;i>=0;i--) for(j=0;j<vd;j++) { bmp.Bar(cs+startX+cs*(j-1),yshift+cs*i,cs,cs,0xF6F6F6); bmp.Rectangle(cs+startX+cs*(j-1),yshift+cs*i,cs,cs,clrLightGray); } for(i=0; i>-7;i--) for(j=0;j<=vd;j++) { bmp.Bar(cs+startX+cs*(j-1),yshift+cs*i,cs,cs,clrWhite); bmp.Rectangle(cs+startX+cs*(j-1),yshift+cs*i,cs,cs,clrLightGray); } //--- exact volumes for(i=height-1;i>=0;i--) bmp.Bar(startX,yshift+cs*i,int(10*cs*VolByPrice[i]/HVolumeMax),cs,0xB5ABAB); //--- displaying naughts and crosses for(i=height-1;i>=0;i--) for(j=0;j<=width-1;j++) { int xpos=RowVolWidth+startX+cs*j+1; int ypos=yshift+cs*i+1; if(CharToString(matrix[j*height+i])=="X") ShowCell(xpos,ypos,'X'); else if(CharToString(matrix[j*height+i])=="O") ShowCell(xpos,ypos,'O'); } //--- volume underside support for(i=0;i<=60/cs;i++) for(j=0;j<=width-1;j++) { bmp.Bar(RowVolWidth+startX+cs*j,12+cs*i,cs,cs,0xF6F6F6); bmp.Rectangle(RowVolWidth+startX+cs*j,12+cs*i,cs,cs,clrLightGray); } //--- displaying volumes for(j=0;j<=width-1;j++) bmp.Bar(RowVolWidth+startX+cs*j,yshift-60, cs,int(60*VolByCol[j]/VVolumeMax),0xB5ABAB); //--- displaying the main field border bmp.Rectangle(RowVolWidth+startX+cs*0,yshift+cs*0,cs*(width),cs*(height),clrSilver); //--- displaying prices and scale bmp.LineV(startX,yshift,cs*height,clrBlack); bmp.LineV(RowVolWidth+startX+cs*width,yshift,cs*height,clrBlack); price=GlobalMax*dBox; for(i=height-1;i>=0;i--) { //-- prices on the left bmp.TypeText(cs,yshift+cs*i,DoubleToString(price,sd),clrBlack); bmp.LineH(0,yshift+cs*i,startX,clrLightGray); bmp.LineH(0+startX-3,yshift+cs*i,6,clrBlack); //-- prices on the right int dx=RowVolWidth+cs*width; bmp.TypeText(10+startX+dx,yshift+cs*i,DoubleToString(price,sd),clrBlack); bmp.LineH(startX+dx,yshift+cs*i,40,clrLightGray); bmp.LineH(startX+dx-3,yshift+cs*i,6,clrBlack); price=price-dBox; } //-- saving the resulting image in a file bmp.Save(sName,true); } // --------------------------------- BMP ----------------------------------------- } //+------------------------------------------------------------------+ //|Outputting as a text file | //+------------------------------------------------------------------+ void pnf2file(string sName, // instrument for the file name string& array[], // array of lines saved in the file int beg, // the line of the array first saved in the file int end) // the line of the array last saved in the file { string fn; int handle; fn=sName+"_b"+DoubleToString(box,0)+"_r"+DoubleToString(reverse,0)+".txt"; handle=FileOpen(fn,FILE_WRITE|FILE_TXT|FILE_ANSI,';'); for(int i=beg;i<end;i++) FileWrite(handle,array[i]); FileClose(handle); } //+------------------------------------------------------------------+ //| Adjusting the price to the box size | //+------------------------------------------------------------------+ int MathNorm(double value, // transforming any double-type figure into long-type figure double prec, // ensuring the necessary accuracy bool vect) // and if true, rounding up; if false, rounding down { if(vect==true) return((int)(MathCeil(value/prec))); else return((int)(MathFloor(value/prec))); } //+------------------------------------------------------------------+ //| Filling the array | //| Character one-dimensional array represented as a matrix | //+------------------------------------------------------------------+ void SetMatrix(uchar& array[], // passing the array in a link to effect a replacement long pbeg, // from here long pend, // up to here long pheight, // in the column of this height long pwidth, // bearing this number among all the columns in the array uchar ppnf) // with this character { long offset=0; for(offset=pheight*pwidth+pbeg;offset<=pheight*pwidth+pend;offset++) array[(int)offset]=ppnf; } //+------------------------------------------------------------------+ //| Getting an isolated value from the array | //| Character one-dimensional array represented as a matrix | //+------------------------------------------------------------------+ uchar GetMatrix(uchar& array[], // passing it in a link to obtain a character... long pbeg, // here long pheight, // in the column of this height long pwidth) // bearing this number among all the columns in the array { return(array[(int)pheight*(int)pwidth+(int)pbeg]); } //+------------------------------------------------------------------+ //|Filling the vector | //+------------------------------------------------------------------+ void SetVector(long &array[], // passing the long-type array in a link to effect a replacement long pbeg, // from here long pend, // up to here long pv) // with this value { long offset=0; for(offset=pbeg;offset<=pend;offset++) array[(int)offset]=array[(int)offset]+pv; } //+------------------------------------------------------------------+ //| Displaying a horizontal line | //+------------------------------------------------------------------+ void cIntBMPEx::LineH(int aX1,int aY1,int aSizeX,int aColor) { DrawLine(aX1,aY1,aX1+aSizeX,aY1,aColor); } //+------------------------------------------------------------------+ //| Displaying a vertical line | //+------------------------------------------------------------------+ void cIntBMPEx::LineV(int aX1,int aY1,int aSizeY,int aColor) { DrawLine(aX1,aY1,aX1,aY1+aSizeY,aColor); } //+------------------------------------------------------------------+ //| Drawing a rectangle (of a given size) | //+------------------------------------------------------------------+ void cIntBMPEx::Rectangle(int aX1,int aY1,int aSizeX,int aSizeY,int aColor) { DrawRectangle(aX1,aY1,aX1+aSizeX,aY1+aSizeY,aColor); } //+------------------------------------------------------------------+ //| Drawing a filled rectangle (of a given size) | //+------------------------------------------------------------------+ void cIntBMPEx::Bar(int aX1,int aY1,int aSizeX,int aSizeY,int aColor) { DrawBar(aX1,aY1,aX1+aSizeX,aY1+aSizeY,aColor); } //+------------------------------------------------------------------+ //| Drawing a filled rectangle | //+------------------------------------------------------------------+ void cIntBMPEx::DrawBar(int aX1,int aY1,int aX2,int aY2,int aColor) { for(int i=aX1; i<=aX2; i++) for(int j=aY1; j<=aY2; j++) { DrawDot(i,j,aColor); } } //+------------------------------------------------------------------+ //| Displaying the text vertically | //+------------------------------------------------------------------+ void cIntBMPEx::TypeTextV(int aX,int aY,string aText,int aColor) { SetDrawWidth(1); for(int j=0;j<StringLen(aText);j++) { string TypeChar=StringSubstr(aText,j,1); if(TypeChar==" ") { aY+=5; } else { int Pointer=0; for(int i=0;i<ArraySize(CA);i++) { if(CA[i]==TypeChar) { Pointer=i; } } for(int i=PA[Pointer];i<PA[Pointer+1];i++) { DrawDot(aX+YA[i],aY+MaxHeight+XA[i],aColor); } aY+=WA[Pointer]+1; } } } //+------------------------------------------------------------------+ //| Transforming components into color | //+------------------------------------------------------------------+ int RGB256(int aR,int aG,int aB) { return(aR+256*aG+65536*aB); } //+------------------------------------------------------------------+ //| Drawing X's or O's as an image | //+------------------------------------------------------------------+ void ShowCell(int x,int y,uchar img) { uchar r,g,b; for(int i=0; i<8; i++) { for(int j=0; j<8; j++) { switch(img) { case 'X': r=Mask_X[3*(j*8+i)]; g=Mask_X[3*(j*8+i)+1]; b=Mask_X[3*(j*8+i)+2]; break; case 'O': r=Mask_O[3*(j*8+i)]; g=Mask_O[3*(j*8+i)+1]; b=Mask_O[3*(j*8+i)+2]; break; }; int col=RGB256(r,g,b); bmp.DrawDot(x+i,y+j,col); } } } //+------------------------------------------------------------------+
Depending on the value of the input parameter pic, the script results will be generated either in the form of text files with image files (terminal_data_directory\MQL5\Images) or text files only (saved in terminal_data_directory\MQL5\Files).
Comparing Results
To compare the results, let us draw a Light Crude Oil chart with the following parameters: box size is $1, reversal is 3 boxes.
StockCharts.com:
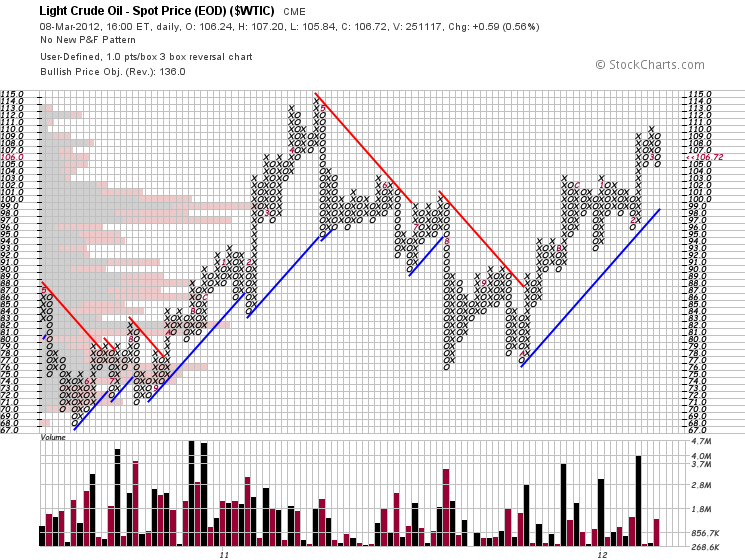
Fig. 1. Point and figure chart for Light Crude Oil generated by StockCharts.com
Bull's-Eye Broker:
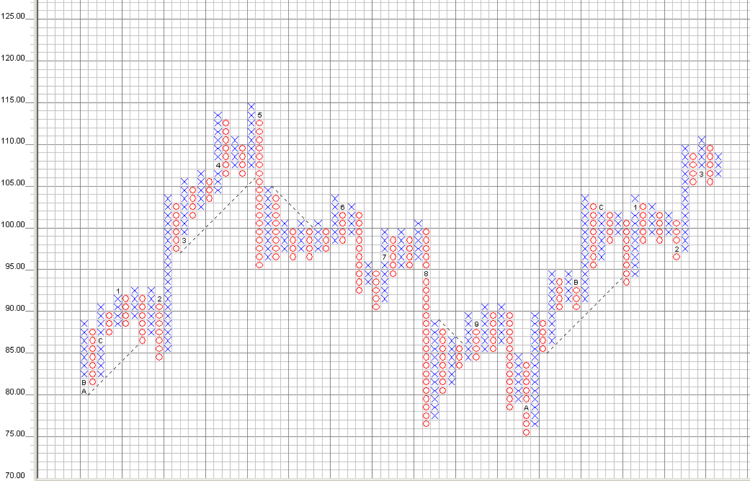
Fig. 2. Point and figure chart for Light Crude Oil generated by Bull's-Eye Broker software
Our script performance results:
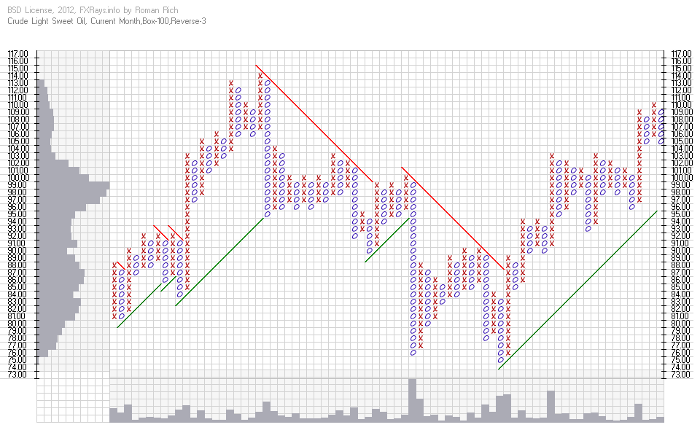
Fig. 3. Point and figure chart for Light Crude Oil generated by our script
All three charts are identical. Congratulations! We've got the feel of point and figure charting.
Typical Point and Figure Chart Patterns
How can they be used?
Let us first have a look at typical patterns, especially as they can be counted on fingers.
These are:
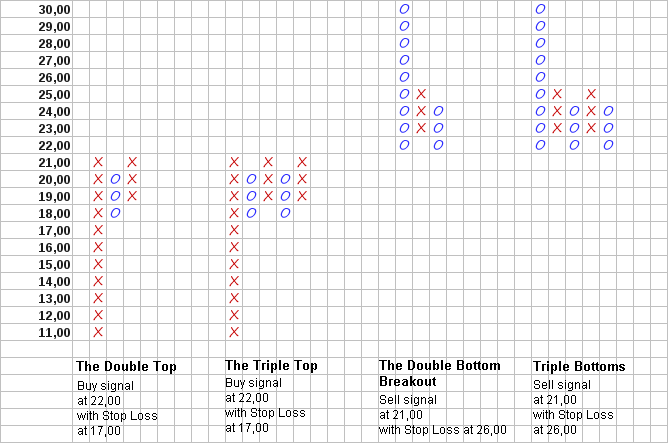
Fig. 4. Price patterns: The Double Top, The Triple Top, The Double Bottom Breakout and The Triple Bottoms
furthermore:
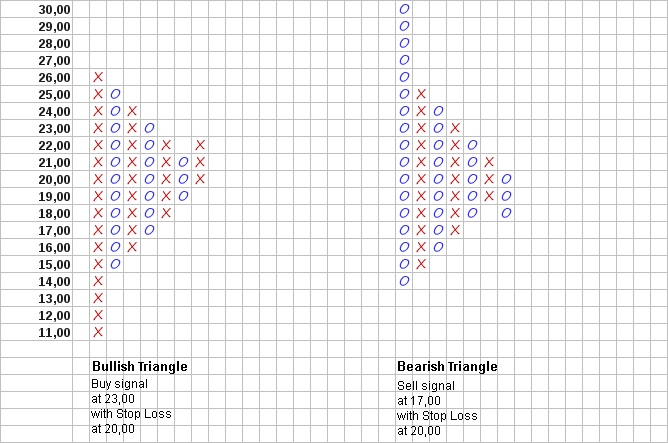
Fig. 5. Price patterns: Bullish Triangle and Bearish Triangle
and finally:
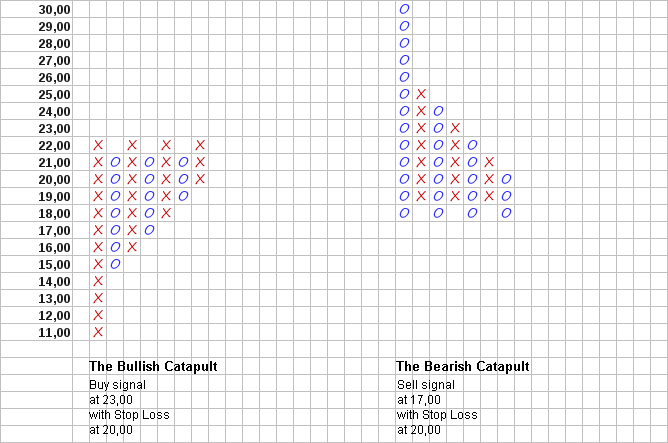
Fig. 6. Price patterns: Bullish Catapult and Bearish Catapult
And now a few tips.
- Open only long positions above the support line and only short positions under the resistance line. For example, starting from the middle of December 2011, after breaking out through the resistance line that has been forming since the end of September 2011, open only long positions in Light Crude Oil futures.
- Use support and resistance lines for trailing stop loss orders.
- Use vertical count before you open a position to estimate a ratio between possible profit and possible loss.
The vertical count is better demonstrated by the following example.
In December 2011, the column of X's moved up from the initial price of $76 beyond the preceding column of X's at $85, broke out through the resistance line at $87 and reached $89. According to the vertical count, this suggests that the price might go up to reach the level of $76+($89-$75)*3 (3 box reversal)=$118.
The next movement was corrective bringing the price to the level of $85. Speculators can place a stop loss order on a long position at $1 less, i.e. at $84.
The entry into the long position can be planned after a completed corrective movement one box higher than the preceding column of X's, i.e. at the price of $90.
Let us estimate the possible loss - it may amount to $90-$84=$6 per one futures contract. Possible profit may reach $118-$90=$28. Possible profit-possible loss ratio: $28/$6>4.5 Good performance, in my opinion. By now our profit would have amounted to $105-$90=$15 per every futures contract.
Licenses
The script was written and provided under BSD license by the author Roman Rich. The text of the license can be found in Lic.txt file. The cIntBMP library was created by Dmitry, aka the Integer. StockCharts.com and Bull's-Eye Broker trademarks are the property of their respective owners.
Conclusion
This article has proposed an algorithm and a script for point and figure charting ("naughts and crosses"). Consideration has been given to various price patterns whose practical use was outlined in recommendations provided.
Translated from Russian by MetaQuotes Ltd.
Original article: https://www.mql5.com/ru/articles/368
 How to Develop an Expert Advisor using UML Tools
 Analyzing the Indicators Statistical Parameters
 How to publish a product on the Market
 Fractal Analysis of Joint Currency Movements
- Free trading apps
- Over 8,000 signals for copying
- Economic news for exploring financial markets
You agree to website policy and terms of use
Forum on trading, automated trading systems and testing trading strategies
Indicators: Point and Figure
newdigital, 2013.09.12 16:29
Point & Figure Charting
Point & Figure Charting reduces the importance of time on a chart and instead focuses on price movements. Point & Figure charts are made up of X's and O's, X's being new highs and O's being new lows. There are two inputs to a Point & Figure chart:
One of the main uses for Point & Figure charts, and the one emphasized in this section, is that Point & Figure charts make it easier for traders to see classic chart patterns. In the chart below of the E-mini S&P 500 Future, the Point & Figure chart emphasized support and resistance lines as well as areas of price breakouts:
Again, the Point & Figure chart makes it easy for traders to see the double bottom pattern below in the chart of the E-mini S&P 500 Futures contract:
The e-mini chart above illustrates the two bottoms of the double bottom pattern, as well as the confirmation line that is pierced, resulting in a buying opportunity.
Point & Figure is a very unique way to plot market action. The strongsuit of Point & Figure charting is that it eliminates the element of time and focuses on what is truly important - pricelic.txt (1.35 KB)
How can i use these indicator and others for MT5? i insert these in mt5,but don't see them in platform.
perhaps i insert them in a incorrect places,,,,,anybody advise me. thx
hi
also i couldnt show in chart whats the problem i couldnt understand can you help me how we can setup file?
hi
also i couldnt show in chart whats the problem i couldnt understand can you help me how we can setup file?