
Layman's Notes: ZigZag…
Introduction
Surely, a fey thought to trade closely to extremums has visited every apprentice trader when he/she saw "enigmatic" polyline for the first time. It's so simple, indeed. Here is the maximum. And there is the minimum. A beautiful picture on the history. And what is in practice? A ray is drawn. It should seem, that is it, the peak! It is time to sell. And now we go down. But hell no! The price is treacherously moving upwards. Haw! It's a trifle, not an indicator. And you throw it out!
Again and again, we come back to the ZigZag indicator after having read some intelligent books about Elliot's wave theory, Fibo levels, Gartley's patterns, etc. An endless circle. An infinite subject to discuss.
The ZigZag indicator is a polyline that consequently joins the peaks and troughs on a price chart. In such a manner, we display the path the price has "followed" with the course of time. This brings up a question now...What are these peaks and troughs?
The article contains the following:
- the description of ZigZag;
- the description of a method to find price models "Peak" and "Trough";
- the definition of potential reverse points;
- the revelation of the indicator's additional features.
What Is ZigZag?
I think, only few ones are surprised with the modern representation of the price chart as a bar. A time length is cut from the ticks history. The enter (Open) and exit (Close) prices, the maximal (High) and minimal (Low) values are fixed. But we can say nothing about the intrabar movement, about its direction at the exit... There is not enough information to make a trade decision. Additional tools are necessary for market analysis.
It is another pair of shoes, when the matter is the ZigZag polyline... We know the level and the approximate time of the last movement start, its direction. On the basis of statistical data processing (peaks and troughs), the possibility of forecasting the probable level and probable reverse time appears... There is enough information to make a "proper" trade decision.
It is important to understand that the current quotes are used for ZigZag drawing. It doesn't use any "quackery" and nor it adds anything to what already exists. The ZigZag is one of the methods of representing a price chart in a more compact form.
What quotes are usually used for ZigZag drawing? High and Low. That is the answer. But we can draw a polyline using only the open or only the close price of the bar (in my opinion, these are most preferable variants, because we know the event time for sure).
How Can We Identify Peaks and Troughs?
Let's remember the definition of a fractal, before we answer this question. Let me quote some phrases from New Trading Dimensions by Bill Williams:
"The fractal pattern is a simple one. The market makes a move in one direction or the other. After a period of time, all the willing buyer, have bought (on an up move) and the market falls back because of a lack of buyers. Then some new incoming information (Chaos) begins to affect the traders. There is an influx of new buying, and the market, finding that place of equal disagreement on value and agreement on price, moves up. If the momentum and the buyers' strength are strong enough to exceed the immediately preceding up fractal, we would place an order to buy one tick over the high of the fractal."
In practice, it is applicable to ZigZag. We search for the new models of Peaks and Troughs during its composing. How can we find them? And here comes a quote again:
“The technical definition of a fractal is: a series of a minimum of five consecutive bars where the highest high is preceded by two lower highs and is followed by two lower highs. (The opposite configuration would be applicable to a sell fractal.)”.
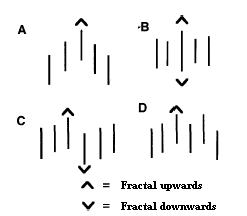
The technical definition of the Peak price model is: a series of N number of consecutive bars, the ExtDepth of bars and CheckBar bars with lower maximums after it are located before the highest maximum in it. (The opposite configuration corresponds the Trough price model). Obtained price model is compared with the last known model for the observance of the ZigZag's main rule: the consecutive alternation of models.
ExtDepth and CheckBar are the names of the parameters used in the ZigZagTF indicator.
The above mentioned algorithm is entirely implemented. Two buffers are used to write the extremums.
Reverse Points
The only parameter ExtDepth is used in the standard ZigZag implementation. CheckBar=0, i.e. the extremum is to be searched on the current bar. This is the reason for the permanent refreshing and redrawing of the last ray. “This ability to correct its values by the following price changes makes Zigzag a perfect tool for analyzing price changes that have already happened. Therefore, you should not try to create a trade system basing on the Zigzag. It is more suitable for analyzing historical data than for making prognoses." (The citation of standard ZigZag developers). It is hard to disagree.
Let's refer to the fractal again. The models of fractal alternate on the price chart, i.e. the fractal of Buying is changed with the Selling fractal and vice versa. But there are some regions on the chart, where fractals do not alternate and the same fractal model occurs again. Usually, it's repeated 2-3 times.
ExtDepth = 2, CheckBar = 2.
Let's try to imitate the working of Fractals indicator (a modification of the standard indicator without redrawing of the last fractal) using our ZigZagTF indicator. The ExtDepth and CheckBar parameters are equal to 2. For a new ray of ZigZag to arise the confirmation of the extremum by two bars is necessary. As soon as the ray appeared on the third bar, we will obtain the potential reverse point. The renewing of the ray is possible but not so often as in the standard ZigZag indicator.
Now the ZigZag indicator became more usable for the creation of a trade strategy.
The Indicator Features
The implementation of possibility of using different price properties for ZigZag composition was already mentioned above.
Price Parameters:
0 – High and Low;
1 – bar's open price (Open);
2 – bar's minimum (Low);
3 – bar's maximum (High);
4 – bar's close price (Close).
ZigZag is drawn by the close prices. ExtDepth = 2, CheckBar = 2.
The situation, when the more accurate information is necessary for drawing the ZigZag, may happen. For example, when both extremums are found on a bar, it is so called external bar. How should we correctly draw the polyline, in this case? The possibility of using smaller timeframes is implemented.
The TimeFrame parameter: 0 – the current timeframe.
The Zzcolor and Zzwidth parameters change the color and the width of the ZigZag line, respectively.
It is useful to know the information about the level of extremum possible appearance, especially when a new ray has not been drawn yet, when there is no confirmation signal (CheckBar parameter), and the level of extremum appearance is broken through.
The Levels parameter – enables disables the drawing of levels.
The Lcolor and Hcolor parameters change the color of the lower and the higher level, respectively.
The levels of new extremum appearance
There is a possibility of writing all points of the ZigZag's polyline after it's drawn into a file. The file is at the: client_terminal_root_directory\experts\files folder. The writing of found points: bar number, type of the point, price.
147;Down;209.11
141;Up;210.77
133;Down;208.57
131;Up;209.63
128;Down;208.67
121;Up;209.97
117;Down;209.57
112;Up;210.6
109;Down;209.64
106;Up;210.39
103;Down;209.4
The Record parameter – enables writing of the reverse points into the file.
And the last function that is frequently used in trading is the connection of Fibo levels. The Fibo1 and Fibo2 parameters allow to enable/disable the Fibo levels on the last and the next to the last ray, respectively. We choose the necessary color by the FiboColor1 and FiboColor2 parameters.
Conclusion
In this article, I have compared the Fractal and the ZigZag indicators. It appeared that the Fractal model was a particular case. We can also remember the Gann's indicators: the small trend, the intermediate trend, and the main trend. They are the particular cases of the ZigZag, as well.
Maybe it is the first time when the ZigZag is defined as the consecutive alternation of the Peak-and-Trough price models, the technical method of finding them on the price chart.
Now the work is over. Worthful community obtained a convenient tool for trading and market analysis. Luck and profits to everyone!
Translated from Russian by MetaQuotes Software Corp.
Original article: http://articles.mql4.com/ru/articles/1537
Translated from Russian by MetaQuotes Ltd.
Original article: https://www.mql5.com/ru/articles/1537
 Trend-Hunting
 The Statistic Analysis of Market Movements and Their Prognoses
 All about Automated Trading Championship: Registration
 Market Diagnostics by Pulse
- Free trading apps
- Over 8,000 signals for copying
- Economic news for exploring financial markets
You agree to website policy and terms of use
Very Interesting, I'm trying to build an ea based on zigzag indicator and I show you the result of backtesting from may 2008 till now.
No bad isn't it?
Can you share your EA?
does it repaints like the normal zig zag??
I am trying to read the results of the 4 buffers and then understand what it is, however I am only getting zero in most part of the positions of the output buffers. What am I doing wrong?
How can I get the most recent High and Low?
should allow the indicator to be attach to offline charts.