
Calculation of Integral Characteristics of Indicator Emissions
Introduction
Indicator emissions represent a new and quite promising direction in the study of time series. It is characterized by the fact that the analysis is not focused on indicators as such but on their emissions into the future or past based on which we can actually make a market environment forecast:
- support and resistance levels in the future;
- trend direction (price movement);
- strength of movement accumulated over the past.
My previous article called "Drawing Indicator's Emissions in MQL5" dealt with the algorithm of emission drawing and specified its key features. Let me remind you:
Emission is a set of points located at intersections of lines peculiar to the indicators under consideration.
Emission points, in their turn, have some peculiarities:
- Emission points of the same type tend to cluster.
- Dense point clusters can attract or, conversely, repel the price.
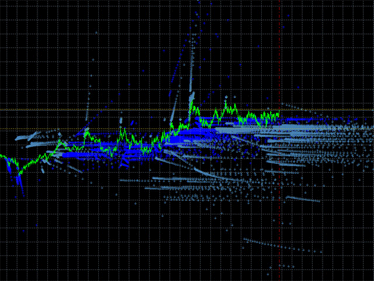
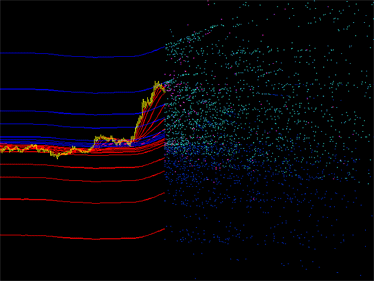
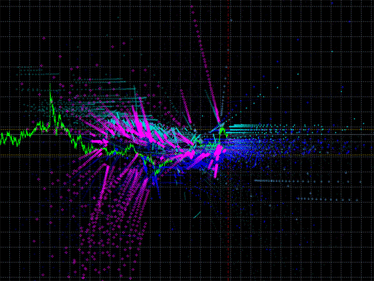
Emission gallery:
 |
 |
|---|---|
 |
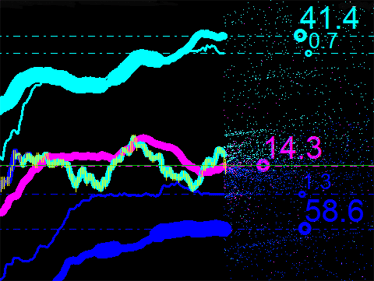 |
Fig. 1. Examples of indicator emission plots. Left: emission of the DCMV indicator. Right: emission of the iMA and iEnvelopes indicators.
In illustration of the calculation of integral characteristics of emissions, we will take moving average envelopes (Envelopes) and moving averages (Moving Average) themselves with input parameters as follows:
//--- external variable for storing averaging period of the iEnvelopes indicator
input int   ma_period=140; // averaging period of the iEnvelopes indicator
//--- array for storing deviations of the iEnvelopes indicator
double      ENV[]={0.01,0.0165,0.0273,0.0452,0.0747,01234,0.204,0.3373,0.5576,0.9217,1.5237};
//--- array for storing iMA indicator periods
int         MA[]={4,7,11,19,31,51,85};
So, we will look for intersections of lines peculiar to the selected indicators. The number of lines and their characteristics (averaging periods and deviations) are chosen at random. Emission can in fact be plotted using any set of parameters for these indicators (as long as they intersect in space).
Now that we have chosen the indicators, let us proceed to create an Expert Advisor that is going to serve as a base program for the analysis of emissions. We will need to get the calculated data from the iMA and iEnvelopes technical indicators. I propose to use a method described in the Guide to Using Technical Indicators in Expert Advisors.
To plot the lines whose intersections we need to find, we only need to set two points for each of the lines. Thus, it is sufficient to get indicator values for two bars (e.g. the current and previous) only. The price on the previous bar is static, while the price on the current bar is dynamic and therefore new points keep being generated with every new tick. Here is the code:
//+------------------------------------------------------------------+
//|                                      emission_of_MA_envelope.mq5 |
//|                                           Copyright 2013, DC2008 |
//|                           https://www.mql5.com/ru/users/DC2008 |
//+------------------------------------------------------------------+
#property copyright "Copyright 2013, DC2008"
#property link      "https://www.mql5.com/ru/users/DC2008"
#property version   "1.00"
//---
#include <GetIndicatorBuffers.mqh>
#include <Emission.mqh>
//--- external variable for storing averaging period of the iEnvelopes indicator
input int   ma_period=140;      // averaging period of the iEnvelopes indicator
//--- array for storing deviations of the iEnvelopes indicator
double      ENV[]={0.01,0.0165,0.0273,0.0452,0.0747,01234,0.204,0.3373,0.5576,0.9217,1.5237};
//--- array for storing the iMA indicator periods
int         MA[]={4,7,11,19,31,51,85};
//--- array for storing pointers to the iMA and iEnvelopes indicators
int         handle_MA[];
int         handle_Envelopes[];
//--- market data
datetime    T[],prevTimeBar=0;
double      H[],L[];
#define     HL(a, b) (a+b)/2
//--- class instances
CEmission      EnvMa(0,300);
PointEmission  pEmission;
//--- drawing styles for points of emission
#define     COLOR_UPPER  C'51,255,255'
#define     COLOR_LOWER  C'0,51,255'
#define     COLOR_MA     C'255,51,255'
color       colorPoint[]={COLOR_UPPER,COLOR_LOWER,COLOR_MA};
CodeColor   styleUpper={158,COLOR_UPPER,SMALL};
CodeColor   styleLower={158,COLOR_LOWER,SMALL};
CodeColor   styleMA={158,COLOR_MA,SMALL};
//+------------------------------------------------------------------+
//| Expert initialization function                                   |
//+------------------------------------------------------------------+
int OnInit()
  {
   ArraySetAsSeries(T,true);
   ArraySetAsSeries(H,true);
   ArraySetAsSeries(L,true);
//---
   int size=ArraySize(MA);
   ArrayResize(handle_MA,size);
//--- create a pointer to the object - the iMA indicator
   for(int i=0; i<size; i++)
     {
      handle_MA[i]=iMA(NULL,0,MA[i],0,MODE_SMA,PRICE_MEDIAN);
      //--- if an error occurs when creating the object, print the message
      if(handle_MA[i]<0)
        {
         Print("The iMA object[",MA[i],"] has not been created: Error = ",GetLastError());
         //--- forced program termination
         return(-1);
        }
     }
//---
   size=ArraySize(ENV);
   ArrayResize(handle_Envelopes,size);
//--- create a pointer to the object - the iEnvelopes indicator
   for(int i=0; i<size; i++)
     {
      handle_Envelopes[i]=iEnvelopes(NULL,0,ma_period,0,MODE_SMA,PRICE_MEDIAN,ENV[i]);
      //--- if an error occurs when creating the object, print the message
      if(handle_Envelopes[i]<0)
        {
         Print("The iEnvelopes object[",ENV[i],"] has not been created: Error = ",GetLastError());
         //--- forced program termination
         return(-1);
        }
     }
//---
   return(0);
  }
//+------------------------------------------------------------------+
//| Expert deinitialization function                                 |
//+------------------------------------------------------------------+
void OnDeinit(const int reason)
  {
//---

  }
//+------------------------------------------------------------------+
//| Expert tick function                                             |
//+------------------------------------------------------------------+
void OnTick()
  {
//--- market data
   CopyTime(NULL,0,0,2,T);
   CopyHigh(NULL,0,0,2,H);
   CopyLow(NULL,0,0,2,L);
//--- fill the declared arrays with current values from all indicator buffers
   string name;
   uint GTC=GetTickCount();
//---- indicator buffers
   double   ibMA[],ibMA1[];      // arrays for the iMA indicator
   double   ibEnvelopesUpper[];  // array for the iEnvelopes indicator (UPPER_LINE)
   double   ibEnvelopesLower[];  // array for the iEnvelopes indicator (LOWER_LINE)
   for(int i=ArraySize(handle_MA)-1; i>=0; i--)
     {
      if(!CopyBufferAsSeries(handle_MA[i],0,0,2,true,ibMA))
         return;
      //---
      for(int j=ArraySize(handle_Envelopes)-1; j>=0; j--)
        {
         if(!GetEnvelopesBuffers(handle_Envelopes[j],0,2,ibEnvelopesUpper,ibEnvelopesLower,true))
            return;
         //--- find the intersection point of the iEnvelopes(UPPER_LINE) and iMA indicators
         pEmission=EnvMa.CalcPoint(ibEnvelopesUpper[1],ibEnvelopesUpper[0],ibMA[1],ibMA[0],T[0]);
         if(pEmission.real) // if the intersection point is found, draw it in the chart
           {
            name="iEnvelopes(UPPER_LINE)"+(string)j+"=iMA"+(string)i+(string)GTC;
            EnvMa.CreatePoint(name,pEmission,styleUpper);
           }
         //--- find the intersection point of the iEnvelopes(LOWER_LINE) and iMA indicators
         pEmission=EnvMa.CalcPoint(ibEnvelopesLower[1],ibEnvelopesLower[0],ibMA[1],ibMA[0],T[0]);
         if(pEmission.real) // if the intersection point is found, draw it in the chart
           {
            name="iEnvelopes(LOWER_LINE)"+(string)j+"=iMA"+(string)i+(string)GTC;
            EnvMa.CreatePoint(name,pEmission,styleLower);
           }
        }
      //---
      for(int j=ArraySize(handle_MA)-1; j>=0; j--)
        {
         if(i!=j)
           {
            if(!CopyBufferAsSeries(handle_MA[j],0,0,2,true,ibMA1))
               return;
            //--- find the intersection point of the iMA and iMA indicators
            pEmission=EnvMa.CalcPoint(ibMA1[1],ibMA1[0],ibMA[1],ibMA[0],T[0]);
            if(pEmission.real) // if the intersection point is found, draw it in the chart
              {
               name="iMA"+(string)j+"=iMA"+(string)i+(string)GTC;
               EnvMa.CreatePoint(name,pEmission,styleMA);
              }
           }
        }
     }
//--- deletion of the graphical objects of emission not to stuff the chart
   if(T[0]>prevTimeBar) // delete once per bar
     {
      int  total=ObjectsTotal(0,0,-1);
      prevTimeBar=T[0];
      for(int obj=total-1;obj>=0;obj--)
        {
         string obj_name=ObjectName(0,obj,0,OBJ_TEXT);
         datetime obj_time=(datetime)ObjectGetInteger(0,obj_name,OBJPROP_TIME);
         if(obj_time<T[0])
            ObjectDelete(0,obj_name);
        }
      Comment("Emission © DC2008       Objects = ",total);
     }
//---
  }
I am not going to dwell on every detail of this Expert Advisor. The main thing to note here is that to plot the emission, we use a CEmission class instance responsible for the calculation and display of intersection points of any two lines.
//+------------------------------------------------------------------+
//|                                                     Emission.mqh |
//|                                           Copyright 2013, DC2008 |
//|                           https://www.mql5.com/ru/users/DC2008 |
//+------------------------------------------------------------------+
#property copyright "Copyright 2013, DC2008"
#property link      "https://www.mql5.com/ru/users/DC2008"
#property version   "1.00"
#define  BIG   7    // point size
#define  SMALL 3    // point size
//+------------------------------------------------------------------+
//| pMABB structure                                                  |
//+------------------------------------------------------------------+
struct PointEmission
  {
   double            x;       // X-coordinate of the time point
   double            y;       // Y-coordinate of the price point
   datetime          t;       // t-coordinate of the point's time
   bool              real;    // whether the point exists
  };
//+------------------------------------------------------------------+
//| CodeColor structure                                              |
//+------------------------------------------------------------------+
struct CodeColor
  {
   long              Code;    // point symbol code
   color             Color;   // point color
   int               Width;   // point size
  };
//+------------------------------------------------------------------+
//| Base class for emissions                                         |
//+------------------------------------------------------------------+
class CEmission
  {
private:
   int               sec;
   int               lim_Left;   // limiting range of visibility in bars
   int               lim_Right;  // limiting range of visibility in bars

public:
   PointEmission     CalcPoint(double   y1,  // Y-coordinate of straight line 1 on bar [1]
                               double   y0,  // Y-coordinate of straight line 1 on bar [0]
                               double   yy1, // Y-coordinate of straight line 2 on bar [1]
                               double   yy0, // Y-coordinate of straight line 2 on bar [0]
                               datetime t0   // t-coordinate of the current bar Time[0]
                               );
   bool              CreatePoint(string name,            // point name
                                 PointEmission &point,   // coordinates of the point
                                 CodeColor &style);      // point drawing style
                                 CEmission(int limitLeft,int limitRight);
                    ~CEmission();
  };
//+------------------------------------------------------------------+
//|                                                                  |
//+------------------------------------------------------------------+
CEmission::CEmission(int limitLeft,int limitRight)
  {
   sec=PeriodSeconds();
   lim_Left=limitLeft;
   lim_Right=limitRight;
  }
//+------------------------------------------------------------------+
//|                                                                  |
//+------------------------------------------------------------------+
CEmission::~CEmission()
  {
  }
//+------------------------------------------------------------------+
//| The CalcPoint method of the CEmission class                      |
//+------------------------------------------------------------------+
PointEmission CEmission::CalcPoint(double   y1, // Y-coordinate of straight line 1 on bar [1]
                                   double   y0, // Y-coordinate of straight line 1 on bar [0]
                                   double   yy1,// Y-coordinate of straight line 2 on bar [1]
                                   double   yy0,// Y-coordinate of straight line 2 on bar [0]
                                   datetime t0  // t-coordinate of the current bar Time[0]
                                   )
  {
   PointEmission point={NULL,NULL,NULL,false};
   double y0y1=y0-y1;
   double y1yy1=y1-yy1;
   double yy0yy1=yy0-yy1;
   double del0=yy0yy1-y0y1;
   if(MathAbs(del0)>0)
     {
      point.x=y1yy1/del0;
      if(point.x<lim_Left || point.x>lim_Right) return(point);
      point.y=y1+y0y1*y1yy1/del0;
      if(point.y<0) return(point);
      point.t=t0+(int)(point.x*sec);
      point.real=true;
      return(point);
     }
   return(point);
  }
//+------------------------------------------------------------------+
//| The CreatePoint method of the CEmission class                    |
//+------------------------------------------------------------------+
bool CEmission::CreatePoint(string name,            // point name
                            PointEmission &point,  // coordinates of the point
                            CodeColor &style)      // point drawing style
  {
   if(ObjectCreate(0,name,OBJ_TEXT,0,0,0))
     {
      ObjectSetString(0,name,OBJPROP_FONT,"Wingdings");
      ObjectSetInteger(0,name,OBJPROP_ANCHOR,ANCHOR_CENTER);
      ObjectSetInteger(0,name,OBJPROP_FONTSIZE,style.Width);
      ObjectSetString(0,name,OBJPROP_TEXT,CharToString((uchar)style.Code));
      ObjectSetDouble(0,name,OBJPROP_PRICE,point.y);
      ObjectSetInteger(0,name,OBJPROP_TIME,point.t);
      ObjectSetInteger(0,name,OBJPROP_COLOR,style.Color);
      return(true);
     }
   return(false);
  }
It should be noted that emission points are depicted by means of graphical objects such as Text. First of all, it comes from the fact that object anchors should be aligned to the symbol center. Second, you can vary object size over a wide range. These point properties offer a great potential for getting complex emissions.

Fig. 2. Original emission of the iMA and iEnvelopes indicators
Integral Characteristics of Emissions
So, after placing the proposed Expert Advisor on the chart, we got a lot of points in different colors (see Fig. 2):
- Aqua - intersections of iMA and iEnvelopes, UPPER_LINE buffer.
- Blue - intersections of iMA and iEnvelopes, LOWER_LINE buffer.
- Magenta - intersections of iMA and iMA.
This chaos cannot be used in automated trading. We need signals, levels and other quantitative market characteristics, while here we only get visual images for meditation and chiromancy and no numbers whatsoever.
Integral characteristics of emissions serve to generalize data obtained as a result of indicator emissions.
The need for integral characteristics of emissions is also driven by the fact that they give opportunities for market research using new types of indicators: integral channels, lines, levels, signals, etc. To determine the most typical emission values, we will start small and calculate the mean price for every point type to further draw horizontal lines through them as shown below:

Fig. 3. Horizontal lines of the mean price for every point type
For this purpose, we will add a few additional code blocks to the existing code. To the data section:
//--- arrays for calculation and display of integral characteristics of emissions
#define     NUMBER_TYPES_POINT   3
double      sum[NUMBER_TYPES_POINT],sumprev[NUMBER_TYPES_POINT];
datetime    sum_time[NUMBER_TYPES_POINT];
int         n[NUMBER_TYPES_POINT],W[NUMBER_TYPES_POINT];
color       colorLine[]={clrAqua,clrBlue,clrMagenta};
To the OnTick() module:
//--- calculation of integral characteristics of emissions
   ArrayInitialize(n,0);
   ArrayInitialize(sum,0.0);
   ArrayInitialize(sum_time,0.0);
   for(int obj=total-1;obj>=0;obj--)
     {
      string   obj_name=ObjectName(0,obj,0,OBJ_TEXT);
      datetime obj_time=(datetime)ObjectGetInteger(0,obj_name,OBJPROP_TIME);
      if(obj_time>T[0])
        {
         color    obj_color=(color)ObjectGetInteger(0,obj_name,OBJPROP_COLOR);
         double   obj_price=ObjectGetDouble(0,obj_name,OBJPROP_PRICE);
         for(int i=ArraySize(n)-1; i>=0; i--)
            if(obj_color==colorPoint[i])
              {
               n[i]++;
               sum[i]+=obj_price;
               sum_time[i]+=obj_time;
              }
        }
     }
//--- displaying integral characteristics of emissions
   for(int i=ArraySize(n)-1; i>=0; i--)
     {
      if(n[i]>0)
        {
         name="H.line."+(string)i;
         ObjectCreate(0,name,OBJ_HLINE,0,0,0,0);
         ObjectSetInteger(0,name,OBJPROP_COLOR,colorLine[i]);
         ObjectSetInteger(0,name,OBJPROP_STYLE,STYLE_DASHDOT);
         ObjectSetInteger(0,name,OBJPROP_WIDTH,1);
         ObjectSetDouble(0,name,OBJPROP_PRICE,sum[i]/n[i]);
        }
     }
We move on. Let us now calculate the mean time value for every point set and mark it on the corresponding line of the mean price (see Fig. 4). Thus, we have obtained the first quantitative characteristics of emissions which are never static, always moving in space.
The chart only shows their momentary positions. We need to somehow keep them fixed in history to be able to study them afterwards. So far it is still unclear how this can be done and we need to give it careful consideration... In the meantime, we will make further improvement and display the number of points involved in the calculation next to the markers in the chart. These are some sort of weights of the obtained characteristics that will also be useful in further analysis.

Fig. 4. Markers at intersection points of the mean price and mean time
However, for convenience of the analysis, we will use their percentage ratios. Since the main emission points are the ones resulting from intersections of the iMA and iEnvelopes indicators, we will consider their sum to be 100%. Let us see what we have now:

Fig. 5. Percentage ratio for every type of emission points
If we add up the three values, they will give more than 100% in total. The value of 34.4 displayed in magenta is the property of intersection points of iMA and iMA at a certain point of time, i.e. the indicator has crossed itself, but with different input data. In this case, this is a reference value and we might later think of the way how it can be used in market analysis.
However, another problem arises as we get percentage ratios of the number of points: how can we also fix percentage values of emission characteristics in history, especially as they do vary, too?!
Graphical Analysis
Although we now have the integral characteristics of emissions, we are still not close enough to the analysis and development of a trading strategy based on the data obtained. However, a careful reader must have already spotted a solution to this problem (see Fig. 1). The solution is as follows: I propose to draw integral curves using different thickness that would be proportional to the percentage ratio of the main emission points.
The current portion of the curve will be plotted along the mean price line between the current and previous bar, keeping in mind that these coordinates are in fact taken from the future. It is some sort of leading integral channel of indicator emissions. I know it sounds very confusing indeed... And you must be thinking whether you should read on. But I hope this will get more and more interesting as we proceed.
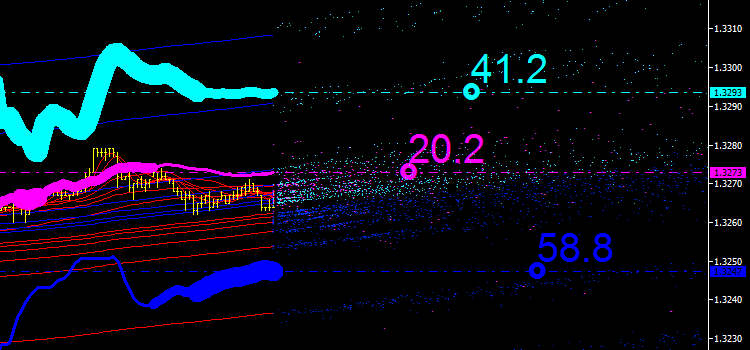
Fig. 6. Integral channel of indicator emissions
So we seem to have found some use for the "iMA & iMA" emission (displayed in magenta in the chart). And we got a new indicator - the integrated moving average.
Now we go back to the code of the Expert Advisor to see what changes took place in the OnTick() module:
//--- displaying integral characteristics of emissions
   ArrayInitialize(W,10);
   W[ArrayMaximum(n)]=20;
   W[ArrayMinimum(n)]=3;
   for(int i=ArraySize(n)-1; i>=0; i--)
     {
      if(n[i]>0)
        {
         //--- horizontal lines of mean prices
         name="H.line."+(string)i;
         ObjectCreate(0,name,OBJ_HLINE,0,0,0,0);
         ObjectSetInteger(0,name,OBJPROP_COLOR,colorLine[i]);
         ObjectSetInteger(0,name,OBJPROP_STYLE,STYLE_DASHDOT);
         ObjectSetInteger(0,name,OBJPROP_WIDTH,1);
         ObjectSetDouble(0,name,OBJPROP_PRICE,sum[i]/n[i]);
         //--- markers
         name="P."+(string)i;
         ObjectCreate(0,name,OBJ_TEXT,0,0,0);
         ObjectSetString(0,name,OBJPROP_FONT,"Wingdings");
         ObjectSetInteger(0,name,OBJPROP_ANCHOR,ANCHOR_CENTER);
         ObjectSetInteger(0,name,OBJPROP_FONTSIZE,17);
         ObjectSetString(0,name,OBJPROP_TEXT,CharToString(163));
         ObjectSetInteger(0,name,OBJPROP_COLOR,colorLine[i]);
         ObjectSetDouble(0,name,OBJPROP_PRICE,sum[i]/n[i]);
         ObjectSetInteger(0,name,OBJPROP_TIME,sum_time[i]/n[i]);
         //--- integral curves
         name="T"+(string)i+".line"+(string)T[1];
         ObjectCreate(0,name,OBJ_TREND,0,0,0);
         ObjectSetInteger(0,name,OBJPROP_COLOR,colorLine[i]);
         ObjectSetInteger(0,name,OBJPROP_WIDTH,W[i]);
         if(sumprev[i]>0)
           {
            ObjectSetDouble(0,name,OBJPROP_PRICE,0,sumprev[i]);
            ObjectSetInteger(0,name,OBJPROP_TIME,0,T[1]);
            ObjectSetDouble(0,name,OBJPROP_PRICE,1,(sum[i]/n[i]));
            ObjectSetInteger(0,name,OBJPROP_TIME,1,T[0]);
           }
         //--- numerical values of integral characteristics
         name="Text"+(string)i+".control";
         ObjectCreate(0,name,OBJ_TEXT,0,0,0);
         ObjectSetInteger(0,name,OBJPROP_ANCHOR,ANCHOR_LEFT_LOWER);
         ObjectSetInteger(0,name,OBJPROP_FONTSIZE,30);
         ObjectSetInteger(0,name,OBJPROP_COLOR,colorLine[i]);
         string str=DoubleToString((double)n[i]/(double)(n[0]+n[1])*100,1);
         ObjectSetString(0,name,OBJPROP_TEXT,str);
         ObjectSetDouble(0,name,OBJPROP_PRICE,0,(sum[i]/n[i]));
         ObjectSetInteger(0,name,OBJPROP_TIME,0,sum_time[i]/n[i]);
        }
     }
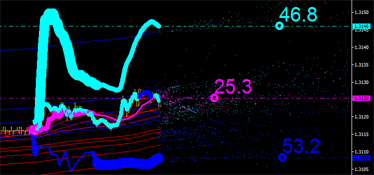
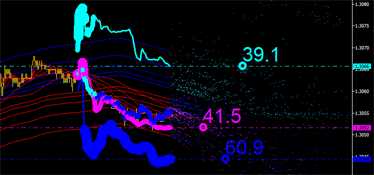
Let us continue our graphical analysis. But something is missing... It appears that we have missed another important emission characteristic. Integral curves were plotted only based on the mean prices. Yet we need to consider the mean time coordinate. Take a look at the figure below and pay special attention to the channel limits:
- The aqua line is the upper limit of the channel.
- The blue line is the lower limit of the channel.
We need to identify the marker that was closer in time to the zero bar.
 |
 |
|---|
Fig. 7. Integral characteristics leading in time. Left: leading upper limit of the channel. Right: leading lower limit of the channel.
This problem can be solved as follows: we add the price line (PRICE_MEDIAN) to the price chart and make the line change its color depending on the color of the marker (aqua or blue) that is closer to the last bar (see Fig. 7). Further, we insert the following code block to the existing code:
//---
   if(n[ArrayMinimum(n)]>0)
     {
      datetime d[2];
      for(int j=0;j<2;j++)
        {
         d[j]=sum_time[j]/n[j];
        }
      int i=ArrayMinimum(d);

      name="Price.line"+(string)T[1];
      ObjectCreate(0,name,OBJ_TREND,0,0,0);
      ObjectSetInteger(0,name,OBJPROP_WIDTH,8);
      ObjectSetDouble(0,name,OBJPROP_PRICE,0,HL(H[1],L[1]));
      ObjectSetInteger(0,name,OBJPROP_TIME,0,T[1]);
      ObjectSetDouble(0,name,OBJPROP_PRICE,1,HL(H[0],L[0]));
      ObjectSetInteger(0,name,OBJPROP_TIME,1,T[0]);
      ObjectSetInteger(0,name,OBJPROP_COLOR,colorLine1[i]);
     }
//---
Now get ready for the next step. What if we try to plot emissions based on integral characteristics of original emissions, something like second-order emissions? After all, those lines also intersect each other and should, consequently, have emission points. Let us see what may come of it. Enhance the previous code block by adding the following lines of code:
      //--- emissions of integral characteristics of the original emissions
      pEmission=EnvMa.CalcPoint(sumprev[0],sum[0]/n[0],sumprev[2],sum[2]/n[2],T[0]);
      if(pEmission.real) // if the intersection point is found, draw it in the chart
        {
         name="test/up"+(string)GTC;
         EnvMa.CreatePoint(name,pEmission,styleUpper2);
        }
      pEmission=EnvMa.CalcPoint(sumprev[1],sum[1]/n[1],sumprev[2],sum[2]/n[2],T[0]);
      if(pEmission.real) // if the intersection point is found, draw it in the chart
        {
         name="test/dn"+(string)GTC;
         EnvMa.CreatePoint(name,pEmission,styleLower2);
        }
And insert the following lines into the data section:
#define     COLOR_2_UPPER  C'102,255,255'
#define     COLOR_2_LOWER  C'51,102,255'
CodeColor   styleUpper2={178,COLOR_2_UPPER,BIG};
CodeColor   styleLower2={178,COLOR_2_LOWER,BIG};
You can check the results in the figure below. We can see new points that do not suggest anything so far.
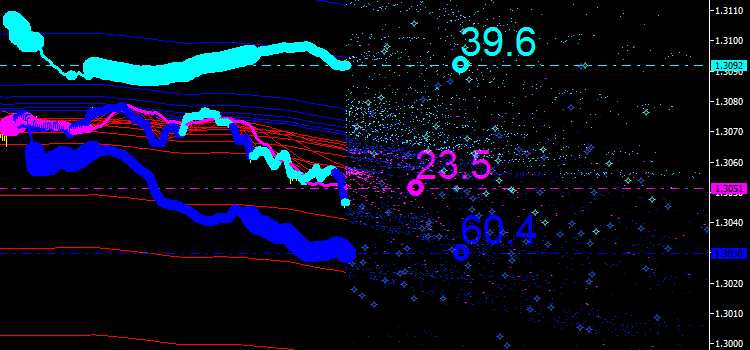
Fig. 8. Emissions of integral lines
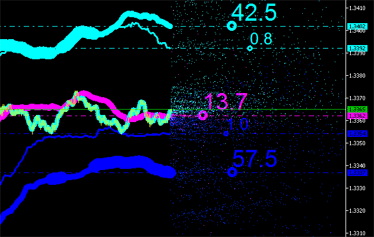
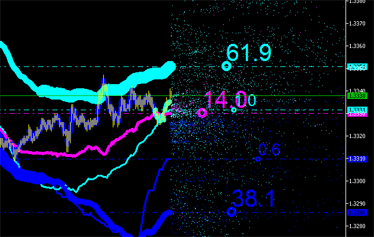
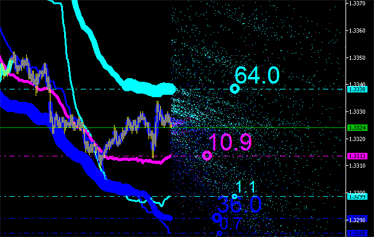
Integral characteristics can obviously also be calculated for new points (see Fig. 9) with their emissions plotted in the chart and so on until it becomes unfeasible!
 |
 |
 |
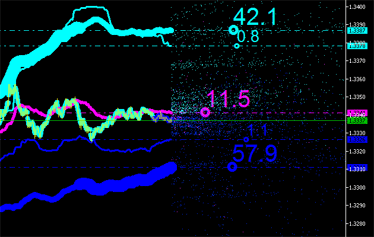 |
Fig. 9. Integral characteristics of emissions
So we plotted everything we needed and obtained the integral characteristics of emissions. We can now proceed to their analysis and development of a trading strategy. But it still seems impossible! What is blocking us now?
Time Series of Emissions
Graphical analysis enables us to study integral characteristics of emissions but it is too resource intensive. If we try to run the proposed code in the visual mode of the strategy tester, the testing speed will soon drop to zero! This is due to the large number of graphical objects in the chart.
So one would naturally want to get rid of all that abundance of points and only leave the integral curves. To solve this problem, we will use special arrays (buffers).
Time series of emissions are specially arranged arrays where information on emissions is accumulated.
They differ from standard time series in that the data they contain is not sequenced by time, even though time is the key field.

Fig. 10. Time series of emission characteristics
These arrays are arranged in such a way that new elements are stored in empty cells or in cells filled with old values. For this purpose, we will use the CTimeEmission class. Here is how it is implemented in the code:
//+------------------------------------------------------------------+
//|                                                 TimeEmission.mqh |
//|                                           Copyright 2013, DC2008 |
//|                           https://www.mql5.com/ru/users/DC2008 |
//+------------------------------------------------------------------+
#property copyright "Copyright 2013, DC2008"
#property link      "https://www.mql5.com/ru/users/DC2008"
#property version   "1.00"
//---
#include <Emission.mqh>
#define ARRMAX       64
#define ARRDELTA     8
//+------------------------------------------------------------------+
//| pIntegral structure                                              |
//+------------------------------------------------------------------+
struct pIntegral
  {
   double            y;       // Y-coordinate of the price point (mean price of the points with the same time)
   datetime          t;       // t-coordinate of the point's time
   int               n;       // n-number of points with the same time
  };
//+------------------------------------------------------------------+
//| Base class for time series of emissions                          |
//+------------------------------------------------------------------+
class CTimeEmission
  {
private:
   pIntegral         time_series_Emission[]; // time series of emission
   int               size_ts; // number of elements in time series
   datetime           t[1];
public:
   //--- method of writing new elements to time series of emission
   void              Write(PointEmission &point);
   //--- method of reading integral characteristics of emissions
   pIntegral         Read();
                     CTimeEmission();
                    ~CTimeEmission();
  };

//+------------------------------------------------------------------+
//|                                                                  |
//+------------------------------------------------------------------+
CTimeEmission::CTimeEmission()
  {
   ArrayResize(time_series_Emission,ARRMAX,ARRMAX);
   size_ts=ArraySize(time_series_Emission);
   for(int i=size_ts-1; i>=0; i--)
      time_series_Emission[i].t=0;
  }
//+------------------------------------------------------------------+
//|                                                                  |
//+------------------------------------------------------------------+
CTimeEmission::~CTimeEmission()
  {
  }
//+------------------------------------------------------------------+
//| The Write method of the CTimeEmission class                      |
//+------------------------------------------------------------------+
void CTimeEmission::Write(PointEmission &point)
  {
   CopyTime(NULL,0,0,1,t);
   size_ts=ArraySize(time_series_Emission);
   for(int k=0;k<size_ts;k++)
     {
      if(time_series_Emission[k].t<t[0]) // find the first empty cell
        {
         if(k>size_ts-ARRDELTA)
           {   // increase the array size, if necessary
            int narr=ArrayResize(time_series_Emission,size_ts+ARRMAX,ARRMAX);
            for(int l=size_ts-1;l<narr;l++)
               time_series_Emission[l].t=0;
           }
         time_series_Emission[k].y=point.y;
         time_series_Emission[k].t=point.t;
         time_series_Emission[k].n=1;
         return;
        }
      if(time_series_Emission[k].t==point.t) // find the first similar cell
        {
         time_series_Emission[k].y=(time_series_Emission[k].y*time_series_Emission[k].n+point.y)/(time_series_Emission[k].n+1);
         time_series_Emission[k].n++;
         return;
        }
     }
  }
//+------------------------------------------------------------------+
//| The Read method of the CTimeEmission class                       |
//+------------------------------------------------------------------+
pIntegral CTimeEmission::Read()
  {
   CopyTime(NULL,0,0,1,t);
   pIntegral property_Emission={0.0,0,0};
   size_ts=ArraySize(time_series_Emission);
   for(int k=0;k<size_ts;k++)
     {
      if(time_series_Emission[k].t>=t[0])
        {
         property_Emission.y+=time_series_Emission[k].y*time_series_Emission[k].n;
         property_Emission.t+=(time_series_Emission[k].t-t[0])*time_series_Emission[k].n;
         property_Emission.n+=time_series_Emission[k].n;
        }
     }
   if(property_Emission.n>0)
     {
      property_Emission.y=property_Emission.y/property_Emission.n;
      property_Emission.t=property_Emission.t/property_Emission.n+t[0];
     }
   return(property_Emission);
  }
Here we can see the implementation of two class methods: writing emission points to time series and reading values of integral characteristics of emissions.
Parsimonious Calculation of Integral Characteristics
Now that we have the time series of emissions, we can start creating a parsimonious algorithm for the calculation of integral characteristics to further develop a trading strategy. Let us update the original Expert Advisor:
//+------------------------------------------------------------------+
//|                                   emission_of_MA_envelope_ts.mq5 |
//|                                           Copyright 2013, DC2008 |
//|                           https://www.mql5.com/ru/users/DC2008 |
//+------------------------------------------------------------------+
#property copyright "Copyright 2013, DC2008"
#property link      "https://www.mql5.com/ru/users/DC2008"
#property version   "1.00"
//---
#include <GetIndicatorBuffers.mqh>
#include <Emission.mqh>
#include <TimeEmission.mqh>
//--- number of point types
#define     NUMBER_TYPES_POINT   3
//--- array for storing the iMA indicator periods
int      MA[]={4,7,11,19,31,51,85};
//--- external variable for storing averaging period of the iEnvelopes indicator
input int ma_period=140; // averaging period of the iEnvelopes indicator
//--- array for storing deviations of the iEnvelopes indicator
double   ENV[]={0.01,0.0165,0.0273,0.0452,0.0747,01234,0.204,0.3373,0.5576,0.9217,1.5237};
//--- array for storing pointers to the iMA indicator
int      handle_MA[];
//--- array for storing pointers to the iEnvelopes indicator
int      handle_Envelopes[];
//--- market data
datetime    T[],prevTimeBar=0;
double      H[],L[];
#define     HL(a, b) (a+b)/2
//--- class instances
CEmission      EnvMa(0,200);
PointEmission  pEmission;
CTimeEmission  tsMA[NUMBER_TYPES_POINT];
pIntegral      integral[NUMBER_TYPES_POINT];
//--- drawing styles for points of emission
#define     DEL            500
//--- arrays for calculation and display of integral characteristics of emissions
double      sumprev[NUMBER_TYPES_POINT];
int         n[NUMBER_TYPES_POINT],W[NUMBER_TYPES_POINT];
color       colorLine[]={clrAqua,clrBlue,clrMagenta};
int         fontPoint[]={30,30,30};
int         fontMarker[]={16,16,16};
//+------------------------------------------------------------------+
//| Expert initialization function                                   |
//+------------------------------------------------------------------+
int OnInit()
  {
   ArraySetAsSeries(T,true);
   ArraySetAsSeries(H,true);
   ArraySetAsSeries(L,true);
   ArrayInitialize(sumprev,0.0);
//---
   int size=ArraySize(MA);
   ArrayResize(handle_MA,size);
//--- create a pointer to the object - the iMA indicator
   for(int i=0; i<size; i++)
     {
      handle_MA[i]=iMA(NULL,0,MA[i],0,MODE_SMA,PRICE_MEDIAN);
      //--- if an error occurs when creating the object, print the message
      if(handle_MA[i]<0)
        {
         Print("The iMA object[",MA[i],"] has not been created: Error = ",GetLastError());
         //--- forced program termination
         return(-1);
        }
     }
//+------------------------------------------------------------------+
   size=ArraySize(ENV);
   ArrayResize(handle_Envelopes,size);
//--- create a pointer to the object - the iEnvelopes indicator
   for(int i=0; i<size; i++)
     {
      handle_Envelopes[i]=iEnvelopes(NULL,0,ma_period,0,MODE_SMA,PRICE_MEDIAN,ENV[i]);
      //--- if an error occurs when creating the object, print the message
      if(handle_Envelopes[i]<0)
        {
         Print("The iEnvelopes object[",ENV[i],"] has not been created: Error = ",GetLastError());
         //--- forced program termination
         return(-1);
        }
     }
//---
   return(0);
  }
//+------------------------------------------------------------------+
//| Expert deinitialization function                                 |
//+------------------------------------------------------------------+
void OnDeinit(const int reason)
  {
//---

  }
//+------------------------------------------------------------------+
//| Expert tick function                                             |
//+------------------------------------------------------------------+
void OnTick()
  {
//--- market data
   CopyTime(NULL,0,0,2,T);
   CopyHigh(NULL,0,0,2,H);
   CopyLow(NULL,0,0,2,L);
//--- fill the declared arrays with current values from all indicator buffers
   string name;
   uint GTC=GetTickCount();
//---- indicator buffers
   double   ibMA[],ibMA1[];      // arrays for the iMA indicator
   double   ibEnvelopesUpper[];  // array for the iEnvelopes indicator (UPPER_LINE)
   double   ibEnvelopesLower[];  // array for the iEnvelopes indicator (LOWER_LINE)
   for(int i=ArraySize(handle_MA)-1; i>=0; i--)
     {
      if(!CopyBufferAsSeries(handle_MA[i],0,0,2,true,ibMA))
         return;
      //---
      for(int j=ArraySize(handle_Envelopes)-1; j>=0; j--)
        {
         if(!GetEnvelopesBuffers(handle_Envelopes[j],0,2,ibEnvelopesUpper,ibEnvelopesLower,true))
            return;
         //--- find the intersection point of the iEnvelopes(UPPER_LINE) and iMA indicators
         pEmission=EnvMa.CalcPoint(ibEnvelopesUpper[1],ibEnvelopesUpper[0],ibMA[1],ibMA[0],T[0]);
         if(pEmission.real) // if the intersection point is found, add it to the time series of emission
            tsMA[0].Write(pEmission);
         //--- find the intersection point of the iEnvelopes(LOWER_LINE) and iMA indicators
         pEmission=EnvMa.CalcPoint(ibEnvelopesLower[1],ibEnvelopesLower[0],ibMA[1],ibMA[0],T[0]);
         if(pEmission.real) // if the intersection point is found, add it to the time series of emission
            tsMA[1].Write(pEmission);
        }
      //---
      for(int j=ArraySize(handle_MA)-1; j>=0; j--)
        {
         if(i!=j)
           {
            if(!CopyBufferAsSeries(handle_MA[j],0,0,2,true,ibMA1))
               return;
            //--- find the intersection point of the iMA and iMA indicators
            pEmission=EnvMa.CalcPoint(ibMA1[1],ibMA1[0],ibMA[1],ibMA[0],T[0]);
            if(pEmission.real) // if the intersection point is found, add it to the time series of emission
               tsMA[2].Write(pEmission);
           }
        }
     }
//--- deletion of the graphical objects of emission not to stuff the chart
   if(T[0]>prevTimeBar)
     {
      prevTimeBar=T[0];
      //---
      for(int i=ArraySize(n)-1; i>=0; i--)
         sumprev[i]=integral[i].y;
      //---
      for(int obj=ObjectsTotal(0,0,-1)-1;obj>=0;obj--)
        {
         string obj_name=ObjectName(0,obj,0,OBJ_TREND);
         datetime obj_time=(datetime)ObjectGetInteger(0,obj_name,OBJPROP_TIME);
         if(obj_time<T[0]-DEL*PeriodSeconds())
            ObjectDelete(0,obj_name);
        }
      Comment("Emission © DC2008   Graphical objects = ",ObjectsTotal(0,0,-1));
     }
//--- calculation of integral characteristics of emission
   for(int i=ArraySize(n)-1; i>=0; i--)
      integral[i]=tsMA[i].Read();
//--- displaying integral characteristics of emission
   ArrayInitialize(W,5);
   if(integral[0].n>integral[1].n)
     {
      W[0]=20;
      W[1]=10;
     }
   else
     {
      W[0]=10;
      W[1]=20;
     }
   for(int i=ArraySize(n)-1; i>=0; i--)
     {
      //--- horizontal lines of mean prices
      name="H.line."+(string)i;
      ObjectCreate(0,name,OBJ_HLINE,0,0,0,0);
      ObjectSetInteger(0,name,OBJPROP_COLOR,colorLine[i]);
      ObjectSetInteger(0,name,OBJPROP_STYLE,STYLE_DASHDOT);
      ObjectSetInteger(0,name,OBJPROP_WIDTH,1);
      ObjectSetDouble(0,name,OBJPROP_PRICE,integral[i].y);
      //--- markers
      name="P."+(string)i;
      ObjectCreate(0,name,OBJ_TEXT,0,0,0);
      ObjectSetString(0,name,OBJPROP_FONT,"Wingdings");
      ObjectSetInteger(0,name,OBJPROP_ANCHOR,ANCHOR_CENTER);
      ObjectSetInteger(0,name,OBJPROP_FONTSIZE,fontMarker[i]);
      ObjectSetString(0,name,OBJPROP_TEXT,CharToString(163));
      ObjectSetInteger(0,name,OBJPROP_COLOR,colorLine[i]);
      ObjectSetDouble(0,name,OBJPROP_PRICE,integral[i].y);
      ObjectSetInteger(0,name,OBJPROP_TIME,integral[i].t);
      //--- integral curves
      name="T"+(string)i+".line"+(string)T[1];
      ObjectCreate(0,name,OBJ_TREND,0,0,0);
      ObjectSetInteger(0,name,OBJPROP_COLOR,colorLine[i]);
      ObjectSetInteger(0,name,OBJPROP_WIDTH,W[i]);
      if(sumprev[i]>0)
        {
         ObjectSetDouble(0,name,OBJPROP_PRICE,0,sumprev[i]);
         ObjectSetInteger(0,name,OBJPROP_TIME,0,T[1]);
         ObjectSetDouble(0,name,OBJPROP_PRICE,1,integral[i].y);
         ObjectSetInteger(0,name,OBJPROP_TIME,1,T[0]);
        }
      //--- numerical values of integral characteristics
      if(integral[0].n+integral[1].n>0)
        {
         name="Text"+(string)i+".control";
         ObjectCreate(0,name,OBJ_TEXT,0,0,0);
         ObjectSetInteger(0,name,OBJPROP_ANCHOR,ANCHOR_LEFT_LOWER);
         ObjectSetInteger(0,name,OBJPROP_FONTSIZE,fontPoint[i]);
         ObjectSetInteger(0,name,OBJPROP_COLOR,colorLine[i]);
         string str=DoubleToString((double)integral[i].n/(double)(integral[0].n+integral[1].n)*100,1);
         ObjectSetString(0,name,OBJPROP_TEXT,str);
         ObjectSetDouble(0,name,OBJPROP_PRICE,0,integral[i].y);
         ObjectSetInteger(0,name,OBJPROP_TIME,0,integral[i].t);
        }
     }
  }
The code has become shorter, while the calculation speed has increased. Now you can test and optimize your trading robots without visualization!
Use of Integral Characteristics in Trading
Integral characteristics can be used as a generator of signals for:
- channel breakthrough,
- intersection with each other or the price,
- change in the direction.
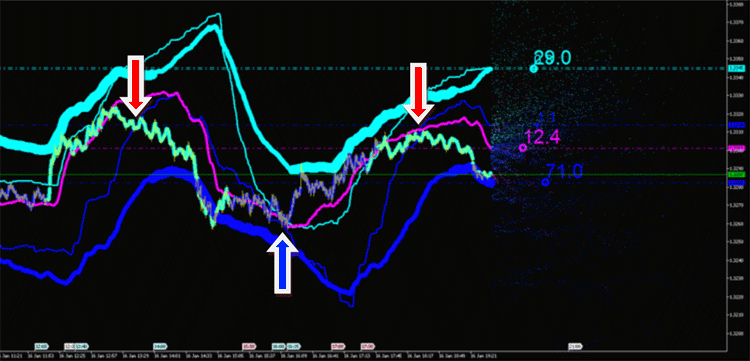
Fig. 11. Trading signals at intersections of integral characteristics of emissions
Conclusion
- The calculation of integral characteristics of indicator emissions provides new tools and methods for market analysis (time series).
- Using time series, we have managed to increase the speed of calculations of integral characteristics.
- And it has opened up a possibility for us to develop automated trading strategies that use emissions.
Translated from Russian by MetaQuotes Ltd.
Original article: https://www.mql5.com/ru/articles/610
 MetaTrader 4 Expert Advisor exchanges information with the outside world
- Free trading apps
- Over 8,000 signals for copying
- Economic news for exploring financial markets
You agree to website policy and terms of use
Here's one...
Take a look video
Video on the topic
Video on emission
DC2008, can you please tell me what the extra lines are (blue with a value of 0.8 and blue with a value of 1.1)?