Active Pivot Levels
- Indikatoren
- Robert Gerald Wood
- Version: 1.30
- Aktualisiert: 4 November 2021
- Aktivierungen: 5
Pivot-Ebenen sind eine etablierte technische Ebene, die in jedem Markt anerkannt ist.
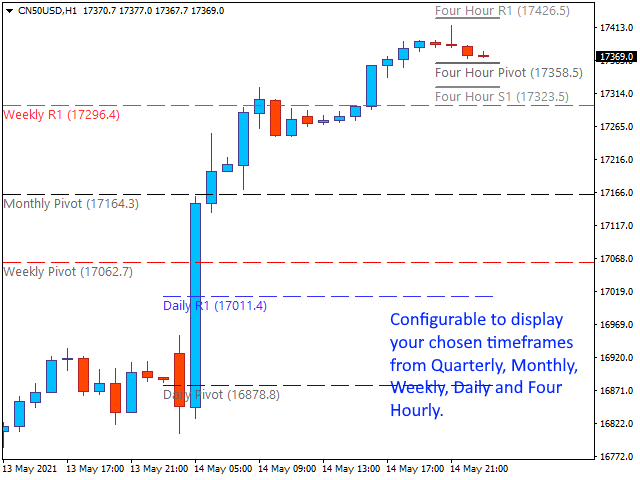
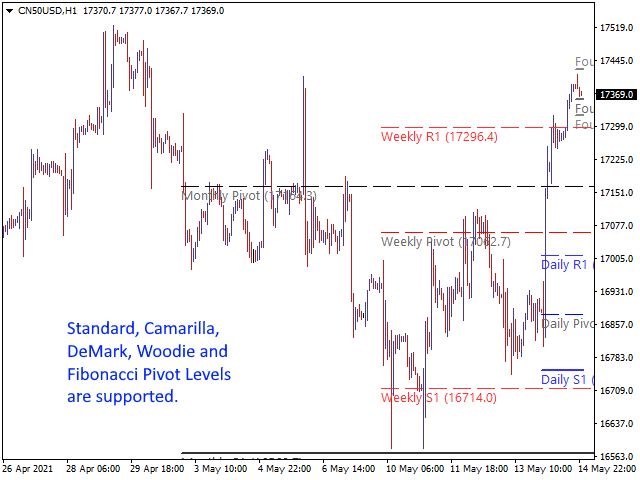
Dieser Indikator zeichnet die aktuellen vierteljährlichen, monatlichen, wöchentlichen, täglichen und vierstündlichen Pivots für jedes Symbol auf dem Chart. Sie können auch die Unterstützungs- und Widerstandsstufen für jeden Zeitraum anzeigen und auswählen, welche von Stufen 1 bis 4 angezeigt werden sollen.
Wählen Sie den Pivot-Typ aus:
- Standard
- Camarilla
- DeMark
- Woodie
- Fibonacci
Bitte beachten Sie, dass DeMark-Pivots gemäß der ursprünglichen Spezifikation ein einzelnes Unterstützungs- und Widerstandsniveau haben.
Die Indikatorwand ändert die Art und Weise, wie die Linien gezeichnet werden, wenn die Linie vom Preis berührt wurde. Dies kann sehr hilfreich sein und die Stärke der Linienunterstützung oder des Widerstands nimmt nach dem Berühren erheblich ab.
Sie können wählen, ob Sie das prognostizierte Pivot-Level für jeden der Zeiträume anzeigen möchten. Dies wird die gleiche Berechnung wie die normalen Pivots verwenden, funktioniert aber auf den derzeit unvollständigen Zeitrahmen. Als solches wird es am besten gegen Ende dieses Zeitraums verwendet, wenn der Preis bereits den größten Teil seiner Spanne abgedeckt hat.
Einstellungen
https://www.mql5.com/en/blogs/post/746511
Dies ist ein sehr konfigurierbarer Indikator, sodass Sie ihn nach Belieben zum Laufen bringen können.

Another great indicator form this author. Runs perfectly, does not slow down MT4 like other pivot indicators. Fully customizable for all styles of trading whether you only need 1 pivot line or if you need many pivot and SR lines. Pivot line changes style once touched by price, great feature. New toggle button keeps your charts clean when you don't need to see the lines. Author is very responsive and helpful.