Technische Indikatoren für den MetaTrader 5 - 60

Informações Importantes sobre o ArrowHacker (Não repinta! Não gera sinais atrasados!)
Se você está procurando um indicador que cumpre aquilo que promete, você acabou de encontrar! O ArrowHacker irá superar todas as suas expectativas com certeza! E o melhor de tudo, é só colocar na sua conta, ligar e já começar a lucrar!
O ArrowHacker é um sistema profissional de trade criado para as plataformas MT4 & MT5 e otimizado para trabalhar com qualquer ativo na plataforma MetaTrader 5, sejam moeda

ImbaTrend Runner - is the trend following manual system for forex/crypto market. It defines medium-term trends and works with it in intraday mode. System shows enter points, profit and loss targets. As a rule profit targets are 2-3 X bigger than loss targets. Indicator is AutoAdaptive and it automatically updates it's settings during trading. Indicator is sensitive to market changes, regular updates helps to stay in relevant trend. Main Indicator's Features Signals are not repaint, late or disap

Dieser Indikator zeigt gefilterte Preisinformationen an in Form eines Candlestick-Charts mit 64 Farbbereichen. Perfekt nützlich, um die Stärke der Richtung der Preisbewegung zu bestimmen. Dieser Indikator hat keine Einstellungen. Alle 64 Farben sind bereits im Programm enthalten, je heller die blaue Farbe, desto stärker die Kraft der Kaufbewegung, und je heller die rote Farbe, desto stärker die Verkaufsbewegung. ///////////////////////////////////////////////////////// Ich hoffe, dieser Indikat
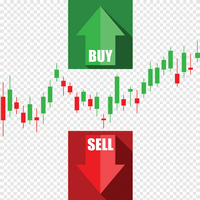
Dieser Indikator verwendet lokale Hochs und Tiefs der Preisreihe. Nach dem Hervorheben der Extrema werden ihre Werte geglättet. Dadurch werden zwei Kanäle aufgebaut - extern und intern. Der interne Kanal zeigt die Grenzen, wenn die Preisbewegung strikt einem linearen Trend folgt. Der äußere Kanal zeigt die Grenzen für die Preisbewegung mit einem logarithmischen Trend. Nach der Berechnung der Kanäle analysiert der Indikator die tatsächliche Preisbewegung und bietet Empfehlungen zum Öffnen und Sc

Market Conditions indicators can provide support to the trader so that he can identify market trends over a given period. The purpose of this model is to allow traders to have a global vision on the exchange markets. And the formula that we develop allow to scan the major currencies in the exchange market. The model uses a purely statistical formula which is based on the historical data of the major currencies "eur, usd, gbp, jpy, aud, nzd, cad, chd". Of which 28 currency pairs are traded. It

ROC Price Histogram Alert ist ein Momentum-basierter technischer Indikator, der die prozentuale Preisänderung zwischen dem aktuellen Preis und dem Preis vor einer bestimmten Anzahl von Perioden misst. ROC wird mit einem Histogramm gegen Null aufgetragen, wobei sich der Indikator nach oben in den positiven Bereich bewegt, wenn Preisänderungen nach oben gehen, und sich in den negativen Bereich bewegt, wenn Preisänderungen nach unten gehen.
Der Hauptschritt bei der Berechnung des ROC-Zeitraums i
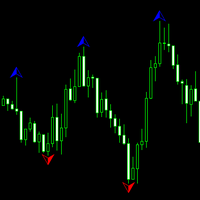
An indicator for all timeframes with a configurable number of bars for calculating fractals. Suitable for determining extremes of both lower and higher order, by which it is possible to determine the patterns of technical analysis, as well as divergences.
The indicator has one adjustable parameter - the number of bars for extremum calculation. It is also possible to change the color characteristics.

Der TickCounter-Indikator zählt Aufwärts- und Abwärtsticks auf jedem neuen Balken.
Die Berechnung beginnt ab dem Moment, in dem der Indikator auf dem Chart platziert wird.
Histogrammbalken stellen dar: Gelbe Balken - Gesamtzahl der Ticks; Blaue Balken - Ticks UP; Rote Balken – Ticks NACH UNTEN. Wenn der blaue Balken nicht sichtbar ist, gibt es mehr Abwärtsticks und der rote Balken wird über dem blauen angezeigt (die rote Ebene befindet sich über der blauen). MT4 version: https://www.mql5.c
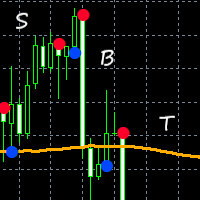
This indicator combines input from two trend filters and the ADX. You can change the trend line on chart to your preference. Great for scalping and channels. Features alert function and parameter TrendLinePeriod.
How to use: Simply attach to any chart. Sell on red bullets, with trend line above price. Enter on bullets closest to this line. Buy on blue bullets, with trend line below price. Enter on bullets closest to this line. Best results when checking the higher time frames before entering t

The idea behind this indicator is very simple , First it contains 2 mechanisms to place your trades:
1- Enter the Pips you want to duplicate to price levels. 2- Automatically let the indicator specify the largest Buy / Sell Volume Candle and place duplicated levels based on the candle itself.
How it works: 1- Enter the Pips you want to duplicate to price levels: 1- once the indicator is loaded you will need first to Specify the number of pips in the indicator Configuration window ,you can

Ichimoku Trend Finder is a multi symbol multi timeframe trend dashboard that helps traders to monitor and identify potential market trends from one chart. This panel scans the Ichimoku Kinko Hyo indicator in 28 configurable instruments and 9 timeframes for classic Ichimoku trend signals with a deep scan feature to scan all market watch symbols (up to 1000 instruments!).
Download Demo here (Scans only M1 and M6) Settings description here MT4 version here
After the purchase, don't fo
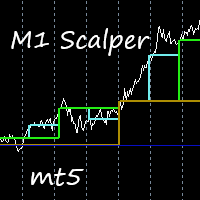
This indicator is excellent for scalping on the M1 or M5 chart. Uses a special algorithm for the lines. No need to set up the indicator. Does not feature any alerts and is best used manually after visually confirming the line displays. NB: Make sure to download M1 history before testing and use.
How to use: Simply attach to M1 or M5 chart. Zoom chart out completely. Sell when all lines above the white line (PriceLine). Sniper line crosses above white line. Buy when all lines below the white li

This indicator gives you arrows, two SR lines and a golden trend line. Uses a special trend algorithm to plot the arrows, combined with support and resistance inputs. Perfect for channel trading. Features alert functions.
Parameter TrendArrowPeriod. Parameter TrendLinePeriod. (Change to your preference) How to use: Simply attach to any chart with default settings. Zoom in the chart, to see the two blue SR lines and arrows more clearly. When the blue SR line is below the price, golden trend line

The Price Elevator indicator is developed to help you figure out the general long-term trend of the market. If the price is above the Green separator line, this is a clear indication the bulls are in control. Similarly, the bears are in control if the price continues to trend below the red separator line. Download Price Elevator MT4
Trend Re-entry In this case you would plan your buy entries above the green dotted box (make sure to set the Buy / Sell Retracement Floor=30). The SL should be

Der WAPV ADH Supply and Demand Indikator ist Teil einer Reihe von Indikatoren namens (Wyckoff Academy Wave Market) Der WAPV ADH Supply and Demand Indicator for MT5 soll die Gewinnerseite zwischen Käufern und Verkäufern identifizieren. Seine Lesung ist sehr einfach, wenn die grüne Linie über der roten Linie liegt, herrscht Nachfrage, wenn die rote Linie über der grünen Linie liegt, herrscht Versorgung. Je positiver die grünen und roten Linien, desto höher die Eingangslautstärke, je näher an Null

Der WAPV ADH Supply and Demand Forex Indicator ist Teil einer Reihe von Indikatoren namens (Wyckoff Academy Wave Market) Der WAPV ADH Forex Supply and Demand Indicator for MT5 soll die Gewinnerseite zwischen Käufern und Verkäufern identifizieren. Seine Lesung ist sehr einfach, wenn die grüne Linie über der roten Linie liegt, herrscht Nachfrage, wenn die rote Linie über der grünen Linie liegt, herrscht Versorgung. Je positiver die grünen und roten Linien, desto höher die Eingangslautstärke, je nä

WA_PV_BOX_EFFORT X ERGEBNIS für MT5 Der WAPV Box Effort x Result Indicator ist Teil der Package Indicators-Gruppe (Wyckoff Academy Wave Market). Der WAPV Box Effort x Result Indicator für MT5 hilft Ihnen beim Lesen von Preis und Volumen. Seine Lektüre besteht darin, bei der Identifizierung von Aufwand x Ergebnis zu helfen in Wellen, die durch den Graphen erzeugt werden. Der WAPV Box Effort x Result Indicator für MT5 bedeutet, wenn das Kästchen grün ist, dass das Volumen der Nachfrage entspricht,

Der WAPV Price and Volume Indicator for MT5 ist Teil des Toolsets (Wyckoff Academy Wave Market) und (Wyckoff Academy Price and Volume). Der WAPV-Preis- und Volumenindikator für MT5 wurde entwickelt, um die Volumenbewegung auf dem Chart auf intuitive Weise einfach zu visualisieren. Damit können Sie die Momente des Spitzenvolumens und Momente beobachten, in denen der Markt kein professionelles Interesse hat Identifizieren Sie Momente, in denen sich der Markt durch Trägheit bewegt und nicht durch d

Der Weis Wave Bouble Side Indicator für MT5 ist Teil des Toolkits (Wyckoff Academy Wave Market) Der Weis Wave Bouble Side Indicator für MT5 wurde basierend auf dem bereits etablierten Weis Wave von David Weis entwickelt. Der Weis Wave Double Side Indikator liest den Markt in Wellen, wie er gemacht wurde von R. Wyckoff im Jahr 1900. Es hilft bei der Identifizierung von Aufwand x Ergebnis, Ursache und Wirkung sowie Angebot und Nachfrage Sein Unterschied besteht darin, dass es unterhalb der Nullach

Der Weis Wave Bouble Side Indicator für MT5 ist Teil des Toolkits (Wyckoff Academy Wave Market) Der Weis Wave Bouble Side Indicator für MT5 wurde basierend auf dem bereits etablierten Weis Wave von David Weis entwickelt. Der Weis Wave Double Side Indikator liest den Markt in Wellen, wie es R. Wyckoff im Jahr 1900 tat. Es hilft bei der Identifizierung von Aufwand x Ergebnis, Ursache und Wirkung sowie Angebot und Nachfrage Sein Unterschied besteht darin, dass es unterhalb der Nullachse verwendet w

VSA Candle Signal für MT5 ist Teil des Toolsets (Preis und Volumen der Wyckoff Academy). Seine Funktion besteht darin, die Korrelation von Preis und Volumen bei der Bildung der Kerze zu identifizieren. Seine Erstellung basiert auf den Prämissen von R. Wyckoff , einem Vorläufer in der Analyse von Preis und Volumen. Das VSA-Kerzensignal für MT5 hilft bei der Entscheidungsfindung und hinterlässt Ihre Lektüre klarer und flüssiger. Siehe die Bilder unten.

Der Force and Weakness Indicator for MT5 Forex ist Teil des (Wyckoff Academy Price and Volume) Toolkits Der Force and Weakness Indicator for MT5 Forex wurde entwickelt, um die Stärke und Schwäche des Volumens auf kumulierte Weise zu identifizieren. Die Vision eines Panoramas zwischen Preis und Volumen ermöglichen. Der Indikator kann als Oszillator und als Histogramm verwendet werden. Wie üblich hat es alle Prämissen der drei Gesetze von R. Wyckoff, wenn es mit dem Preis kombiniert wird: Ursache

Der Force and Weakness Indicator for MT5 Real Volume ist Teil des (Wyckoff Academy Price and Volume) Toolsets Der Force and Weakness Indicator for MT5 Real Volume wurde entwickelt, um die Stärke und Schwäche des Volumens auf kumulierte Weise zu identifizieren. Die Vision eines Panoramas zwischen Preis und Volumen ermöglichen. Der Indikator kann als Oszillator und als Histogramm verwendet werden. Als Fantasie hat es alle Prämissen der drei Gesetze von R. Wyckoff , wenn man es mit dem Preis kombin

The Spots Indicator can be used for Entering and Exiting your trades based on the common candlestick patterns such as: engulfing, hanging man, doji etc. It is designed to publish desktop and mobile notification every time a signal is triggered. However, it is worth noting that this indicator is recommended to be used with other indicator for confirming the entries. It is best to use it with the Investment Castle Trend Lines indicator and the Supply and Demand indicator .
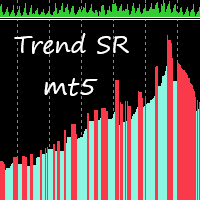
This indicator takes input from Support and Resistance levels, combined with a special trend filter. Easily spot tops and bottoms, and trade with more confidence. Great for scalping. This indicator can be used on all time frames and pairs. Features alert function.
No need to set up the indicator.
How to use: Simply attach to any chart. Zoom chart out completely. Red histogram line color = Selling opportunities. Blue histogram line color = Buying opportunities. See pictures below. To spot high
Tool converted from tradingview indicator. Modified version with pivot points calculated in a more intuitive way.
This tool displays relative volatility and directional trend. Excellent way to pickup diversions and reversals. Length can be lowered to 11 or 13 in settings to show price range.
Can be used to identify patterns such as parallel channels and likely direction of price action.

Dieser Indikator verwendet die sogenannten "bösen" Zahlen als Gewichtskoeffizienten. Ihr Gegenteil sind "abscheuliche" Zahlen, die auch in diesem Indikator dargestellt werden. Die Unterteilung von Zahlen in diese beiden Klassen ist mit dem Hamming-Gewicht verbunden, das durch die Anzahl der Einheiten in der binären Schreibweise einer bestimmten Zahl bestimmt wird. Die Verwendung dieser Zahlen als Gewichtungsfaktoren ergibt einen Trendfolgeindikator. Darüber hinaus geben abscheuliche Zahlen eine
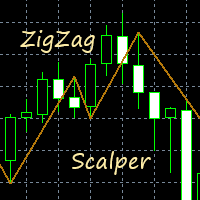
This indicator gives you a modified ZigZag, combined with a trend filter. Great for scalping. Perfect for channel trading. Features alert functions. No need to set up the indicator. How to use: Simply attach to any chart. Buy when the golden line stops below the price. Sell when the golden line stops above the price. It also helps to keep the audible alert set to true. Best results when checking two or more timeframes before entering trades on the lower time frames. Use as you see fit for your

The purpose of the inidcator is to identify the reversal point.
The blue arrow is buy signal and the yellow star is its stop loss. The red arrow is sell signal and the yellow star is its stop loss. Please note that the singal is against trend,it could be continual fail. Alert feature: if there is a signal, the indicator will send alerts of popup window,email or mobile push. Inputs: Popup Window Alert: it is false in default Email Alert : it is false in default Mobile Push Alert: it is false in

The ADX indicator (average directional index) is a technical tool designed to measure the strength of a market trend. The ADX indicator is used for various purposes such as measuring the strength of a trend, finding a trend and a trading range, and as a filter for various Forex trading strategies.
Some of the best trading strategies are based on following the market trend. There are also strategies through which traders make profit by trading against the trend. In any case, if you can identif
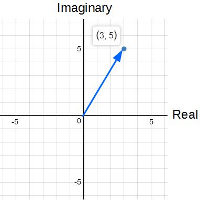
ComplexVector is an indicator based on market analysis using the mathematical apparatus of complex numbers. The essence of the indicator is that it, with clear impulses, indicates the points in time when it is necessary to make decisions. The impulses are like a cardiogram showing the heartbeat of the market.
For example: it may be the moment of planning a new entry. this may be the moment to exit the position. if you work with a series that is in a drawdown, you are recommended to close it i
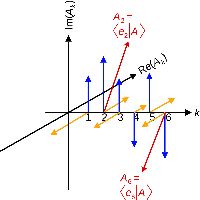
ComplexVectorHL is an indicator that characterizes the change in short-term market trends. The indicator is based on market analysis using the mathematical apparatus of complex numbers. The essence of the indicator is that it, with clear impulses, indicates the points in time when it is necessary to make decisions. The impulses are like a cardiogram showing the heartbeat of the market. The indicator has pulses only in one direction (unlike the previous development of ComplexVector), the pulses
Hello Everyone ,
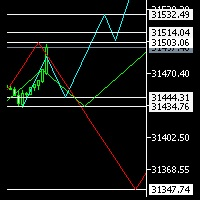
I am not an Elliot pro , but I promise to let you see it in a different way , have you ever considered to see 3 probabilities of different time frames on same chart ? this will not only enhance your trades entry , but will give you confidence and certainty when everything is not clear.
in my indicator you will be able to select 3 time frames of your choice , define number of candles per each time frame , give the color per each trend (Bearish or Bullish), not only that , yo

Fast Trade Detector (FTD) - Самый правдивый индикатор, который показывает истинное
настроение Большого Игрока.
На бирже есть Игрок, у которого есть всё для того, чтобы быть в первых рядах в книге торговых
приказов (биржевом стакане). Эти сделки как индикатор рыночного настроения сильного игрока.
Вы поймёте, что всё не совсем так, как представляли раньше. Вам откроются алгоритмы и стратегии
крупного участника рынка. Исполнение индикатора в виде гистограммы в подвале графика. Гистогра

Fundamentação teórica A VWAP é uma média móvel ajustada pelo volume, ou seja, o peso de cada preço corresponde ao volume de ações negociadas no período, dando mais importância ao período em que se tenha mais negociações. A Orion Vwap Bands permite que o usuário use plote 8 bandas que podem ser utilizadas como suportes e resistências para o preço. Cada banda é calculada a partir da Vwap Tradicional:
Ex.: Se escolhermos o valor 0.25 para a plotagem da Banda 1, pega-se o preço da Vwap e acrescen

Der AW-Kerzenmuster-Indikator ist eine Kombination aus einem fortschrittlichen Trendindikator und einem leistungsstarken Kerzenmuster-Scanner. Es ist ein nützliches Werkzeug, um die dreißig zuverlässigsten Candlestick-Muster zu erkennen und hervorzuheben. Darüber hinaus ist es ein aktueller Trendanalysator, der auf farbigen Balken mit einem basiert Plug-in-Multi-Timeframe-Trendpanel, das in der Größe verändert und positioniert werden kann. Eine einzigartige Fähigkeit, die Anzeige von Muste
The indicator plots the Up and Down arrows on every price swing made by the classic Zigzag indicator. When Zigzag makes a new swing low, a green arrow is plotted. Likewise, a red arrow is plotted when Zigzag makes a new swing high.
Features
Compared to the classic ZigZag, it marks the swing points more effectively. It helps to identify the forming chart patterns in advance. It comes with a Multi-Timeframe scanner which shows the Zigzag direction on each timeframe. All Metatrader alerts includ

This indicator shows the bullish/bearish market regime using the no. of bars moved above and below the overbought/oversold region of RSI. The green histogram depicts the Bull power, while the red depicts the Bear power.
Features
It can be used to enter new trades or validates trades from other strategies or indicators. It comes with a multi-timeframe scanner that scans the bulls/bears power across all the time frames. It's a perfect choice to boost the confidence of new traders via validatin
The indicator measures the buying and selling force between the buyers and sellers in the form of a histogram/oscillator by using a BOP equation:
BOP = Moving Average of [close – open)/(high – low)]
Igor Levshin first introduced the Balance of power in the August 2001 issue of Technical Analysis of Stocks & Commodities magazine.
Features
Quickly find the buying and selling pressure among the traders. It comes with simple inputs and an interface. All Metatrader alerts included.
Appli
SSL stands for Semaphore Signal Level channel. It consists of two moving averages applied to high and low, respectively, to form a price following envelope. Buy Signal: When the price closes above the higher moving average. Sell Signal: When the price closes below the lower moving average.
Features It comes with a multi-timeframe scanner that scans for the new signals across all the timeframes. A straightforward personal implementation of the classic SSL effortlessly finds the trend directio

Back to the Future это индикатор который определяет направление тренда. Определяет четыре уровня для роста и падения 1-й уровень флета 2 -й уровень коррекции 3-й уровень продолжения тренда и 4-й уровень возможного разворота. Индикатор рисует трендовые линии краткострочного и долгострочного тренда. Так же индикатор определяет динамические сел и бай зоны в виде прямоугольников. От ближайшего максимума или минимума рисует фибо уровни для определения целей движения. В меню индикатора отключа

It's a modified, and improved version of the classic HMA developed initially by Alan Hull in 2005. It uses a combination of three weighted moving averages to reduce the lag. Long Entry: When HMA turns blue from red with an upward slope. Short Entry: When HMA turns red from blue with a downward slope.
Features It comes with a multi-timeframe scanner which scans for the new signals across all the timeframes. HMA reduces lags which usually come with the traditional moving averages. Effectively

Dieser Indikator basiert auf Spitzbogenformen. Solche Formen werden in der Aerodynamik und Raumfahrttechnik verwendet. Sogar Kugeln haben eine Art Spitzbogenform. Die Verwendung solcher Formen in einem technischen Indikator ermöglicht es, einen Kompromiss zwischen der Empfindlichkeit des Indikators und seiner Stabilität zu erreichen. Das gibt zusätzliche Möglichkeiten bei seiner Anwendung. Indikatorparameter: iType - der Typ der Spitzbogenform. iPeriod - Indikatorperiode. iFactor ist ein

place a vwap line starting from the line placed on the chart parameters: tick_mode: enable to use ticks instead of bars. this uses a lot more cpu processing power prefix: prefix to add for line created by indicator line_color: set the color of the line created line_style: set the line style of the line created applied_price: set the price of bar to use of the bar std_dev_ratio: set the multiplier for the std dev channel
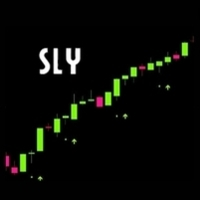
indicador para opciones binarias que siempre funciona en favor de la tendencia principal , por favor identifiquela en temporalidades altas para poder tomar operaciones en las temporalidades bajas , puede usar una media movil de cualquier periodo para identificarla , recomendada la de 50 periodos exponencial ideal para operar el mercado de indices sinteticos del broker deriv y/o divisas, se puede acompañar de cualquier oscilador usando unicamente el nivel 50 para validar tendencia alcista o baji

Indicator developed by the Brazilian and analyst Odir Aguiar (Didi), consists of "Moving Averages", famously known as "Didi needles", where it allows the viewing of reversal points.
The concept is very simple, when you enter 3 Moving Averages on display, a period equal to 3, one equal to 8 and the other equal to 20, then the formation of the indicator that works in axis or line center equal to 0 (zero) appears. ). Moving averages must intersect when approaching line 0.
The scanner monitor

This is the famous Sunflower indicator for Metatrader5. This indicator marks possible tops and bottoms on price charts. The indicator identifies tops and bottoms in the asset's price history, keep in mind that the current sunflower of the last candle repaints, as it is not possible to identify a top until the market reverses and it is also not possible to identify a bottom without the market stop falling and start rising. If you are looking for a professional programmer for Metatrader5, please

Volatility Vision: Best Solution for any Newbie or Expert Trader!
User manual: Click
The "Volatility Vision" s how levels on the chart, may be used to enter and exit positions, and it's a useful indicator to add it in trading system. Indicator works on all currency pairs and stocks. This is a great advantage and new in trading. Intra-weekly traders can use the "volatility limits" information to comfortably open and close orders.
Advantages over standard indicators Removes false e

In the Forex trading system, the Pivot Points trading method is a classic trading strategy. Pivot Points is a very simple resistance support system. Based on yesterday’s highest, lowest and closing prices, seven price points are calculated, including one pivot point, three resistance levels and three support levels.
The resistance line and the support line are one of the tools that are often used in technical analysis, and the role of the support line and the pressure line can be mutually tran

!! FLASH SALE !! Over 80% off !! For ONE week only. Now only $47 - normally $297! >>> Ends on 30 June 2023 - Don't miss it!
Buy and Sell Arrows On The Chart According To Price Action Sends Alerts On MT5 To Your Phone To You Email
Does NOT repaint. Works on any pair, any timeframe.
10 Activations allowed so you are free from limitations. MT4 Version here . For spreads from a tiny 0.1 pips RAW/ECN Accounts, click here . Check out my Waka Esque EA signal here: >> High Ri
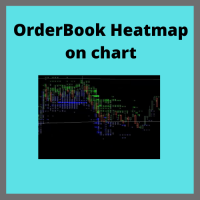
Ever needed a Boomap-like indicator for you MT5? Here you are!!
FULL WORKING DEMO VERSION available on Channel:
https://www.mql5.com/en/channels/011107AFAAE3D801
With this indicator you will see all the important levels, in which the largest bid and ask order are sitting. This indicator will show show all the history on limit order planed on the book. It will work only for futures broker who support level 2 order book. You can visualize the orders with colors and or with a text indicating

UR DivergenceSpotter
UR DivergenceSpotter ist das Ergebnis langjähriger Erfahrung und manchmal sind die einfachsten Wege die besten. Es gibt eine gute Korrelation zwischen einigen Indikatoren, aber wenn sie nicht übereinstimmen – versucht der Preis, sich „neu anzupassen“ – und in diesem Moment erhalten wir ein Signal mit UR DivergenceSpotter.
Vorteile der Verwendung von UR Divergence Spotter:
Keine Parameter Wird nicht neu gezeichnet, nachdem die Kerze erstellt wurde Signale, wenn das S

UR VolumenTrend
UR VolumeTrend ist der deutlichste Volumenindikator, der den anhaltenden Trend in Bezug auf das Volumen anzeigt. Funktioniert perfekt mit anderen Indikatoren wie UR TrendExhaustion, um lokale Hochs und Tiefs zu signalisieren.
Begrenzt auf nur 2 Parameter – je höher die Werte, desto länger werden die Trends angezeigt. Gradientenextreme zeigen mögliche Volumenerschöpfungen an, um eine potenzielle Trendwende abzufangen. Zwei Linien – Der Volumentrend und der Durchschnitt. Der
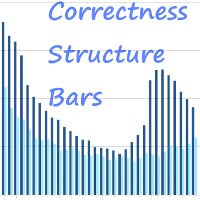
The Correctness Structure Bars indicator displays the bar structure in digital terms. How to Interpret the Information Provided by the Indicator It is very simple, all you have to do is analyze the chart. We will explain the work using an example, take the EURUSD instrument on the D1 timeframe, install this indicator and analyze the information provided by the indicator. The indicator works in the bottom of the chart and gives the result in the form of a histogram, that is, each bar (when a bar
The Correctness Complex Structure indicator displays the complex structure of the bar, taking into account tick volumes in digital terms. How to interpret the information provided by the indicator. It's very simple, it's enough to analyze the chart. We will explain the work using an example, take the EURUSD instrument on the D1 timeframe, install this indicator and analyze the information provided by the indicator. The indicator works in the bottom of the chart and gives the result in the form

Impulse Change is an indicator of impulses for decision making. The main task of this indicator is to warn the trader about the moment of price changes.
Do you often doubt when to make a decision? Leave the market or wait? This indicator is for you, Impulse Change will help you and provide a clearly defined correct hint.
There are always moments in history in which the behavior of the market differs sharply from what happens for the longest periods of time, such uncharacteristic behavior ca
Impulse Creative is a more advanced indicator of impulses for making decisions (compared to the Impulse Change indicator). The main task of this indicator is to warn the trader about the moment of price changes and also to give a command to enter according to the current trend. To determine the trend, use any other tool, this development forms only an entry point but not the entry direction.
First, look at the screenshots and notice that we see clearly expressed figures that the indicator for
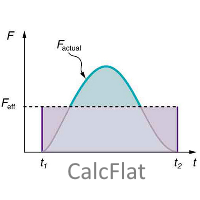
CalcFlat is a flat indicator.
At first glance, a simple indicator, but if you look at the screenshots for people who are not specialists, it may seem that the indicator is not very informative. But in fact, the indicator is very informationally active. It needs to be adjusted for each instrument and each timeframe. Very flexible in the settings there are two key settings, but they can significantly change the results of the display of the indicator. In addition to the main histogram, the indi
CalcFlat Creative is a flat indicator.
This is a more advanced version of the CalcFlat indicator. Three lines have been added for this indicator, which significantly improve the performance of the predecessor indicator. In addition to the two existing levels that the user reacted to and which were static, now the indicator has three dynamic lines on top of the main chart and interpreted as: signal line base, signal minimum, signal maximum.
These lines are formed due to the additional indica

In the Apple is a stable indicator of exit points, no signal will change or redraw.
The indicator displays buy and sell signals with recommended markers for exiting a position. Each exit marker is accompanied by an information mark about the profit from the operation. The label consists of two parts. The first label displays the profit from the last operation in instrument points, and the second label displays the total balance. The total balance starts to be calculated from the moment when t
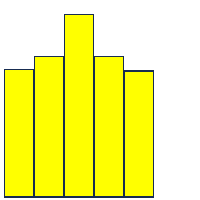
Eine neue Art von Indikator. Speziell für die Trenderkennung entwickelt.
Ein großartiges Instrument für Anleger, um zum richtigen und geeigneten Zeitpunkt für einen anständigen Handel zu investieren.
Sie können es Ihren potenziellen Kunden und Kunden zu ihrer Zufriedenheit präsentieren. Ein sehr praktisches und trendiges Werkzeug. Einfach zu lesen, zu verstehen und benutzerfreundlich.
Mit diesem Tool können Sie leicht die potenziellen Punkte für den Einstieg in den Handel und die niedrigen

LEVELS (extremes, stops, takeprofits)
The indicator visualizes the levels of recent price extremes. Such values are searched for by means of an internal algorithm. It does not redraw. It is used to change stop order placement levels (done manually by the user, the indicator only visualizes the level). It can also be used for taking partial profits at opposite levels of the movement. The indicator will allow you to take most of the strong movements. You don't have to worry about exiting a posit
TRACKINGLEVELS (SUPPORTS AND RESISTANCES)
TrackingLevels is a useful indicator that saves considerable time when a trader starts analyzing a chart. This indicator draw on the chart all the resistances and supports that the market is creating. The resistance and support levels are very important, this levels define areas where there can be a considerable accumulation of sell or buy orders. These are a key areas that every trader must know and keep in mind all the time. This indicator helps the

With Renko Plus you can use the features in the Indicator functionality, just add it to the Metatrader5 chart.
The Renko chart is a type of chart, developed by the Japanese, that is constructed using price movement rather than standardized prices and time intervals like most charts. It is believed to be named after the Japanese word for bricks, "renga", as the graphic looks like a series of bricks.
A new brick is created when the price moves a specified p

AlgoKing Chandelier Exit Indicator (MT5)
The Chandelier Exit Indicator is a volatility based indicator that maximizes returns using the Average True Range (ATR) value and the highest high or lowest low of a period. Benefits Should be used as a trailing stop. Helps you exit a position when you have a respectable profit. Identifies a high probability of a trend reversal when the price moves against the prevailing trend by a distance equal to 3x the average volatility. Join the AlgoKing Lightning

Shift Trend is an indicator of the formation of entry signals, entry points. The indicator must be selected to work for a sufficiently short period of time. But who works in short ranges, then this indicator is well suited.
Options: Length1 - The first parameter. Length2 - Second parameter; PointActivity - Parameter controlling peak levels. PointMinDist - The parameter that sets the minimum distance. AvgLengthBar - Bar averaging.
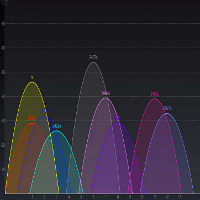
Change Analyzer - The indicator can be called an indicator of market balance. Since the indicator is on the zero line, then the market is balanced in a certain timeframe and a certain instrument.
Based on two virtual windows and their mutual placement, this graph is built. As a result of its work, the price chart normalizes relative to the zero line, which helps to draw conclusions about the price behavior. The indicator is somewhat reminiscent of the overbought and oversold system, but the a
For Nasdaq trading, the most important principle is to know the trend of the fund.
This indicator with 6 green and red lights provides you with the daily path of this important indicator.
This indicator has been tested for 6 months and has a win rate of over 85%.
Be sure to contact me before purchasing to get the necessary instructions on how to use and set up this indicator.
You should use a broker that has dollar index, vix, and commodities. MT4 Version
You can contact us via Instagram,
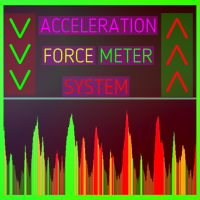
Acceleration Force Meter Indicator - is a trend system that join market in trend phase and after trend pull-back. AFM indicator - is the system that watchs market phases from flat to extreme volatility and prefers to enter in market when it's active, more volatility, ignoring most flat places. This is 100% complete trading system including enter and exit points. It works well with profitable trades - maximizing take profit targets(analysis of recent market volatility, its pips range to adapt cur

UR TrendErschöpfung
UR TrendExhaustion ist die beste Lösung für Trader, die sich nicht mit Parameterwerten oder anderen Einstellungen auseinandersetzen wollen – es ist sowohl einfach als auch visuell für jeden verständlich.
Vorteile der Verwendung von UR TrendExhaustion:
Keine Parameter Sie haben 3 Linien, die am besten beschreiben, was auf dem Chart vor sich geht: Trend-Erschöpfungslinie, Whale-Money-Linie und Retail-Money-Linie. Die Benutzeroberfläche zeigt die Erschöpfung beider Lini
MetaTrader Market - Handelsroboter und technische Indikatoren stehen Ihnen direkt im Kundenterminal zur Verfügung.
Das MQL5.community Zahlungssystem wurde für die Services der MetaTrader Plattform entwickelt und steht allen registrierten Nutzern der MQL5.com Webseite zur Verfügung. Man kann Geldmittel durch WebMoney, PayPal und Bankkarten einzahlen und sich auszahlen lassen.
Sie verpassen Handelsmöglichkeiten:
- Freie Handelsapplikationen
- Über 8.000 Signale zum Kopieren
- Wirtschaftsnachrichten für die Lage an den Finanzmärkte
Registrierung
Einloggen
Wenn Sie kein Benutzerkonto haben, registrieren Sie sich
Erlauben Sie die Verwendung von Cookies, um sich auf der Website MQL5.com anzumelden.
Bitte aktivieren Sie die notwendige Einstellung in Ihrem Browser, da Sie sich sonst nicht einloggen können.