Neue Handelsroboter und Indikatoren für den MetaTrader 4 - 250

Wir stellen Ihnen Ms. Fibonacci vor, einen leistungsstarken und kostenlosen Indikator, der das Zeichnen und Anpassen von Fibonacci-Levels in Ihrem Diagramm vereinfacht. Dieser Indikator identifiziert und markiert automatisch die neuen höchsten und niedrigsten Fibonacci-Werte und gewährleistet so eine genaue und präzise Platzierung. Eines der Hauptmerkmale von Ms. Fibonacci ist seine Fähigkeit, Fibonacci-Ebenen Punkt für Punkt korrekt zu zeichnen und die entsprechenden Preisniveaus zu markier
FREE

Attention! Friends, since there have been many scammers on the Internet recently selling indicators called ForexGump, we decided to warn you that only on our page is the LICENSE AUTHOR'S VERSION of the INDICATOR sold! We do not sell this indicator on other sites at a price lower than this! All indicators are sold cheaper - fakes! And even more often sold demo versions that stop working in a week! Therefore, in order not to risk your money, buy this indicator only on this site!
Forex Gump Pro i

IMA Recover Loss is the expert advisor based on moving average and some technical indicators. This concept uses statistical tools that help in price analysis. By creating a trend line to find trading signals. This expert advisor has developed and improved the moving average to work well with current data and reduce delays. Long and Short Trade Signals: The method for using the Multiple Moving Average indicator is to trade a basic moving average crossover system using all of the MAs. This system

Introducing Early Morning Scalper ATR: Precision Trading During Asian Forex Market A breakthrough in forex trading automation, the Early Morning Scalper ATR Expert Adviser offers a fully autonomous solution meticulously engineered for a specific window of opportunity—the early hours of the Asian Forex market. At its core, this innovative tool employs an advanced algorithm that orchestrates forex trading seamlessly. Augmenting its prowess are sophisticated internal indicators, which deftly ident

Requirement for the EA use: the EA needs a low spread (recommended spread value is 2) and minimum slippage! Systems that operate based on Bollinger waves signals are considered to be among the most popular well performing systems. This Expert Advisor belongs to such systems. In addition to Bollinger waves, the Expert Advisor uses the following indicators: Stochastic, RSI and Moving Average. Recommended Expert Advisor operation time is from 00:05 to 08:00 (the interval between the close of the A

This long-term trading system works on 12 pairs and 4 timeframes . The Expert Advisor uses various trading systems, such as trend trading, counter-trend trading and others. This increases the chances of sustained growth and reduces exposure to a single pair or individual operations. The risk is tightly controlled.
/>
The EA has the built-in smart adaptive profit taking filter. The robot has been optimized for each currency and timeframe simultaneously. It does not need arrival of every tick a

Requirement for the EA use : the EA needs a low spread (recommended spread value is 2) and minimum slippage! Systems that operate based on Bollinger waves signals are considered to be among the systems with the best results and reliability. The Oblivion Expert Advisor also belongs to such systems. In addition to Bollinger waves, the Expert Advisor uses the following indicators: Stochastic and Moving Average. The EA does not use Martingale and grid systems! Recommended Expert Advisor operation t
FREE

Features: Generates BUY / SELL Signals for easy to use: You do not need to read or understand market trend lines on indicators. Quantina Bitcoin Indicator shows a little Red Arrow for SELL and a little Green Arrow for the BUY entry points above- and under - the actual bars. (Green = Bullish Trend , Red = Bearish Trend). Measured Signal Strength also has written on the chart for advanced traders. Working on every known currency pairs: It's working on major-, minor-, and cross - pairs too. Also, Q

Do you need detailed info from different magic numbers trading on the same account? This is your product. Detailed Magics, allows you to know profit, profit factor... of each magic number, so you will know which strategy is working best. Here are the specific information provided for each magic number: Profit. Number of trades. Profit factor. Expectancy (average pip per trade). Recovery factor (profit/drawdown). Max drawdown. Days that this magic number is trading on the account. Number of trade

It is a fully automated trading Expert Advisor, whose algorithm is based on trading using pending orders at the high and low of the daily working channel. StopLoss and TakeProfit are set manually by the trader, which provides ample opportunities for Expert Advisor optimization. When the UseTrall function is enabled, the EA only uses TakeProfit without setting a fixed StopLoss level. Upon reaching the specified profit target level, the EA sets StopLoss at the specified NoLossLevel distance from t
FREE

iSTOCH in iMA is an indicator which applies the stochastic changes to the iMA. Changes are reflected by altering the moving average colors. It is a useful tool to see easily the upsides or downsides of the stochastic.
You can to get source code from here .
Parameters MA_Periods - iMA period. MA_Method - iMA method. K_Period - K line period. D_Period - D line period. Slowind - slowing. STOCH_MA_METHOD - averaging method for MA. PriceField - price (Low/High or Close/Close). STOCH_LevelUp - upt
FREE

RCCMA is a general moving average indicator that works with ReviewCandleChart. Original is "Custom Moving Average" provided by MetaQuotes Software Corp. Based on that source code, I corresponded to ReviewCandleChart .
Advantages When ReviewCandleChart is ON, no line will be displayed on the right side from the vertical reference line. When ReviewCandleChart is ON and you press a key such as "Z" or "X" Following that, the MA is drawn. When ReviewCandleChart is OFF, the same drawing as the origi
FREE

The Expert Advisor is based on a breakout strategy. Market entry signals are generated when the price crosses the border of a certain price range. We created the strategy using historical data with the 99.9% quality data over the past 15 years. We have selected highest-quality signals and eliminated low-quality ones. The EA performs technical analysis and takes into account only those breakdowns that show the best result. The EA uses filtration of false signals. It uses an adaptive trailing stop

Bollinger Bands are volatility bands plotted two standard deviations away from a simple moving average. Volatility is based on the standard deviation, which changes as volatility increases and decreases. The bands expand when volatility increases and narrow when volatility capturing 85%-90% of price action between the upper and lower bands.
How it Works Knowing that the majority of price action is contained within the two bands we wait for price to break out of either the upper or lower band a

Overview It only needs a small initial deposit. Suitable for multi-currency trading. Immunity to the large delay and the size of the spread. Monitoring of my accounts : https://www.mql5.com/en/signals/author/mizrael
How it works After launching the EA on a chart, the EA remembers the first order's Open level. The EA sets a Sell order grid above it. A Buy order grid is set below it. If the total profit of Buy and Sell orders exceeds the value of the Profit parameter, the EA closes the order

The Expert Advisor is easy to use. The EA operating principle is to start active trading, to open several orders in different directions and to close them by averaging.
Advantages Easy to use. Reasonable price. Customer support. Works with any signal delay and any spread value. Trades using pending BuyStop and SellStop orders.
Recommendations It is recommended to stop the Expert Advisor operation during important news releases. The EA is recommended for use on one of the major currency pairs
If you want to add a pattern indicator to confirm the market movement you are in the right place, this indicator permit to detect some famous candle patterns Hammer, Inverted Hammer, Shooting Star, Hanging Man and Engulfing patter that can be highlighted on your chart once the patters occurs. Up, Down arrows are traced at the beginning of the new bar each time a pattern is detected.
Parameters Body to Bar Fraction (%) : the body size / the candle size (20% by default) Max Little Tail Fraction
This indicator analyzes in parallel price charts for multiple currency pairs on all timeframes and notifies you as soon as a double tops or double bottoms pattern has been identified.
Definition Double Top / Double Bottom pattern Double Top is a trend reversal pattern which are made up of two consecutive peaks that are more and less equal with a trough in-between. This pattern is a clear illustration of a battle between buyers and sellers. The buyers are attempting to push the security but are

Der Three MA Alert- Indikator ist ein unverzichtbares Tool für Händler, die sich auf die Crossover-Strategie der gleitenden Durchschnitte verlassen. Es vereinfacht Ihr Handelsleben, indem es Benachrichtigungen an Ihr Mobilgerät oder per E-Mail sendet und Popup-Benachrichtigungen mit Ton anzeigt, wenn sich drei gleitende Durchschnitte kreuzen. Indem Sie dieser weit verbreiteten Technik folgen, können Sie sicherstellen, dass Sie immer auf der richtigen Seite des Trends sind und vermeiden,

Trading Trend Line Der Expert Advisor handelt in Bezug auf die etablierten Trendlinien. Dazu müssen Sie eine Trendlinie auf dem Kurschart zeichnen, ohne ihren Namen zu ändern. Der Name der Trendlinie muss immer das Format haben: "Trendlinie" Leerzeichen und Zahlen. Dieser Name wird bei der Installation der Leitung immer standardmäßig verwendet und Sie müssen ihn nicht bearbeiten. Der Handel entlang der Trendlinie im EA wird auf zwei Arten dargestellt: Handel mit einem Linienbruch und Handel mi
CCI Currency Strength Meter uses CCI (Commodity Channel Index) to monitor how strong a currency is, or in other words, if it's being bought or sold by the majority compared to the other currencies. If you load this indicator on a chart, it will first display the strength-lines of the currencies (base and counter currency of the chart) with changeable solid lines. Also, you can add up to five additional currencies to the "comparison pool," that already has the base and the profit (counter) curren
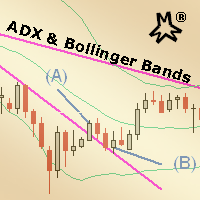
MMM ADX & Bollinger Bands strategy: This EA's strategy combines 2 built-in indicators to enhance its signals and decide to open a new order at the right time, there is an ADX indicator and you may choose its signal's strength and a Bollinger Bands indicator confirms the trends and a MA to check if the prices are deviating from its pattern. By joining both indicators' data and the moving average, it is possible to calculate quality signals, avoiding sudden market movements against your trading op

ReviewCandleChart is a unique product that can verify past price fluctuations using candlestick charts. This indicator accurately reproduces market price fluctuations in the past and can make trading decisions (entries, profits, loss cut) many times so that you can learn the trading faster. ReviewCandleCahrt is the best indicator to improve trading skills. ReviewCandleCahrt caters to both beginners and advanced traders. Advantages of the indicator This Indicator for verifying price fluctuation u
The EA is based on price crossing the High or Low of a Moving Average. Advance Fractal profit taking method. Advance stop management option based on explosive candles (Big Candles). Loss recovery system making recovery of losses easier. Configured the EA to match your trading style. Scalping, Swing Trading or Trend Trading. Three custom trailing stop options. Explosive candle stop management with partial closure. Advance fractal partial close profit taking Two indicator filters Time filter wit

Determining the current trend is one of the most important tasks for a trader regardless of their trading style. The Proton Trend indicator can help traders do it. Proton Trend is a trend determining indicator, which uses an original calculation algorithm. The indicator is suitable for any currency pair and timeframe. It does not change its readings.
Indicator parameters Main Settings : HistoryBars - number of bars for display. SlowPeriod - slow variable period. FastPeriod - fast variable peri
RSI Currency Strength Meter uses RSI (Relative Strength Index) to monitor how strong a currency is, or in other words, if it's being bought or sold by the majority compared to the other currencies. It displays the strength-lines of the currencies of the pair (base and counter currency of the chart) with changeable solid lines. Also, you can add up to ONE additional currency (only 1 in the DEMO version, in REAL up to 5) to the "comparison pool" that already has the base and the profit (counter) c
FREE

ReviewCandleChart is a unique product that can verify past price fluctuations using candlestick charts. This indicator accurately reproduces market price fluctuations in the past and can make trading decisions (entries, profits, loss cut) many times so that you can learn the trading faster. ReviewCandleCahrt is the best indicator to improve trading skills. ReviewCandleCahrt caters to both beginners and advanced traders.
Advantages of the indicator This Indicator for verifying price fluctuation
FREE
CCI Currency Strength Meter uses CCI (Commodity Channel Index) to monitor how strong a currency is, or in other words, if it's being bought or sold by the majority compared to the other currencies. If you load this indicator on a chart, it will first display the strength-lines of the currencies (base and counter currency of the chart) with changeable solid lines. Also, you can add up to ONE additional currency (only 1 for the DEMO version, but on REAL up to 5) to the "comparison pool" that alrea
FREE

FX Master Expert Advisor opens positions at breakthroughs of support and resistance levels.
The EA trades during both trend and flat movements with no need to adjust parameters.
The EA uses the minimum stop loss (250 points) allowing the efficient use of funds and risk management.
Working timeframe: 1H
Recomended params for trading - all default values, excluding Filtration: AUDUSD=8, EURUSD, GBPUSD, USDCAD =12, USDCHF = 28
Note! Use "Every tick" mode when testing the EA!
In

This indicator is a proof of concept of pyramid trading strategy. It draws fibonacci level automatically from higher high to lower low or from lower low to higher high combinate with Pyramid Trading Strategy for better risk reward ratio. What is Pyramid Trading Strategy? The pyramid forex trading strategy is a something every forex trader should know about because it makes the difference between making some pips with some risk in only one trade or some pips with less the risk by applying the pyr
The indicator shows buy or sell on the screen when it catches a signal with its own algorithm. The arrows warn the user to buy or sell. Pairs: USDCHF, AUDUSD, USDJPY, GBPJPY, EURUSD, GBPUSD, EURCHF, NZDUSD, EURCHF and EURJPY. You can test the indicator and choose the appropriate symbols. The best results are on M30.
Parameters AlertsOn - send alerts AlertsMessage - send a message AlertsSound - sound alert
AlertsEmail - email alert Buy color - buy color
Sell color - sell color
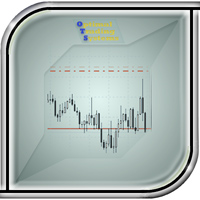
The utility manages other EAs' orders as well as the ones opened manually. It is capable of trailing the price (trailing stop function), set a stop loss and take profit if they have not been set before. When configuring the utility for an EA having no trailing stop function, place it to the new window with the same currency pair specifying the same Magic value (as for the EA orders the stop loss is to be applied to). You can set any timeframe. It does not affect the utility operation. Set Magic
FREE

This Expert Advisor is designed for use on all currency pairs on any timeframes. Candlestick analysis from different timeframes is used for opening positions. Positions are closed using the automated trailing system or by an opposite signal. The EA does not have input parameters affecting the trading algorithm. Timeframe: any (candlesticks from M15 to H4 are used) Currency pair: any (it is recommended to simultaneously use at least 4 major currency pairs).
Parameters LotSize - lot value parame

This indicator draws Fibonacci level automatically from higher high to lower low or from lower low to higher high combinate with Pyramid Trading Strategy for better risk reward ratio. With adjustable Fibonacci range and has an alert function.
What is Pyramid Trading Strategy? The basic concept of pyramiding into a position is that you add to the position as the market moves in your favor. Your stop loss moves up or down (depending on trade direction of course) to lock in positions. This is how
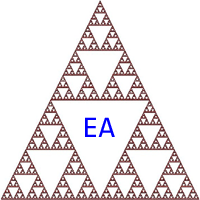
The Expert Advisor generates trading signals based on the values of the FractalDivergence_Patterns indicator. A Buy signal is generated when the indicator detects a support level, and a Sell signal is generated when the resistance level is found (see Fig. 1: blue arrows show buying, red arrows show selling). The Expert Advisor does not require the indicator to be additionally used, and can display the appropriate support and resistance levels.
Parameters The "Fractal divergence parameters" blo
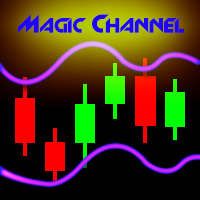
Magic Channel is a channel indicator for the MetaTrader 4 terminal. This indicator allows finding the most probable trend reversal points. Unlike most channel indicators, Magic Channel does not redraw. The alert system (alerts, email and push notifications) will help you to simultaneously monitor multiple trading instruments. Attach the indicator to a chart, and the alert will trigger once a signal emerges. With our alerting system, you will never miss a single position opening signal! You can t

Rung Trendanzeige. Der Indikator identifiziert und markiert in verschiedenen Farben die Haupttrends der Preisbewegung, während er Rauschen und kurzfristige Preisbewegungen gegen den Haupttrend eliminiert und nicht darauf reagiert. Der Indikator ist ein Werkzeug, das den aktuellen Trend auf dem Markt bestimmt. Mit den Standardeinstellungen markiert der Indikator einen Aufwärtstrend ("bullish") mit einer grünen Linie, einen Abwärtstrend ("bearish") - mit einer roten Linie auf seitwärts gerichtet
FREE

This indicator can send alerts when a Heiken Ashi Smoothed color change occurs. Combined with your own rules and techniques, this indicator will allow you to create (or enhance) your own powerful system. Features Can send all types of alerts. Option to delay the alert one bar in order to confirm the color (trend) change. Input parameters Wait for candle close: 'true' or 'false'. Setting it to 'true' will delay the alert to the opening of the bar following the bar where the color change occurred.
FREE

Take your trading to the next level with DFGX - our second generation Dynamic Fibonacci Grid. This new, powerful and easy to use application is specially designed and optimized for contrarian intraday trading, scalping and news trading on the Forex market. This system is the ideal solution for active professional traders and scalpers who are looking for innovative ways to optimize their strategy. The system also provides excellent opportunity for new traders who want to learn to trade in a syste

Magic Moving is a professional indicator for the MetaTrader 4 terminal. Unlike Moving Average , Magic Moving provides better signals and is able to identified prolonged trends. In the indicator, you can set up alerts (alert, email, push), so that you won't miss a single trading signal. MT5 version can be found here You can test the program by downloading the demo version: https://www.mql5.com/en/blogs/post/749430 Advantages of the indicator Perfect for scalping. Generates minimum false signals.

Fix M15 is a fully automated short-term trading robot. The EA does not use hedging, martingale, grid strategies, arbitrage, etc. Fix M15 opens a trade during the Asian session in a narrow channel defined by MA and RSI indicators. Only one trade per one pair can be opened on the market at each given time. It can be closed by a certain TP, SL or after a certain time (set in the EA settings). Basic EA settings are configured for trading GBPUSD М5 for the terminal set to GMT+3 (summer time). The EA
Key Features This application is designed to quickly place a pending order or open a position at market. The position volume will be calculated automatically according to the risk settings. This application also manages orders and positions. Everything is simple, you only need to specify the price of the order (or position by market) and stop loss. The type of the pending order is selected automatically depending on the logic of the relative location of the current price, pending order price and

The RightTrend indicator shows the direction of trend and reversal points (market entry and exit points). It is very easy to use: open BUY deal when the up arrow appears and open SELL deal when the down arrow appears. The indicator generates accurate and timely signals for entering and exiting the market, which appear on the current candle while it is forming. In spite of apparent simplicity of the indicator, it has complex analytic algorithms which determine trend reversal points.
Inputs stre
The indicator shows when every market session starts and finishes in colored frame box. It includes the Stop Hunt Boxes which shows pockets of liquidity, found at places where traders put their stop losses on existing positions. Contains EMA crossover alert on 50 EMA , 200 EMA and 800 EMA . It can be used in many Forex strategies and for easier observe of the chart.
Indicator parameters NumberOfDays - period of drawing the frames, default is 50 days; Draw_asian_box - draw the box of Asian ses

White Scalper is a fully automated Expert Advisor that uses a highly accurate scalping strategy. It works on all symbols and timeframes.
White Scalper advantages Flexible settings allow you to use the EA on virtually any instrument. No long stagnation period. Good testing results since 2000. No outstaying the losses. All trades are closed within a few hours. The Expert Advisor does not use hedging, martingale, grid strategies, arbitrage, etc. A stop loss is always set.
About Extreme settings

The Commodity Channel Index (CCI) is an oscillator that is often used by forex traders to identify oversold and over bought conditions much in the same way as the RSI or Stochastics.
How it Works The idea behind this indicator is simple, we wait for price to reach an extreme (overbought or oversold) and then trade when price appears to change direction in the hope of catching a move out of the area. Buy signals - The indicator waits for the CCI to become oversold (a value below -100). The indi
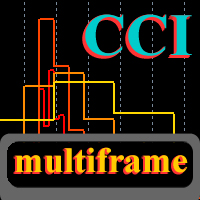
This is a fully multi-timeframe version of the Commodity Channel Index standard indicator, which works for any combination of timeframes. The indicator preserves the correct time scale for all charts at any intervals. When switching to a higher or lower timeframe, the time scale is not distorted. For example, one value of М15 will occupy 15 bars on М1 and 3 bars on М5 . The indicator allows you to see the real dynamics and the overall ratio for all selected periods, as well as accurately evaluat
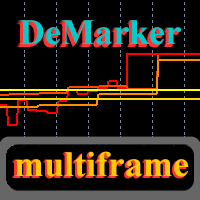
This is a fully multi-timeframe version of the DeMarker standard indicator, which works for any combination of timeframes. Like my other multi-timeframe indicators, it implements the idea of saving the right time scale for all charts on any intervals. When switching to the higher or lower timeframe, the time scale is not distorted. For example, one value of М15 will occupy 15 bars on М1 and 3 bars on М5 . The indicator allows you to see the real dynamics and the overall ratio for all selected pe

Overview It only needs a small initial deposit. Suitable for multi-currency trading. Immunity to the large delay and the size of the spread. Monitoring of my accounts : https://www.mql5.com/en/signals/author/mizrael
How it works The EA opens orders based on a built-in indicator. The EA determines the order with the greatest negative profit each tick. Then it determines the total profit of Buy and Sell orders on each currency pair. If the total profit of Buy or Sell orders on each currency p

With My Fx STATISTICS you will be able to see your account´s performance directly on the chart of Metatrader 4, and refresh the data even every minute. No need of external analyzer webpages. Information provided: DAILY, WEEKLY AND MONTHLY PROFIT. PROFIT FACTOR % OF PROFITABLE TRADES AVERAGE PROFIT / LOSS TRADE (MONEY AND PIPS) BEST PROFIT / LOSS (MONEY AND PIPS) EXPECTANCY (AVERAGE PIPS PER TRADE) AND ALSO YOU WILL SEE THE ACTUAL PROFIT OF EACH CURRENCY PAIR
Input parameters
Refresh_data_minu

MQLTA Support Resistance Lines is an indicator that calculates the historical levels of Support and Resistance and display them as Lines on chart. It will also Alert you if the price is in a Safe or Dangerous zone to trade and show you the distance to the next level. The indicator is ideal to be used in other Expert Advisor through the iCustom function. This indicator can be tested LIVE on AUDNZD with the following DEMO https://www.mql5.com/en/market/product/26572
How does it work? The indicat
FREE

This long-term trading system works on 20 pairs and 1 timeframes. The Expert Advisor uses various trading systems, such as trend trading, countertrend trading and others. This increases the chances of sustained growth and reduces exposure to a single pair or individual operations. The risk is tightly controlled.
The EA has the built-in smart adaptive profit fixing filter. The robot has been optimized for each currency and timeframe simultaneously. It does not need arrival of every tick and h

The indicator displays the key support and resistance levels on the chart. The significance of these levels lies in that the price may reverse or strengthen the movement when passing such levels, since they are formed as a consequence of the natural reaction of market participants to the price movement, depending on which positions they occupied or did not have time to occupy. The psychology of the level occurrence: there always those who bought, sold, hesitated to enter or exited early. If the
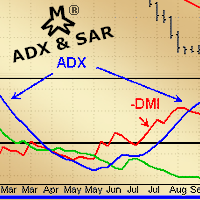
MMM ADX & SAR strategy: As requested by some experienced traders, this EA's strategy uses its 2 built-in indicators to enhance its signals and decide to open a new order at the right time, there is an ADX indicator and you may choose its signal's strength, a parabolic SAR to help and confirm the trends and a MA to check if the prices are deviating from its pattern. By joining both indicators' data and the moving average, it is possible to calculate a good and strong trend direction, avoiding sud

This indicator shows the main trend on the current chart.
Features This indicator includes two bands, one is the inner white bands, another is the outer blue bands. If the white dotted line crosses down the white solid line, this means that the trend has changed to be bearish. If the white dotted line crosses up the white solid line, this means that the trend has changed to be bullish. Once the crossing happened, it will not repaint.
Settings ShowColorCandle: if 'true', it will show the colo

MQLTA Support Resistance Lines is an indicator that calculates the historical levels of Support and Resistance and display them as Lines on chart. It will also Alert you if the price is in a Safe or Dangerous zone to trade and show you the distance to the next level. The indicator is ideal to be used in other Expert Advisor through the iCustom function. This DEMO only works with AUDNZD, the full product can be found at https://www.mql5.com/en/market/product/26328
How does it work? The indicato
FREE

Note: this product is a free limited version of the full featured product Currency Timeframe Strength Matrix . It only includes AUD, CAD, CHF currencies instead of all 8 currencies. It includes only 5S, 1M, 5M time frames instead of all 8 (5S, 1M, 5M, 15M, 30M, 1H, 4H, 1D).
What is it? The Currency TimeFrame Strength Matrix is a simple and comprehensive Forex map that gives a snapshot of what is happening in the Forex market at the very present time. It illustrates the strength and momentum
FREE

Expert Advisor for night scalping. It works at the end of the American and at the beginning of the Asian sessions. Working time frame - M15 and M5. The EA features a news filter, which uses a news indicator. NOTE : The settings in the proposed set files are designed for brokers working according to Eastern European Time and New York trading time. When using with a broker that works according to a different time, it is necessary to manually adjust the EA operation time in the input parameters. ND
At last! See the actual, oscillating RSI for multiple pairs & multiple timeframes, all on the one chart!
The Benefits of Multi TimeFrame / Multi Pair Analysis Multiple time frame analysis is one of the most important things you should be doing before you take every trade. The most successful traders rely on monitoring several timeframes at once, from the weekly down to the 1 minute. They do this because using only one timeframe causes most traders to become lost in the "noise" of random price

The Moving Average Slope (MAS) is calculated by detecting the moving average level n-periods ago and comparing it with the current moving average level. This way, the trend of the moving average can be drawn on the moving average line. This indicator allows to compare the slopes of two moving averages (fast and slow) to cancel out noise and provide better quality entry and exit signals SCANNER is included . Now with Scanner you can find trading opportunities and setups easily and faster.
Featu

Some traders experience difficulties when it comes to limiting risks. This indicator helps traders define a suitable stop loss to limit trading risks. The indicator provides seven levels of risk limitation (recommended values are 1-3). The greater the risk, the greater the stop loss. Accordingly, the lower the risk, the smaller the stop loss, but the greater the probability of false triggering. In addition, the indicator shows trend signals and the current trend strength. This data can be used t

The indicator uses the Chester W. Keltner's channel calculation method, modified by the well-known trader Linda Raschke. Due to the modification, the calculated channel contains a much more complete overview of the price movements, which allows increasing the probability of an accurate prediction of the upcoming price movement. Unlike the classic Keltner method, the base line of the channel is plotted based on the Exponential Moving Average, and the Average True Range is used to calculate the up
FREE

The indicator shows the trend of 3 timeframes: higher timeframe; medium timeframe; smaller (current) timeframe, where the indicator is running. The indicator should be launched on a chart with a timeframe smaller than the higher and medium ones. The idea is to use the trend strength when opening positions. Combination of 3 timeframes (smaller, medium, higher) allows the trend to be followed at all levels of the instrument. The higher timeframes are used for calculations. Therefore, sudden change
The Expert Advisor trades based on levels set by the user or an indicator (three indicators are built into the EA). The EA requires two lines for correct operation: one must be higher than the current price, and the other must be lower. The EA supports two line types: horizontal and trend lines. The two lines may have the same or different types. Lines can be used to draw a channel and set the EA to trade within the channel: buy at the lower line and sell at the upper line. It is also possible t
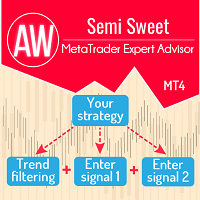
The Expert Advisor trades where the signal for opening a new order or restoring order is an indicator strategy, which is defined by the user in the input settings. You can choose indicators, their timeframes and the number of signals sufficient to open an order. A total of 29 trading indicators are available, on the basis of which the user can form his own trading idea without using programming.
Problem solving -> HERE
Expert Advisor modes: Hedging Auto mode, Netting Auto mode - Two mod

Mit dem Dienstprogramm können Sie Ihre Strategien manuell im Strategietester testen. Ein-Klick-Handel auf dem Visualisierungsdiagramm.
Die neueste Version des Dienstprogramms bietet Händlern erweiterte Funktionen zum manuellen Testen ihrer Handelsstrategien. Mit dem Strategietester können Sie nun die Wirksamkeit Ihrer Handelsstrategien in einer simulierten Umgebung bewerten. Mit dieser Funktionalität können Sie die Leistung Ihrer Handelstechniken analysieren und diese verfeinern, um Ihre Handel
FREE

Dienstprogramm zum Ändern des Handelsinstruments für aktuelle, alle oder ausgewählte Charts, Zeitrahmenänderungen und für die gleichzeitige Bewegung in der Geschichte (automatisch oder auf Klick) aller Charts. Die Symbolliste wird aus der „Marktübersicht“ gelesen. Sie können die Farbe, Größe und Position der Schaltflächen ändern. Die Diagrammsynchronisierung erfolgt zum Zeitpunkt des ersten sichtbaren Balkens im aktiven Diagramm, wenn Sie auf die Synchronisierungsschaltfläche klicken oder die Ma

Der EA für den manuellen Handel zur Verwaltung offener Positionen und Pending Orders. Der eingebaute Trailing Stop hat fünf Modi und sieben Tools. Es gibt einen virtuellen Stop-Loss und einen virtuellen Take-Profit, die frei im Chart verschoben werden können. Mit Hilfe des eingebauten Handelssimulators können Sie überprüfen, wie der EA im Strategietester funktioniert. Eine ausführliche Anleitung zu UTrailing finden Sie im Abschnitt „Diskussion“. Vorteile 5 Trailing-Stop-Modi: virtueller, normale

Extract Candle Power ist ein Echtzeit-Volumenextraktionsindikator, der wertvolle Einblicke in das Verhalten von Verkäufern und Käufern während jeder Kerze liefert. Durch die Analyse der Volumendaten können Händler fundiertere Entscheidungen über Markttrends und mögliche Umkehrungen treffen und übertreffen damit die Möglichkeiten herkömmlicher gleitender Durchschnittsindikatoren. Mit diesem leistungsstarken Tool können Sie das Verkäufer- und Käufervolumen der aktuellen Kerze extrahieren und ana

Earn trading cryptocurrencies nowadays. (2023)
Hello Everyone I would like to introduce you to my short guide about Trading with cryptocurrency pretty short but can be useful for everyone for this year, with patterns based on past experiences, could help those who want to earn with cryptocurrencies. Here im attaching the archive with full guide. https://files.catbox.moe/quwwzw.rar
FREE
Ist Ihnen bekannt, warum der MetaTrader Market die beste Plattform für den Verkauf von Handelsstrategien und technischer Indikatoren ist? Der Entwickler braucht sich nicht mit Werbung, Programmschutz und Abrechnung mit Kunden zu beschäftigen. Alles ist bereits erledigt.
Sie verpassen Handelsmöglichkeiten:
- Freie Handelsapplikationen
- Über 8.000 Signale zum Kopieren
- Wirtschaftsnachrichten für die Lage an den Finanzmärkte
Registrierung
Einloggen
Wenn Sie kein Benutzerkonto haben, registrieren Sie sich
Erlauben Sie die Verwendung von Cookies, um sich auf der Website MQL5.com anzumelden.
Bitte aktivieren Sie die notwendige Einstellung in Ihrem Browser, da Sie sich sonst nicht einloggen können.