Смотри обучающее видео по маркету на YouTube
Как купить торгового робота или индикатор
Запусти робота на
виртуальном хостинге
виртуальном хостинге
Протестируй индикатор/робота перед покупкой
Хочешь зарабатывать в Маркете?
Как подать продукт, чтобы его покупали
Технические индикаторы для MetaTrader 4 - 23

The StrikePin indicator is a technical, analytical tool designed to identify trend reversals and find optimal market entries. The StrikePin indicator is based on the pin bar pattern, which is the Price Action reversal pattern.
An entry signal, in a trending market, can offer a very high-probability entry and a good risk to reward scenario.
Be careful: the indicator is repainting since it is looking for highest high and lowest lows. You should avoid to use it in experts but you can use it
FREE

This indicator is based on the ADX indicator and indicates the trend very easily.
You can customize the indicator to your needs: ADXPeriod ADXSignal_Level BarWidth CandleWith HeikenAshi
The Adx color candles indicator is fully FREE and compatible with the other part of the system; the Acc arrow >>>> https://www.mql5.com/en/market/product/33770 ENJOY and check out my other indicator: https://www.mql5.com/en/market/product/32111
FREE

The ' Average Bar Chart ' indicator was created to showcase the traditional Heiken Ashi calculation as an exotic charting style. This indicator is known for reducing chart noise for a smoother price action. A dditional indicators are recommended
Key Features Candlesticks for OHLC are removed from the chart. Average bars may be shown as complete bars without tails. All functionality and features of this exotic chart are inputs.
Input Parameters Chart Timeframe = PERIOD_CURRENT; - period to s
FREE

Трендовый индикатор гибрид нескольких известных индикаторов, обрабатывающих данные последовательно с сигнализацией смены тренда. Конечная обработка данных индикатора АМка. Индикатор условно не рисующий - при перезапуске может изменить некоторые данные графика, но если его не трогать, то перерисовывать не будет. Возможно выдавать алерт, звук, посылать e-mail или сообщение на другой терминал при смене тренда.
FREE

Индикатор рисует уровни Фибоначчи с выделенными Ценовыми метками.При установке индикатора на график необходимо создать трендовую линию с именем указанным в поле" Unique name of trend line to place fib on ". По умолчанию имя=" Unique name of trend line to place fib on" = "+" .В индикаторе можно заменить уровни фибоначчи по своему усмотрению.Также меняются цвет,стиль,толщина линий и т. д.
FREE
Highly configurable Williams %R indicator. Features: Highly customizable alert functions (at levels, crosses, direction changes via email, push, sound, popup) Multi timeframe ability Color customization (at levels, crosses, direction changes) Linear interpolation and histogram mode options Works on strategy tester in multi timeframe mode (at weekend without ticks also) Adjustable Levels Parameters:
Williams %R Timeframe: You can set the current or a higher timeframes for Williams %R. William
FREE

Индикатор PipTick Fibo позволяет автоматически отображать уровни коррекции Фибоначчи, которые являются значимыми уровнями поддержки и сопротивления. Диапазоном для расчета индикатора может быть дневная, недельная, месячная или любая выбранная пользователем сессия.
Levels - уровни 100 % (Максимум) диапазона предыдущей сессии. 0 % (Минимум) диапазона предыдущей сессии. 76,4 % диапазона предыдущей сессии. 61,8 % диапазона предыдущей сессии. 50 % диапазона предыдущей сессии. 38,2 % диапазона преды
FREE

Данный индикатор автоматически рисует трендовые линии по нижним и верхним точкам экстремума с помощью индикатора ZigZag. По мере движения рынка индикатор постоянно обновляет линии на графике. Он может работать на любом типе счета или графике. Все параметры можно отрегулировать.
Настройки: Delete_Lines - При значении true индикатор будет удалять старые трендовые линии по мере формирования новых точек экстремума индикатора ZZ. При значении false старые трендовые линии удаляться не будут. Num_ZZ_
FREE

Concept
Market arranges in Time upcoming Phases according to the present Results of its Interest. Directing Modulations are an Interaction of immanent Periods, which show in Reference to Time cyclic Activity and to Price leveling Activity. PointZero is a projecting Price Mask of this Concept of Time and Price and categorizing developed Price Movements related to their own Range: how far moved ? indicating their Status by marking special Events: when which Action ? setting the Situation in a fu
FREE

Индикатор рисует ценовые каналы. Можно настроить, чтобы показывались каналы только на покупку или на продажу. Также можно отображать линии тренда вместо каналов. Индикатор очень прост в использовании, но, тем не менее, существует много торговых стратегий, которые основаны на торговле в каналах. Советник на основе этого индикатора: https://www.mql5.com/ru/market/product/37952 Параметры History - максимальное количество баров для построения каналов; Distance - минимальное расстояние от одного мак
FREE

The Rayol Code Hour Interval Lines indicator was designed to assist your trading experience. It draws the range of hours chosen by the user directly on the chart, so that it enables traders to visualize price movements during their preferred trading hours, providing traders a more comprehensive view of price movements and market dynamics. This indicator allows the user to choose not only the Broker's time, but also the Local time. This way, the user no longer needs to calculate local ti
FREE

Данная версия индикатора работает только в потоке тиковых данных. Таким образом мы видим только текущую ситуацию с момента запуска. Рекомендую использовать классическую версию Real-Time Currency Valuation . Индикатор рассчитывает силу восьми основных валют, а также может рассчитать силу любой другой валюты, металла или CFD.
Основные особенности Умеет отображать только необходимые на данный момент валюты, таким образом не перегружая Вас лишней информацией и уведомлениями. Имеет встроенный набо
FREE
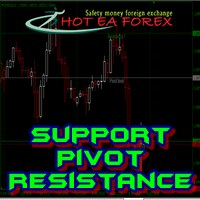
How To Trade
Execute your trades in 3 Easy Steps!
Step 1: Trade Setup Entry Buy = If daily open market Above Line PIVOT or can Price has touched and closed the candle above Resistance1. Entry Sell = If daily open market Under Line PIVOT or can Price has touched and closed the candle above Support1. Step 2: Set Stop Loss Stop loss BUY ----> You can set stop loss on Line Pivot or Support1. Stop loss SELL ----> You can set stop loss on Line Pivot or Resistance1. Step 3: Set Take Profit Take pro
FREE

Fibonacci retracement is really one of the most reliable technical analysis tools used by traders. The main problem with using these levels in trading is that you need to wait until the end of the impulse movement to calculate the retracement levels, making difficult to take a position for limited retracement (0.236 or 0.382). Fibo Dynamic solves this problem. Once the impulse movement is identified the retracement levels are automatically updated allowing very dynamic trading in trends with onl
FREE

Индикатор отображает свечной паттерн Pin Bar. С помощью настроек коэффициента легко настраивается соотношение тени, тела и размера. Возможна фильтрация по тренду (2 скользящие средние) и по развороту (RSI и полосы Боллинджера). Это самый популярный паттерн прайс экшн. В наличии мультивалютный дэшборд. С его помощью вы можете легко переключаться между графиками.
Торговые паттерны: Ретест по тренду. Ложный пробой. Другие.
EURUSD, GBPUSD, XAUUSD, ... M15, M30, H1.
Входные параметры.
Основн
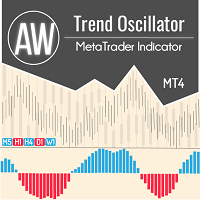
Трендовый осцилятор с продвинутой системой фильтрации. Определяет тренд, его ослабление и усиление. Имеет встроенную мультитаймфреймовую панель. AW Trend Oscillator работает на любых таймфреймах и на любых символах (валюты, индексы, нефть, металлы, акции). MT5 версия -> ЗДЕСЬ / Решение проблем -> ЗДЕСЬ Особенности и преимущества:
Продвинутая фильтрация тренда Изменение чувствительности индикатора в один клик Простая настройка Мультитаймфреймовая панель Возможность перемещения и минимизации
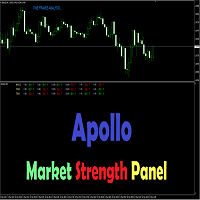
Apollo Market Strength Panel - это мульти-таймфреймовая панель, которая будет полезна в торговле как форекс трейдерам, так и трейдерам бинарных опционов. Панель отображает рыночную ситуацию на нескольких тайм фреймах от M1 до H4. Индикатор отображает три важные аспекты рынка. Это Trend, Force и Impulse. Если все три компонента согласованы, то это будет указывать на сигнал, в зависимости от движения рынка. Индикатор дает сигналы в виде сообщений на графике. Вы можете сами выбирать для каких тайм

This indicator scans the Moving Average values for 2 Moving Averages on multiple pairs and multiple timeframes in realtime and displays a Buy signal when the fast MA is above the slow MA and a Sell signal when the fast MA is below the slow MA.
-All the MA parameters(Period, Method and Applied price) can be changed from the inputs window.
-You can either add your own list of pairs to scan or set the scanner to automatically use the pairs in the market watch using the Symbols Source input.
FREE

The "Trend Edges" indicator determines whether the trend is rising or falling. It is suitable for any time frame (tested on DAX).
The indicator should be treated like Bollinger Bands, meaning that if it breaks out upwards, you can buy with a stop loss below the lower edge.
Find a trending pair, index or CFD. Additionally :
-Sound alert on trend change.
-Alert Notification
-Alert Notification on your mobile phone Check my other indicator "Trend Edges histogram"
FREE

С помощью данного инструмента теперь нет необходимости проверять волатильность интересующих вас валютных пар на сторонних вебсайтах с целью определения среднего диапазона движения цены. Индикатор Truly Volatility предназначен для определения волатильности и расчета среднего движения цены в часовой, либо дневной период. Данные отображаются в отдельном окне в виде гистограммы и текстовых значений. Использовать индикатор можно как альтернативу тому же ATR, но возможностью более детального анализа.
FREE

Introducing the “Symbol Cost Info MT4” indicator – your ultimate tool for staying ahead in the forex market! This innovative indicator is designed to empower traders with real-time cost information, directly on their charts. Here’s why every trader needs the “Symbol Cost Info MT4” in their arsenal: Real-Time Spread Monitoring : Keep a close eye on the spread for any currency pair, ensuring you enter the market at the most cost-effective times. Pip Value at Your Fingertips : Instantly know t
FREE

Key Features: Type of Indicator: Line Break Chart Indicator Usage: Identifying trend reversals and potential market turning points. Input Parameters: The primary input parameter is 'Lines_Break,' which represents the number of lines the price needs to move to create a new line in the opposite direction. How it works: The indicator draws green and red histogram bars to represent the line break chart. Green bars indicate an upward trend, and red bars indicate a downward trend. The indicator calcul
FREE

Day Points
Indicadtor that shows the points considered important for X days. (Open,Close, High, Low) Used a lot by those who do day trade. These points can be used for decision making by a trader. You will choose the amount of days ago for it to show.
Settings High/Low/Close/Open Show - True/False. Days - Number of days that will show on the chart. Color - Line Color. Style - Line Style.
FREE

Candle High Low
Indicator showing High and Low of X candles across a line.
Settings Candle number for calculation (>= 1 ) - Define the number of candles for the indicator to find the maximum and minimum of that period of candles. Continuation of the line's display to the right - If you want the High and Low line to extend to the right edge of the graph Line High Color - Set line color Line High Style - Set line style Line Low Color - Set line color Line Low Style - Set line style
FREE

MACD divergence Simple edition 原始MACD计算方式,升级为双线MACD,使判断更加直观更加贴合大宗交易平台的研究习惯,同时还会自动用实线标出背离,不用再从0开始苦学钻研。
同时,我还提供了提醒服务,在你忙于家务无暇顾及的时候只需要打开音响,一旦达成背离,第一时间就会让你知晓。
这是一款简单版的看背离指标,MACD的九天均线被称为“信号线”,然后绘制在MACD线的顶部,它可以作为买入和卖出信号的触发器。当MACD越过信号线时,交易员可以买入操作,当MACD穿过信号线以下时,交易者可以卖出或做空操作。移动平均收敛-发散(MACD)指标可以用几种方法解释,但更常见的方法是交叉、散度和快速上升/下降。
FREE
Sync Cursor MT4 Tool will It make the Horizontal Line + Vertical Line in the Screen That it is always present on the screen and that it moves along with the candle (with the price). I am sure that something so simple will be a Treasure in the hands of many people. Some of my personal trades are posted voluntary and free of charge in this Public channel https://t.me/FXScalpingPro Contact: https://t.me/TuanNguyenTrader
FREE

Key Price Levels Indicator Indicator that shows the highs and lows for the significant price levels for past periods that could be potentially considered as reaction levels. The indicator displays the following price levels: Yesterday high and low The day before yesterday high and low Two days back high and low Last week high and low Last month high and low Last three month high and low (Quarter) Last year high and low
FREE

The volume weighted average price (VWAP) is a trading benchmark used by traders that gives the average price a security has traded at throughout the day, based on both volume and price. VWAP is calculated by adding up the dollars traded for every transaction (price multiplied by the number of shares traded) and then dividing by the total shares traded. You can see more of my publications here: https://www.mql5.com/en/users/joaquinmetayer/seller
FREE

This product is a part of ON Trade Waves Patterns Harmonic Elliot Wolfe
you can test free version on EURJPY from this link Wolf Waves Indicator
Откройте для себя Wolf Waves - ваш идеальный инструмент для торговли! Вы ищете мощный инструмент для легкой идентификации Wolf Waves на любом временном интервале? Дальше смотреть не надо! Наш индикатор Wolf Waves делает это легко. Вот почему он идеально подходит именно вам: Основные характеристики: Автоматическое обнаружение: Наш индикатор Wolf Wav

Fisher Yur4ik Indicator is a momentum indicator originated by Yuri Prokiev (Russian). I combined the Fisher Test indicator with other indicators to sieve/filter signals. It is not used as a standalone indicator but in combination to filter out Price Action signals. I have uploaded this indicator (Fisher test) for download alongside the 3Bar_Play signal indicator for signals to appear. It is free.
FREE

Данный индикатор позволяет сканировать символы в окне "Обзор рынка" (не более 15 в демо-версии), отфильтровывать тренды и отправлять оповещения. Он работает на основе эффективного индикатора "SuperTrend" , который используется многими трейдерами для торговли: Когда цвет ячейки меняется на " зеленый " или " красный ", это указывает на изменение тренда для открытия длинной или короткой позиции. Также появится экранное уведомление. Когда цвет меняется на зеленый , это указывает на восходящий тренд
FREE
Уникальный индикатор IceFX VelocityMeter для платформы MetaTrader 4 измеряет скорость рынка форекс. Это не обычный индикатор объемов или других величин, т.к. IceFX VelocityMeter способен понять скорость скрытых в тиках движений рынка, а эта ценная информация не доступна в обычных свечах, поэтому не может быть получена простым индикатором. Этот индикатор контролирует приход тиков (частоту и величину изменения) в пределах указанного диапазона времени, анализирует эти данные, определяет, записывает
FREE

the AK CAP toolbox free to use;
it includes the same indicators we use for our daily trading and we think the simpler the better. Lightweight indicator for use on all timeframes. that includes VWAP with vwap value indicator on top right. 3 EMA: FAST, MEDIUM, SLOW the candle timer to show how much time left in a candle.
colors and positions are fully customizable.
enjoy
FREE
How To Trade
Execute your trades in 3 Easy Steps!
Step 1: Trade Setup Entry Buy in Signal Arrow color DodgerBlue. Entry Sell in Signal Arrow color RED. Success Rate ≥ 75% 100:25 Step 2: Set Stop Loss Stop loss BUY ----> You can set stop loss on Line RECTANGEL color DodgerBlue. Stop loss SELL ----> You can set stop loss on Line RECTANGEL color RED. Step 3: Set Take Profit Take profit BUY on RECTANGEL color RED. Take profit SELL on RECTANGEL color DodgerBlue. Strategy SIMPLE Day trading / Swi
FREE

"Drivers Road Bands" indicator that is designed to be used in the 1H, 4H and 1D timeframes in the most ideal way. If we compare timeframes to roads and streets; main streets and highways with high traffic volume are similar to high-time timeframes in technical analysis. If you can interpret the curvilinear and linear lines drawn by this indicator on the graphic screen with your geometric perspective and develop your own buy and sell strategies; you may have the key to being a successful trader.
FREE
Indicator Rua Alert Trend Line. This indicator will notify when the price breaks any trendline on the chart. Notifications will be sent to the phone and on MT4. Custom parameters: in_NumbersAlert: The number of notifications that will be sent when the price breaks the trendline. A product of Ruacoder Provide code indicator and EA services upon request. Contact: Telegram : https://t.me/Ruacoder
FREE

Данный индикатор позволяет узнать сколько цена может пройти на текущем баре. Он выискивает среднее значение ATR для предыдущих 5 баров и рисует 2 границы цены. Вы можете его использовать на любом таймфрейме любого инструмента. На основе этого индикатора можно выставлять уровни стоп лосса и и профита, а также использовать его и в других хороших стратегиях. Не забывайте пользоваться риск менеджментом во время торговли!
FREE

VR System – это не просто индикатор, это целая, хорошо сбалансированная торговая система для торговли на финансовых рынках. Система построена на классических правилах трейдинга и комбинации индикаторов Moving Average и канал Дончана ( Donchian channel ). В системе VR System учтены правила входа в рынок, удержание позиции в рынке и правила выхода из позиции. Простые правила торговли, минимальные риски, четкие инструкции делают VR System привлекательной торговой стратегией для трейдеров на финансо

Индикатор уровней на основе индикатора Zig-Zag - это высокоточный инструмент для торговли на Forex, который поможет вам улучшить вашу стратегию и принимать более точные решения. Он использует алгоритм Zig-Zag для определения различных уровней поддержки и сопротивления на рынке, исходя из чего можно определить, когда лучше всего войти или выйти из сделки. Этот индикатор обладает высокой производительностью и точностью в расчете уровней, что позволяет трейдерам получать максимальную прибыль при ми
FREE

BeST_Chande RAVI (Range Action Verification Index) is an MT4 Indicator that is based on the corresponding indicator developed by Tushar Chande which is mainly based on market momentum while focuses on identifying ranging and trending markets.
By default RAVI is defined by the formula: RAVI = Absolute value (100 x (SMA(7) – SMA(65)). Also by default there is an arbitrary reference level of 3% that means a market is ranging if the RAVI is less than 3%, or trending strongly if it is is greater t
FREE

FREE TopClock Indicator: This indicator is an Analog Clock That Shows: Local Time Of Pc or Time Of Broker Server or sessions(Sydney -Tokyo London -NewYork)Time or custom Time( with GMT -Base) this can shows Candle Time Remainer with Spread live. You can run this indicator several times for different times and move it to different places on the chart. If you would like, this indicator can be customized for brokers and their IB based on customer needs. For more information contact us if you
FREE

Quantum Swing 1.Что такое Quantum Swing ? Индикатор рассчитывает и отображает будущие ценовые уровни , на основе квантовой математики с высокой точностью вероятности и направления . Уровни отображаются в виде зон принятия торговых решений , чётко определяют узкий диапазон цен для выставления ордеров с минимальным стоп-лоссом и максимальным тейк-профитом. Индикатор отображает будущие торговые зоны на разных таймфрэймах H1 , H4 , D , W . Квантовые свинги так же отображаются без привязки к време
FREE
Highly configurable Bollinger Bands indicator. Features: Highly customizable alert functions (at levels, crosses, direction changes via email, push, sound, popup) Multi timeframe ability Color customization (at levels, crosses, direction changes) Linear interpolation option Works on strategy tester in multi timeframe mode (at weekend without ticks also) Parameters:
Bollinger Bands Timeframe: You can set the lower/higher timeframes for Bollinger Bands. Bollinger Bands Bar Shift: Y ou can set
FREE

Сигнальный индикатор, состоящий из нескольких широко известных индикаторов, обрабатывающих данные последовательно. 2 варианта - для графика и подвальный. В настройках возможно включить оповещения о смене тренда (алерты) звуковые, на e-mail и push. Есть возможность менять цвета и толщину линий, цвета и коды стрелок, количество расчетных баров и отдельно настраивать параметры входящих в состав индикаторов.
FREE

With this indicator, you can easily make price regions in all time zones. In addition, with the automatic supply demand finder, you can ensure that the new regions are found automatically. You can increase your transaction quality by reaching more accurate operations with this auxiliary Tool and indicator.
I share your trial version of EURUSD for free with you. If you want to buy the working version in all parities, you can contact me. +New version Gap Bar Add ( Press G keyboard ) Default co
FREE

The Trend Finding Channels indicator was developed to help you determine the trend direction by drawing channels on the graphical screen. It draws all channels that can be trending autonomously. It helps you determine the direction of your trend. This indicator makes it easy for you to implement your strategies. The indicator has Down trend lines and Up trend lines. You can determine the price direction according to the multiplicity of the trend lines. For example , if the Down trend lines s
FREE
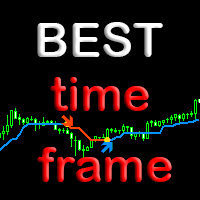
Индикатор BestTF поможет быстро выбрать самый лучший для торговли таймфрейм валютной пары или криптовалюты. Индикатор BestTF рассчитает и покажет в таблице крутизну графика (волатильность) для всех существующих таймфреймов текущего торгового инструмента. Почему важно правильно выбрать таймфрейм
Выбор таймфрейма является ключевым аспектом при торговле на валютном рынке по нескольким причинам:
Торговые стратегии: Различные торговые стратегии эффективны на разных таймфреймах. Например, краткоср
FREE

Индикатор для Скальпинга на Рынке Форекс и Торговли Бинарными Опционами Этот индикатор разработан для скальпинга на рынке Форекс и торговли бинарными опционами. Сигнал появляется при открытии новой свечи. Рекомендации по применению: Для Бинарных Опционов : Рекомендуется открывать сделки при появлении сигнала на 1 свечу. Сигнал на покупку появляется, когда синий икс сменяет красный, а сигнал на продажу - когда красный икс сменяет синий, как показано на скриншотах. Для Рынка Форекс: Вход в сделку
FREE

H I G H - P R O B A B I L I T Y - B R E A K O U T T R E N D L I N E I N D I C A T O R This is no ordinary trendline indicator. It has a highly-probability algorithms incorporated in the script to display only trendlines that may give a very high chance of price breakout. The indicator is not a stand alone indicator. Trader should interpret it together with their very own analysis technique to come up with a more efficient trading strategy. You can use with it other trend indic
FREE

Trends are like the "Saint Graal of traders": it can give you an higher win rate, a better risk to reward ration, an easier position management and so on...
But it is really hard to determine the trend with accuracy, avoiding fase signals, and with the right timing, in order to take massive movements. That's why I created the Trend Validator: a new and EASY tool that will make identifying trend and build new strategy a really easier work.
ANATOMY OF THE SOFTWARE
The indicator is composed b
FREE
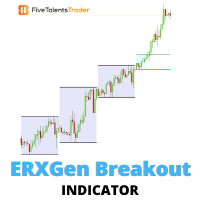
Без волатильности торговля на финансовых рынках была бы невозможна. Получить прибыль можно ТОЛЬКО за счет движения цены. Система ERXGen (Early Riser Next Generation) – методика краткосрочной торговли, основанная на том, что в определенные моменты времени в течение торгового дня волатильность растет. Основу ERXGen составляет очень популярная стратегия London Open Breakout с добавлением правил, повышающих стабильность и эффективность продукта. Для определения условий входа используется поведение ц

Определяет экстремумы. Данный индикатор состоит из двух частей: Первая рисует линии на графике, обозначающие низкую волатильность относительного дневной активности рынка. Вторая отвечает за определение экстремума и дает сигналы на покупку или продажу. Данная система подходит для любых инструментов. Рекомендуется использовать таймфрейм от м15 до н4. Перед использованием необходимо подобрать настройки под себя. Настроить отклонение линий. Указать коэффициент волатильности. Подпишись на мой telegr
FREE

Преимущества: Основан на классических индикаторах - ATR, Moving Average Определяет тренд/флэт на рынке, подкрашивая гистограмму соответствующим цветом Стрелками обозначены подтвержденные сигналы Является отличным фильтром для канальных стратегий (по экстремумам) Подпишись на мой telegram канал, ссылка в контактах моего профиля .
Настройки:
Наименование Описание настройки Period of Flat Detector Количество баров/свеч для анализа Period of EMA Период EMA (Moving Average) Period of ATR Пер
FREE
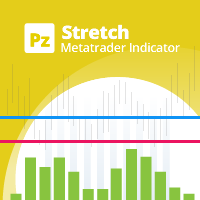
Индикатор Stretch – ценовая модель Тоби Крэйбела (Toby Crabel), которая находит минимальное среднее значение ценового движения/отклонения от цены открытия в определенный период времени и рассчитывает два уровня прорыва для каждого торгового дня. Расчет производится с помощью 10-периодной простой скользящей средней (SMA), представляющей собой абсолютную разницу между ценой открытия и ценовым максимумом или минимумом (в зависимости от такого, какое из значений меньше). Полученный результат использ
FREE

Введение в алгоритм GARCH Improved Nelder Mead GARCH - это сокращение от Generalized Autoregressive Conditional Heteroskedasticity (Обобщенная авторегрессионная условная гетероскедастичность). Представляет собой модель прогнозирования волатильности, обычно применяемую в финансовой сфере. Модель GARCH впервые появилась в работе датского экономиста Тима Петера Боллерслева (Tim Peter Bollerslev) в 1986 году. Лауреат Нобелевской премии 2003 года Роберт Ф. Энгл внес огромный вклад в усовершенствовани
FREE

Never miss a trend change again! This indicator uses various calculation methods based on price action to detect changes in the direction of the trend. It can be used on high timeframes (from H1 to D1) and is most suitable for H4 and Daily timeframe. This indicator is compatible with all broker symbols (forex, indices, CFD, commodities, crypto…). It is also possible to open the indicator on several charts to follow several symbols at the same time. In addition, you don't have to stand by your P
FREE

Introduction to Fractal Moving Average Fractal Moving Average indicator was designed as part of Fractal Pattern Scanner. Inside Fractal Pattern Scanner, Fractal Moving Average Indicator was implemented as multiple of chart objects. With over thousands of chart object, we find that it was not the best and efficient ways to operate the indicator. It was computationally too heavy for the indicator. Hence, we decide to implement the indicator version of Fractal Moving Average indicator to benefit
FREE

Индикатор показывает на графике к лассические уровни пивота , рассчитанные на основе предыдущего дня. Вы можете выбрать, с какого часа рассчитывать формулу. Торгуйте во флэте на разворот. На трендовом рынке используйте их как цель. Совместите со своими стратегиями для успешной торговли. Уровни строятся с помощью буферов и отображаются на всей доступной истории котировок.
Входные параметры.
Start Hour - с какого часа считать начало дня. 00 - по умолчанию. Show Mid Pivots - отображать промежу
FREE

Представляем Ms. Fibonacci , мощный и бесплатный индикатор, разработанный для упрощения процесса рисования и корректировки уровней Фибоначчи на графике. Этот индикатор автоматически идентифицирует и отмечает новые самые высокие и самые низкие уровни Фибоначчи, обеспечивая точное и точное размещение. Одной из ключевых особенностей Ms. Fibonacci является его способность правильно рисовать уровни Фибоначчи, указывать точки на точки и отмечать соответствующие ценовые уровни. Эта функция экономи
FREE
LordOscilatorSignal is a financial market indicator for Meta Trader, which uses standard market indicators; Stochastic, Moving Average, MACD, MA Xover, P.SAR.
Exactly! this single indicator has the help and assistants of (5) indicators.
The LordOscilatorSignal has a graphic panel of great visualization and understanding, being able to observe the values of each indicator and timeframes.
LordOscilatorSignal identifies through the trends of the buying and selling indicators, if all indicato

About testing Mode: To get the best usage experience please use the tick data to test and adjust the test speed to 30 !!!
InpDivideLine1=********************************************************************************* InpUseWithEA=false InpUseTradeBuyLine=false InpTheme=3 InpSHIcon=0 InpShowSHIcon=true InpShowOnRight=true InpShowMainTabByClickAutoHide=true InpShowMainTabByChartClick=true InpShowMainTabClickR=30 InpShowMainTabClickY=0 InpPlaySounds=true InpHShiftIcon=15 InpVShiftIcon=40 InpHSh
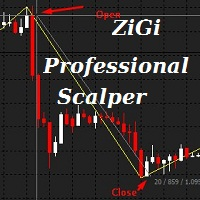
Индикатор ZiGi Professional Scalper : Инструмент реального анализа волн Этот индикатор раскрывает истинные волны рынка, выявляя чередующиеся максимумы и минимумы на графике цены, тем самым отображая волновую структуру рынка. Алгоритм этого индикатора совершенно новый, и его связь с ZiGi Professional Scalper и zigzag чисто косметическая. Он основан на восьми радикально различных алгоритмах и способен вычислять объемы рынка в реальном времени. При использовании этого индикатора ручное нанесение
Moving Average Crossover Scanner This Scanner scans two moving averages(MA) crossover across multi-currency pairs and multi-time frames and shows all the result in the dashboard. 1. The fast MA is about to cross up the slow MA - designated as "XUP". 2. The fast MA is about to cross down the slow MA - designated as "XDN". 3. The fast MA has just crossed up the slow MA - designated as "UP". 4. The fast MA has just crossed down the slow MA - - designated as "DN". Input parameters can be changed

The Market Profile Indicator for MT4 displays the price levels and zones where increased trading activity happens. These zones with substantial forex trading activity provide the forex traders with the best entry levels, support, and resistance levels. Moreover, price levels indicate the best reversal zones. As a result, forex traders can identify BULLISH and BEARISH market trends and BUY and SELL entry points as well as the best reversal points. The indicator works well in all intraday timefram
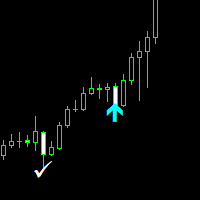
Nasdaq Savages Non-repaint indicator works on all timeframes 1 minute to 15 minutes timeframe for scalpers. 30 Minutes to Monthly timeframe for swing traders The Nasdaq Savages indicator comes with a top right info tab which tells you about the current buy or sell signal, Profit in pips, Stop loss and Target Red arrow is your sell entry signal the white right tick is your exit signal and take profit hit signal Light blue arrow is your buy entry signal the white right tick is your exit signal an

Introducing the "Magic Trades" for MetaTrader 4 – your ultimate tool for precision trading in dynamic markets. This innovative indicator revolutionizes the way you perceive market trends by harnessing the power of advanced analysis to detect subtle changes in character, paving the way for optimal trading opportunities.
The Magic Trades Indicator is designed to empower traders with insightful entry points and well-defined risk management levels. Through its sophisticated algorithm, this indica
It is a very simple indicator to display daily loss percentage, open position loss percentage, monthly loss percentage and monthly profit percentage. MT5 version
We assure you that we welcome any suggestions to improve this indicator and make the necessary changes to improve this indicator.
You can contact us via Instagram, Telegram, WhatsApp, email or here. We are ready to answer you.

The Market Sessions Indicator for MT5 helps you predict market turnarounds by detecting major supply and demand areas. These pivot points tend to occur after a new session has started and the previous one is still open. It is also used to gauge how many points or pips the market moves on average during a session. This helps us to place better our take profits and stop losses. The indicator works on all forex pairs, gold, silver, commodities, stocks, indices and any other instrument that your
This indicator scanning thorough the history and drawing horizontal rays on all bars untested lows and highs. Fresh supply/demand zones and support/resistance levels will be marked down. It allows to be sure that certain levels is fresh and has not been tested yet. Usually after strong departure price is not retesting base immediately and leaving unfilled orders. There is no inputs, so indicator is ready to go. Version for MT5 is also available here: https://www.mql5.com/en/market/product/3084
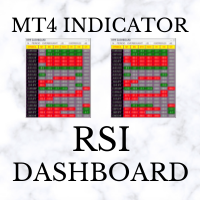
RSI Dashboard uses the value of Relative Strength Index indicator. The parameters can be adjusted via the Edit boxes of this dashboard. The monitoring pairs will be selected by adding to the Market Watch (no need to set prefixes or suffixes) , you can monitor many pairs as you like. This dashboard will check almost popular time frame (M1,M5,M15,M30,H1,H4 and D1). The colors can be customized. We can have a look at many pairs and many time frames without opening the chart. In addition, we can
MetaTrader Маркет - торговые роботы и технические индикаторы для трейдеров, доступные прямо в терминале.
Платежная система MQL5.community разработана для сервисов платформы MetaTrader и автоматически доступна всем зарегистрированным пользователям сайта MQL5.com. Ввод и вывод денежных средств возможен с помощью WebMoney, PayPal и банковских карт.
Вы упускаете торговые возможности:
- Бесплатные приложения для трейдинга
- 8 000+ сигналов для копирования
- Экономические новости для анализа финансовых рынков
Регистрация
Вход
Если у вас нет учетной записи, зарегистрируйтесь
Для авторизации и пользования сайтом MQL5.com необходимо разрешить использование файлов Сookie.
Пожалуйста, включите в вашем браузере данную настройку, иначе вы не сможете авторизоваться.