Смотри обучающее видео по маркету на YouTube
Как купить торгового робота или индикатор
Запусти робота на
виртуальном хостинге
виртуальном хостинге
Протестируй индикатор/робота перед покупкой
Хочешь зарабатывать в Маркете?
Как подать продукт, чтобы его покупали
Технические индикаторы для MetaTrader 4 - 21

This trial scanner works with the other "Smart Market Structure Opportunity Scanner", and is basically an extension of that scanner with added features to find more accurate entry opportunities for day trading or refined swing trading. The most important added features are: 1) The ADRs ( Average Daily Range ) for the last 5 days would have color and +/- sign that shows the direction of each days ADR move. 2) I added RSI values for each of the trading timeframes ( 1min, 5min, 15min, 30min
FREE

*This is tradingview indicator converted to mql4*
The Chandelier Exit Indicator is a popular technical analysis tool developed by Chuck LeBeau. It is designed to help traders identify potential exit points for their trades based on market volatility and the concept of trailing stops. The Chandelier Exit Indicator consists of three main components: Average True Range (ATR): The indicator utilizes the Average True Range, which measures market volatility. The ATR calculates the average range bet
FREE

Индикатор Blahtech Fisher Transform представляет собой осциллятор, который отображает графике области перекупленности и перепроданности. Алгоритм преобразования Фурье (Fisher Transform) преобразует цены с любой формой распределения в нормальное распределение. Конечным результатом является кривая с резкими точками разворота, которые могут помочь определить бычьи или медвежьи тренды. Значения Fisher Transform выше 1.6 на дневном графике считаются хорошими областями для сделок на разворот.
Основн

Целью этой новой версии стандартного MT4 индикатора, входящего в поставку платформы, является отображение в подокне нескольких таймфреймах одного и того же индикатора. См. пример, приведенный на рисунке ниже. Однако индикатор отражается не как простой индикатор MTF. Это реальное отображение индикатора на его таймфрейме. Доступные настройки в индикаторе FFx: Выбор таймфрейма для отображения (от M1 до MN) Установка ширины (количество баров) для каждого окна таймфрейма Всплывающее оповещение/звуков
FREE

This Scanner Dashboard uses the Extreme TMA System Arrows Indicator to show good BUY/SELL signals. This Product contains dashboard only. It does not contain the Abiroid_Arrow_Extreme_TMA.ex4 indicator. Arrows indicator is not necessary for dashboard to work. To see arrows, you can buy the arrows indicator separately if you like: https://www.mql5.com/en/market/product/44822
Dash shows Slopes for current and Higher Timeframes. - 1st diamond is current TF. Next diamonds are higher TFs
(Please N

Magic Moving это профессиональный индикатор для торговой платформы MetaTrader 4. В отличие от Moving Average , Magic Moving дает более качественные сигналы и способен выявлять длительные тренды. В индикаторе есть возможность настроить уведомления (алерт, почта, телефон), что поможет вам не пропустить торговый сигнал. Версия Magic Moving для терминала MetaTrader5 : https://www.mql5.com/ru/market/product/35363 Преимущества индикатора Индикатор прекрасно подходит для скальпинга. Дает минимум

Introducing the Pivot Point Selector Indicator: Your Ultimate Tool for Custom Pivot Levels Are you ready to take your trading to the next level? Say hello to the Pivot Point Selector Indicator, a game-changing tool that puts you in control of your pivot levels. This innovative indicator empowers you to choose three specific points that will determine the pivot level calculations, giving you unparalleled customization and precision in your trading strategy. Key Features and Benefits: Custom Pivo
FREE

You've probably heard about the Dow trend Theory, where higher highs and lows indicate an uptrend, and lower highs and lows indicate a downtrend. This indicator determines this trend based on the Dow Theory. You just need to enter a number representing the number of candles between extremes. The optimal solution is the number 3, unless you want to have the trend from M5 but you're on M1, then you need to multiply this number by 5. Check various combinations to trade with the trend. In the scree
FREE

Данный сканер показывает значения тренда известного индикатора SuperTrend для множества инструментов (до 30) и 8 таймфреймов. Уведомляет о смене направления тренда в терминале MetaTrader 4, по email и push-уведомлением. Это бесплатная версия индикатора SuperTrend Scanner Бесплатная версия работает только на EURUSD и GBPUSD!
Важная информация Для максимального использования потенциала сканера прочитайте полное описание (на английском языке): www.mql5.com/en/blogs/post/718074
Бесплатная версия
FREE

Семафорный индикатор основан на стандартном индикаторе RSI, на который наложен индикатор Envelopes, который показывает конверт или границы колебания индикатора. Это версия индикатора RSI vs Envelopes который рисуется только в окне символа . Сигнал на продажу возникает, когда верхний конверт/граница пробивается индикатором RSI сверху вниз. Сигнал на покупку возникает, когда нижний конверт/граница пробивается индикатором RSI снизу вверх. Индикатор имеет возможность рисовать стрелки на индикаторе,
FREE

Search for an entry with low risk for trading by Lisek Waves Indicator. Using Lisek Waves Indicator can improve your trading performance. In it’s simplest form, this trading tool make it easy to s earch for an entry with low risk and to manage your trade and risk. Lisek Wave analysis is based on the notion that markets follow specific patterns called waves which are the result of a natural rhythm of crowd psychology that exists in all markets. You can avoid the loss from taking trades that are
FREE

Limited time offer! For the launch of NextBot , which has been working on a real account for about a year doubling the initial capital, the price of this indicator will drop to FREE ! Introducing a pragmatic and innovative tool for MetaTrader 4 (MT4) traders: the Linear Regression Next channel indicator, enhanced with the determination coefficient R 2 . This indicator serves as a foundational tool for traders seeking to understand market trends through the lens of statistical analysis, spe
FREE

Мультитаймфреймовый индикатор фракталов, который показывает фрактальные точки старшего таймфрейма на младших таймфреймах.
Параметры Fractal_Timeframe : старший таймфрейм для фракталов. Maxbar : максимальное количество свечей для вычислений. Up_Fractal_Color, Up_Fractal_Symbol, Down_Fractal_Color, Down_Fractal_Symbol : настройки цветов и стилей фрактальных точек. Extend_Line : рисовать горизонтальную линию из предыдущей фрактальной точки до перекрывающей ее свечи или до указанной длины. Extend_
FREE

Th indicator is a technical analysis tool that helps identify significant changes in price trends and filter out minor price fluctuations. It is used to highlight price swings and provide a clearer picture of market movements. The Pivots are found by checking if a certain candle is the highest/lowest in a given number of candles that come before and after it. This indicator has only one input, its period. The Higher the period, the more strict the indicator is about what constitutes a Pivot. Th
FREE

Сглаженный осциллятор основанный на базовых индикаторах DeMarker. Показывает изменчивость направления цены. Может применяться для определении внутридневных точек входа и выхода из рынка.
Подходит для использования на всех тайм-фреймах и торговых инструментах. Рекомендуется использовать На M5, M15 и M30.
Зеленая линия показывает направление цены вверх, синяя линия показывает направление цены вниз. Красная линия сглаженное представление цены.
Входные параметры
Period - Период основного инди
FREE

Индикатор отображает на графике важные технические уровни. Эти уровни выступают поддержкой или сопротивлением для движения цены. Наиболее важные уровни кратные 100 и 50 пунктам. Также можно вывести уровни кратные 25 пунктам. При достижении ценой уровня выводится алерт или пуш-уведомление. Версия для MT5 https://www.mql5.com/ru/market/product/69740 Настройки
Show Levels 100 pips - показать уровни кратные 100 пунктам Show Levels 50 pips - показать уровни кратные 50 пунктам Show Levels 25 pips
FREE

The product Divergence Mom Stoch Adx Bears Bulls is designed to find the differences between indicators and price. It allows you to open orders or set trends using these differences. The indicator has 4 different divergence features.
Divergence types Class A Divergence Class B Divergence Class C Divergence Hidden Divergence
Product Features and Rec ommendations There are 5 indicators on the indicator Indicators = Momentum Stochastic Adx Bears Bulls 4 different divergence types are used
FREE

Индикатор объединил 5 популярных стратегий. Рисует стрелку после подтверждения сигнала по выбранной стратегии. Есть оповещения по сигналам. Не перерисовывает свои значения. Рекомендую посмотреть моего советника - Night Zen EA
Подпишись на мой telegram канал, ссылка в контактах моего профиля .
5 стратегий. Главная линия пересекает сигнальную. Главная линия пересекает сигнальную в зоне перепроданности (для покупок) / перекупленности (для продаж). Главная линия входит в зону перепроданности
FREE
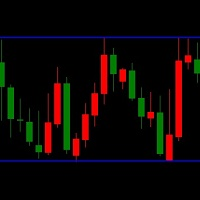
LT Triple Support Resistance Screen Method is a kind of levels indicator that consist of three SR lines. It is built by MQL4 programming language and can be used to MT4 platform. A free version indicator to determine the support and resistance levels easily This indicator works based on the screen method to calculate the most appropriate value for each buffer. A complex algorithm based on long research is applied to this free custom indicator. But this indicator has limited features and simpler
FREE

Introduction and Description
The indicator displays an arrow whenever a " Bearish Engulfing " is detected. The latter usually indicates the beginning of a downward trend. A bearish engulfing pattern is a technical chart pattern that signals lower prices to come. The pattern consists of an up candlestick followed by a large down candlestick that eclipses or "engulfs" the smaller up candle. The pattern can be important because it shows sellers have overtaken the buyers and are pushing the price m
FREE

For some trader's charts analysis use, specially for multi timeframe trading strategies . When you need to check something of the time within different timeframe at the same symbol chart, even different symbol charts, this indicator will show the crosshair at sync moving. You just need to load this indicator into some charts, then the crosshair will shown automatic.
FREE
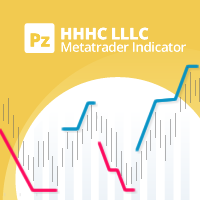
Пользовательская реализация известного трендового принципа "более высокий максимум - более высокая цена закрытия и более низкий минимум - более низкая цена закрытия" (higher high, higher close, lower low, lower close: HHHC - HHHL). Индикатор использует движение цены для определения направления тренда, его смены и зон отката. Настраиваемый период прорыва Настраиваемые цвета и размеры Не перерисовывается, не меняет значений Доступны все типы алертов. Отображает три ценовые зоны: Зоны на покупку от
FREE

Индикатор запаса хода, означает среднестатистическое дневное движение цены. Для удобства визуально отображается на графиках, но с таймфреймом H4 и ниже. Индикатор перерисовывается ежедневно и учитывает гэпы. Дополнительная пунктирная линия означает 80% пройденного дневного движения. Важный инструмент в арсенале профессионального трейдера или того, кто хочет им стать. PrimeTools - это серия продуктов предназначенных для правильной и профессиональной торговли. [ PrimeTools Levels | PrimeTools Rang
FREE

PipTick VWAP является версией индикатора Volume-Weighted Average Price. VWAP - это соотношение между торгуемым значением (цена, умноженная на число торгуемого объема) и общим торгуемым объемом за определенный период времени. Он гораздо лучше измеряет среднюю цену инструмента по сравнению с обычной скользящей средней. Хотя и существует множество способов применения VWAP, большинство инвесторов используют его для расчета среднего дневного диапазона. Индикатор работает в пяти режимах: Moving - В да

Тренд индикатор Уникальная система определения тренда для каждого таймфрейма,
Позволяет по любой валютной паре иметь реальную картину тренда по всем стандартным таймфреймам! Зеленые квадратики BUY тренд а красные SELL.
Техника торговли если мелкие тайм фреймы противоположны тренду старших то по инерционости движения рынка вход по старшим таймам как на скринах.
FREE

Индикатор IceFX Heatmap показывает участки на графике, на которых цена наиболее долго оставалась в боковике в пределах последних нескольких дней. Такие участки отображаются в стиле тепловой карты ("Heatmap style"), наглядно демонстрируя основные уровни. Участки, на которых цена задерживалась наиболее долго, показаны более светлым цветом (при черно-белом отображении) или красным цветом (при цветном отображении).
Настройки Days - количество дней, для которых рассчитывается тепловая карта. Resolu
FREE

Существует огромное количество свечных моделей, но действительно знать нужно только некоторые из них. Индикатор Candlestick Pattern Filter распознает и выделяет наиболее надежные свечные паттерны. Учтите, что эти паттерны могут быть полезны, только если вы понимаете, что происходит в каждом из них. Для наилучших результатов их следует использовать совместно с другими формами технического анализа. Включены следующие модели: Молот / Повешенный Перевернутый молот / Падающая звезда Бычье / медвежье
FREE

This indicator is designed to find the difference in RSI price and indicator. This indicator shows the price and indicator difference on the screen. The user is alerted with the alert sending feature. Our Popular Products Super Oscillator HC Cross Signal Super Cross Trend Strong Trend Super Signal
Parameters divergenceDepth - Depth of 2nd ref. point search RSI_Period - Second calculation period indAppliedPrice - Applied price of indicator indMAMethod - MA calculation method findExtInt
FREE

MACD Display is a MACD disaplay and cross monitoring indicator,which can works on 6 timeframe at same time. Indicator advantage: 1. Deviation from the point can be drawn on the main picture and indicator drawing. It is convenient to observe and can be hidden or displayed by parameter setting. 2. Deviation from the entry point is clearly indicated by the arrow in the drawing. 3. Cross-cycle monitoring can simultaneously monitor the MACD deviation and the golden dead fork of the six-cycle framewor

The Awesome Oscillator (AO) Signal Candle Indicator is an indicator used to measure market momentum. Awesome Oscillator (AO) Signal Candle Indicator will change bar's color when set overbought or oversold levels reach. Colored Candles, based on Awesome Oscillator (AO) Signal.
-If the indicator is above zero, the market is bullish. -If the indicator is below zero, the market is bearish. -If the market is bullish, you can take a stand with green candle signals. -If the market is bearish,
FREE
Please leave 5 Stars to me
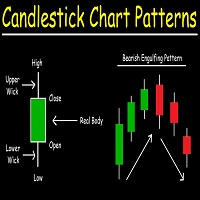
Candlestick Patterns Scanner is professional indicator that will assist and alert you to identify candlestick patterns on meta trader 4 charts whenever a pattern appears on the chart. In financial technical analysis , a candlestick pattern is a movement in prices shown graphically on a candlestick chart that some believe can predict a particular market movement. The recognition of the pattern is subjective and programs that are used for charting have to
FREE

Индикатор показывает канал регрессии, в расчете которого используется золоте сечение Фибоначчи Уровни строятся не как графические объекты, а используют индикаторные буферы - это позволяет использовать данный индикатор в советниках Вблизи границ канала наиболее вероятны коррекции и развороты цены Позволяет вести трендовую и контр трендовую торговлю внутри канала Наклон канала показывает направленность рынка, а его ширина - текущую волатильность Работает на всех таймфреймах, на любых валютных пара
FREE
Индикатор показывает время формирования текущего бара в процентом соотношении.
Настройки индикатора color_back1 - цвет фона 1 color_flat1 - цвет границы для фона 1 color_back2 - цвет фона 2 Alert_Percent - значение процента для подачи звукового сигнала Sound_file - наименование звукового файла, пользовательский звуковой файл должен находиться в терминальной папке в под папке Sound и иметь расширение - .wav
FREE

Целью этой новой версии стандартного MT4 индикатора, входящего в поставку платформы, является отображение в подокне нескольких таймфреймах одного и того же индикатора. См. пример, приведенный на рисунке ниже. Однако индикатор отражается не как простой индикатор MTF. Это реальное отображение индикатора на его таймфрейме. Доступные настройки в индикаторе FFx: Выбор таймфрейма для отображения (от M1 до MN) Установка ширины (количество баров) для каждого окна таймфрейма Всплывающее оповещение/звуков
FREE

This indicator is the translated version of Anıl ÖZEKŞİ's MOST Indicator, developed on the Matriks Data Terminal, into the MQL4 language. It is a trend-following indicator and quite successful. Its usage will be free and unlimited for a lifetime. You can click on my profile to access the MQL5 version of this indicator. You can also get your programming requests for MQL4 and MQL5 languages done at İpek Bilgisayar with an invoiced service. You can reach İpek Bilgisayar at www.ipekbilgisayar.org .
FREE

SuperTrend AM - индикатор который позволяет открыть позицию в самом начале значительного движения цены. Вторым важнейшим качеством индикатора является способность максимально долго следовать тренду для получения всей потенциальной прибыли при этом минимизируя потенциальные убытки. Индикатор не перерисовывается и не пересчитывается. Вариант данного индикатора с расширенными возможностями по настройке и уведомлениями о сигналах - SuperTrend 3 .
Сигналы при работе с индикатором: появление красно
FREE
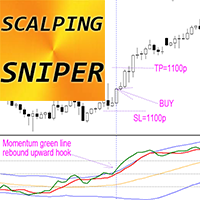
Forex Indicator SCALPING SNIPER for MT4 , No Repaint Trading System Scalping Sniper - is advanced system (indicator) showing accurate price momentum! Upgrade your trading methods with the professional Scalping Sniper Indicator for MT4. This system provide very accurate but rare sniping signals, with win rate up to 90% System suppose to use many pairs to search for signals to compensate low number of signals per one pair. Scalping Sniper consist of: Top & Bottom Volatility lines (Blue colo

отличный инструмент для любого трейдера как для форекс так и для бинарных опционов подойдет любому трейдеру ничего настраивать не нужно все отточено времинем и опытом инструмен совместил в себе 5 индикаторов и 3 собственных стратегии отлично работает на во время флета та и в тренде Он указывает на разворот тренда в самом его начяли хорошо работает по тренде
Рекомендации по торговле Сигнал формулируется на текущей свечи Входить в сделку следует на следующей
Возможен пересчет (редко)
RSI Alert Pro - это гибко настраиваемый индикатор RSI с богатыми функциями алертов и слежения за уровнями RSI.
Входные параметры Параметр Допустимые значения Описание
Использовать модуль синтеза речи Alerts Pro (Use Alerts Pro Voice Synthesis module) true/false Предоставляет голосовые алерты для трейдеров, у которых есть модуль Alerts Pro (требуется дополнительная покупка) Включить Push-уведомления (Enable Push Notifications) true/false Если указано 'true', система будет отсылать push-ув

Indicator MT4 : RSI MA is Moving average of strength index
Objective : Find entry price for the good trade
How to set up indicators RSI MA : 1. RSI period 14. 2. MA you can set calculate price and method price. 3. MA period 9. 4. Arrow setting : 6 types. 5. Alert setting : Next bar or Instant bar. 6. Choose display for 1 or 2 calculation by formula.
How to trade for success : Entry point : Buy / Long position 1. When arrow up direction show 2. TP : RSI OVB
Entry point : Sell / Short posi

This is the finest structure marking you will ever find in any market. indicator is coded considering the actual structure any trader would use. indicator is coded based on actual candle breaks and not coded based on any pivot or predefined values or specific number of candles high and low. please check out the screenshot. if you want me to fine tune it according to your needs then i am open for it.
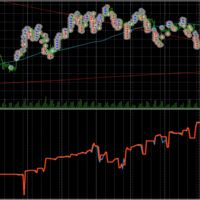
Graph shows your balance and equity in real time similar to the tester graph which is nice to see your real progress vs tester graph. This code was copied from mql5.com, it was free and it works im just putting it here to make it easier for us :-) https://www.mql5.com/en/code/13242
https://www.mql5.com/en/code/8454 .. original code
//+------------------------------------------------------------------+
//| Equity Monitor |
//| Monitori
FREE

The indicator helps the trader in identifying potential liquidity levels. The algorithm used in this indicator checks the behavior of the asset taking into account the price levels, momentum and volume analysis.
Features:- Parameters for signal optimization and alerts.
Usage:- The levels formed by the indicator can be helpful to traders in identifying potential entries, breakouts or reversals. it can assist traders of technical trading background or even pure price action trading. Examples o
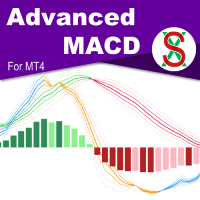
MACD ( M oving A verage C onvergence/ D ivergence) is a widely used indicator in technical analysis. What makes the MACD such a valuable tool for technical analysis is that it effectively combines two indicators into one. It can help to identify trends and measure momentum simultaneously. SX Advanced MACD for MT5 is available here . SX Advanced MACD indicator takes this concept further by plotting two distinct MACD indicators on a single chart, facilitating clear visual correlation between each
Introducing our groundbreaking Forex indicator, specifically designed to help traders master the art of identifying critical support and resistance zones, as well as double top and double bottom patterns with unprecedented accuracy. Say goodbye to guesswork and hello to a powerful tool that will revolutionize your trading experience. Our proprietary indicator leverages cutting-edge technology to recognize key price levels where buying and selling pressures are poised to shift the market dynamic

С данным индикатором вы ощутите полную свободу, вам больше не придется часами высматривать воды в сделку и гадать об уровнях стоп-лосс и тейк-профит. Теперь все стало просто. Данная система навеяна двумя популярными стратегиями в свое время: Система Черепах и PVRSA. Я взял лучшее от обеих и сделал этот прекрасный индикатор.
Правила торговли:
Красный бар означает повышенный объем, и нужно искать возможность для входа в рынок
При наличии четкого сигнала появляется стрелка - можно открывать
FREE

ECM Elite Channel is a volatility-based indicator, developed with a specific time algorithm, which consists of finding possible corrections in the market.
This indicator shows two outer lines, an inner line (retracement line) and an arrow sign, where the channel theory is to help identify overbought and oversold conditions in the market.
The market price will generally fall between the boundaries of the channel. If prices touch or move outside the channel, it's a trading opportunity.
The
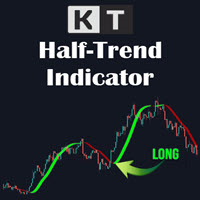
The KT HalfTrend is a moving average-based trend indicator that draws zones. It marks a trend shift by drawing bearish and bullish invalidation zones on the chart. It also displays the trend buy-sell strength with arrows on the main chart. The indicator will be flat if no trend indicates accumulation, temporary price, or distribution zones. If there is a trend, there will be a slope in that direction. The trend signals are substantial if the slope is steep, either to the upside or the downside.
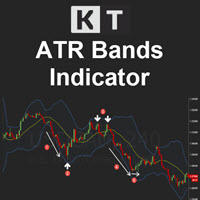
KT ATR Bands draws the volatility envelops and bands using a combination of Average True Range and Moving average. They are typically used to identify the potential reversal points and the periods of high and low volatility.
Features
Multi-Timeframe Ability: For example, you can have the atr bands from the daily timeframe on the H1 timeframe. Smart Alerts: You can turn on/off alerts for each band separately. Also, you can choose a minimum time interval between each alert to stop unnecessary,

Interceptor – профессиональный индикатор объема и ценовых экстремумов. Interceptor объединяет в одном алгоритме четыре типа нормализованных индикаторов, определеяя ценовые экстремумы, приводящие к коррекциям и разворотам тренда. Алгоритм построен в основном на сочетании Accumulation/Distribution , On Balance Volume , Money Flow Index и Relative Strength Index . Первый параметр ( Interceptor_Depth ) определяет интервал нормализации в барах для анализа Accumulation/Distribution и On Balance Volume

[ MT5 Version ] Backtesting Simulator Are you tired of spending months on demo or live accounts to test your trading strategies? The Backtesting Simulator is the ultimate tool designed to elevate your backtesting experience to new heights. Utilizing Metatrader historical symbol information, it offers an unparalleled simulation of real market conditions. Take control of your testing speed, test ideas quickly or at a slower pace, and witness remarkable improvements in your testing performance. For
Trend Scanner - это трендовый индикатор, помогающий определить текущее и прогнозируемое направление рынка с помощью продвинутого алгоритма. Благодаря гибким настройкам оповещения, индикатор своевременно предупредит вас о развороте тренда. Индикатор интуитивно понятен и прост в использовании, и станет отличным фильтром в ваших трендовых торговых стратегиях. Линии данного индикатора, так же являются отличным динамическим уровнем для стоп-лосса, и применяется как один из видов трейлинг-стопа в Торг
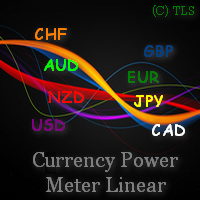
Линейный индикатор силы валют с возможностью фильтрации путем сглаживания значений. Показывает текущую силу выбранных валют (максимально 8), а также исторические значения. Расчёт зависит от выбранного таймфрейма графика, на который установлен индикатор. Индикатор отображает данные в виде линий для всех валют или в виде гистограммы для текущей валютной пары. Пересечение индексов силы валюты для текущей валютной пары дополнительно отображается в виде стрелок на графике. Текущее направление тренда

An indicator based on candlestick patterns
To catch short-term and long-term trends
If it gives a signal in the direction of the trend, it is long term
And if it gives a signal in the opposite direction of the trend, it is short term
Too many signals
Can be used in all symbols
Can be used in all time frames
Attributes: Too many signals Can be used in all symbols Can be used in all time frames Simple settings Simple and fast usage With author lifetime support
Settings: Candle back: Th

ATR Scanner Pro is a multi symbol multi timeframe volatility scanner that monitors and analyzes Average True Range indicator value in up to 28 symbols and 9 timeframes in 3 modes : ATR value: As a volatility dashboard it shows the ATR indicator value in all pairs and timeframes and signals when the ATR value reaches a maximum or minimum in a given duration. Short term ATR/Long term ATR ratio: It shows ratio of 2 ATRs with different periods. It's useful in detecting short term volatility and e

Quante volte ti è capitato di aver bisogno di avere a grafico i livelli chiave di una candela chiusa del time frame precedente? Con PastProjection potrai far disegnare i livelli di Apertura, Chiusura, Massimo e Minimo della candela chiusa al time frame superiore scelto. I livelli sono spesso importanti e diventano supporti o resistenze, o entrambi. La prima volta che vengono raggiunti spesso fanno reagire la quotazione. I pattern su questi livelli sono spesso più efficaci. Tali livelli sono sign
FREE

Особенности Поддержка создания месячных, недельных, дневных, четырехчасовых, часовых и тридцатиминутных профилей. Дневной профиль имеет настраиваемое время запуска. Слияние и разделение рыночных профилей. Точка привязки профиля может быть экспортирована в формат CSV для последующего анализа.
Параметры индикатора Indicator Update Interval - период расчета индикатора, от 250 милисекунд до 2,5 секунд Indicator Setting ID - Идентификатор для текущих настроек индикатора. Profile Number - Количество

This indicator plots Heiken Ashi candles in a subwindow instead of the main chart, making it possible to analyse HA candles whilst keeping the main chart clean.
- optional bid/close line is provided, stylable, updates on tick - HA candles are stylable via the inputs tab - optional price smoothing to the HA candles, with moving average period and method options - auto-scaling when scrolling back and forth
FREE

This indicator is stand alone version from MP Pivot Levels (All in one) containing Woodie Pivots. Woodie’s pivot points are made up of multiple key levels, calculated from past price points, in order to frame trades in a simplistic manner. The key levels include the ‘pivot’ itself, and multiple support and resistance levels (usually up to three each). Traders use these levels as a guide for future price movements when setting up trades.
The pivot : (Previous high + previous low + 2 x previou
FREE

RSI Scanner is a multi symbol multi timeframe RSI dashboard that monitors Relative Strength Index indicator for price entering and exiting overbought and oversold in up to 28 symbols and 9 timeframes.
Download Demo here (Scans only M1 and M5) Settings description here MT5 version here
RSI Scanner features: Signals RSI entering and exiting the overbought and oversold zones. Monitors 28 customizable instruments and 9 timeframes at the same time. You can choose between 3 alert modes: Sin
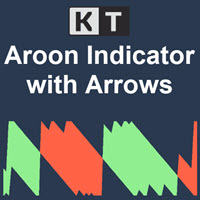
KT Aroon oscillator is the modified version of the original Aroon oscillator initially developed by Tushar Chande in 1995. It measures the time interval between the ongoing highs and lows and uses this deduction to calculate the market trend's direction and strength. It works on the notion that the price will form new highs consecutively during an uptrend, and during a downtrend, new lows will be formed. Buy Signal: When Aroon Up line cross above the Aroon Down line.
Sell Signal: When Aroon Do

Индикатор Profit/Loss Meter позволяет измерить Прибыль/Убыток будущей, прошлой или текущей сделки в валюте депозита и оценить уровень маржи на момент окончания сделки. Индикатор работает на базе встроенного МТ4 инструмента "Перекрестие" и имеет следующие параметры: Trade Direction = Buy/Sell Направление позиции Lot size = 0.1 Размер лота Font size = 8 Размер шрифта Font color = DeepSkyBlue Цвет шрифта Offset horizontal Сдвиг текста по вертикали Offset vertical Сдвиг текста по горизонтали
FREE
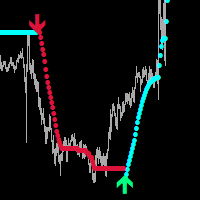
Global Parabolic MT4
Индикатор для скальпинга на M1-M5. Очень хороший индикатор для вашей торговой системы,его можно использовать как отдельную торговую систему, рекомендую использовать совместно с - System Trend Pro
Индикатор не перерисовывается и не изменяет свои данные.
Настройки: Меняйте параметр FILTER для точных входов в рынок.
Остались вопросы? нужна помощь?, я всегда рад помочь, пишите мне в личные сообщения или В телеграмм
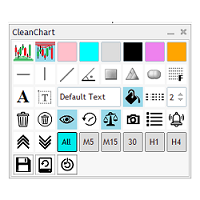
Вы устали от того, что на вашем текущем графике появляются испорченный график с объектами графика из разных пар?
Вам скучно нажимать несколько кликов, чтобы обновить цвета и стили объектов?
Вы хотите иметь возможность загружать определенный набор конфигураций для наиболее часто используемых объектов диаграммы?
Не смотрите дальше, у CleanChart есть все.
4 настраиваемых цвета Настраиваемые пользователем цвета поддержки и сопротивления 10 наиболее часто используемых объектов графика Таймфр
FREE

Keltner Trend Pro - Unleash the Power of Price Action! Are you ready to transform your trading approach? Meet Keltner Trend Pro, an Expert Advisor meticulously crafted to harness the dynamic movements of the market using the renowned Keltner Channel and Average True Range (ATR) indicators. Limited-time Special Opportunity: Seize the moment! Be among the first 10 (Purchasing 0/10) to seize this unique opportunity, and not only will you acquire a top-tier trading algorithm but also enjoy an exclu
FREE
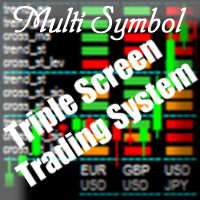
Назначение Индикатор создан для ручной мультивалютной торговли по системе Три Экрана Элдера. Индикатор работает с любыми символами, находящимися в окне Обзор Рынка МТ4, - валютами, металлами, индексами и т.д. Количество инструментов ограничено лишь разрядностью параметров МТ4. Но при желании можно создать несколько окон с разным набором инструментов и параметров.
Принцип работы Индикатор использует модифицированную систему Три Экрана, по которой на третьем экране определяется направление тренд

With this easy to set up indicator you can display and set alerts for the following candlestick formations: Bull Breakout, Bear Breakout, Hammer, Pin, Bullish Engulfing, Bearish Engulfing. I'd appreciate if you would review the indicator
Input parameters: ShortArrowColor: The color of the Arrows, displaying a Bearish candle formation LongArrowColor: The color of the Arrows displaying a Bullish candle formation BullishEngulfing: Disabled/Enabled/EnabledwithAlert BearishEngulfing: Disabled/Ena
FREE

Netsrac SR Dashboard
Примечание. Этот индикатор нельзя использовать в тестере стратегий. Демо версия тут с маркета не работает. Пожалуйста, используйте бесплатную версию индикатора для тестирования: https://www.mql5.com/de/market/product/34863
смысл С приборной панелью SR вы получаете мощный инструмент для управления наиболее важной информацией в торговле. Соберите настройку в соответствии со своей стратегией и получите информацию, как только эта настройка вступит в силу. Назначьте разные т

Индикатор PipTick Pivot автоматически рассчитывает и отображает линии уровней разворота, а также уровни поддержки и сопротивления. Уровень разворота может рассчитываться по разным формулам: классическая, Floor, Fibonacci, Woodie, Camarilla или DeMark. Можно выбрать период для расчета индикатора. Период может быть дневным, недельным, месячным или пользовательским.
Типы пивотов: Классический. Floor. Fibonacci. Woodie. Camarilla. DeMark.
Основные характеристики Индикатор показывает текущие и ис
FREE
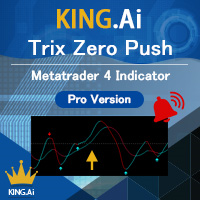
The brand new trading indicator using TRIX strategy is exclusive presented by KING.Ai. Exclusive Functions including Mobile Push Notification . This indicator with Three-mode alerts is developed by KING.Ai ONLY. It is probably impossible that you could find a TRIX indicator like this one. It is very difficult for you to trade with the Trix strategy as there is limited time for traders to monitor every currency. However, the Trix strategy is very profitable especially using in DAY CHAT. It
MetaTrader Маркет предлагает каждому разработчику торговых программ простую и удобную площадку для их продажи.
Мы поможем вам с оформлением и подскажем, как подготовить описание продукта для Маркета. Все продаваемые через Маркет программы защищаются дополнительным шифрованием и могут запускаться только на компьютере покупателя. Незаконное копирование исключено.
Вы упускаете торговые возможности:
- Бесплатные приложения для трейдинга
- 8 000+ сигналов для копирования
- Экономические новости для анализа финансовых рынков
Регистрация
Вход
Если у вас нет учетной записи, зарегистрируйтесь
Для авторизации и пользования сайтом MQL5.com необходимо разрешить использование файлов Сookie.
Пожалуйста, включите в вашем браузере данную настройку, иначе вы не сможете авторизоваться.