YouTube'dan Mağaza ile ilgili eğitici videoları izleyin
Bir ticaret robotu veya gösterge nasıl satın alınır?
Uzman Danışmanınızı
sanal sunucuda çalıştırın
sanal sunucuda çalıştırın
Satın almadan önce göstergeyi/ticaret robotunu test edin
Mağazada kazanç sağlamak ister misiniz?
Satış için bir ürün nasıl sunulur?
MetaTrader 5 için teknik göstergeler - 63

"Pattern 123" is an indicator-a trading system built on a popular pattern, pattern 123.
This is the moment when we expect a reversal on the older trend and enter the continuation of the small trend, its 3rd impulse.
The indicator displays signals and markings on an open chart. You can enable/disable graphical constructions in the settings.
The indicator has a built-in notification system (email, mobile terminal, standard terminal alert).
"Pattern 123" has a table that displays signals fr
Zig Zag Multi Time Frame Indicator counts in how many consecutive candlesticks the current Zig Zag "lit" on the different Time Frames. It can be used for both trend signal strategies and range breakout strategies. Shows simultaneously on all Frames in how many candles we have had Zig Zag value in the current swing. The Zig Zag period can be adjusted in the Indicator settings.
This indicator compares volumes from the same period to previous days instead of calculating the average of previous candles, so it is possible to detect volume anomalies more accurately.
I have always been bothered by seeing very large volumes at the beginning of a trading day and almost no volume throughout the day, making volume-based strategies very limited. This indicator can verify the strength of the volume of candles based on previous days, so it is possible to perceive volumes that ar

Scanner and Dashboard for Money Flow Index MT5 The Money Flow Index (MFI) is a technical oscillator that uses price and volume data for identifying overbought or oversold signals in an asset. It can also be used to spot divergences which warn of a trend change in price. The oscillator moves between 0 and 100.
Advantages of the Scanner: - Full Alert Options. - Multi Timefrare - Works for all instruments including Currencies, Indices, Commodities, Cryptocurrencies and Stocks. - Fully customisab

This Indicator analyses the Trend and shows signals. When you open the Chart , Indicator shows you Buy or Sell Signal as Alert. Usage: Activate Algo Trading , Activate the Indicator and drag new currencies into chart. Indicator shows you Buy or Sell Signal as Alert.
Results
- Buy Signal
- Sell Signal
- No Signal For any question please don't hesitate to contact.

MMD'den Elmas
Diamond by MMD, fiyat davranışı için önemli olan yerleri tanımlayan gelişmiş bir göstergedir. Bu gösterge - herhangi bir zaman diliminde - grafikte fiyat reaksiyon bölgelerini algılar ve işaretler. MMD metodolojisindeki bilgi piramidinin unsurlarından biri olan elmaslar, çok katı koşulları karşılayan mumlardır. İki ana elmas türü vardır: - standart elmas - ters bunama. Bu modellerin her ikisi de otomatik olarak tanımlanır ve tablo üzerinde işaretlenir. Gösterge elmasları, örneği

Time Line by MMD is a simple indicator that supports historical data analysis and trading on statistical models that follow the MMD methodology.
Start Time - specifying the time when we start analyzing and playing the MMD statistical model Time Duration in minutes - duration of the model and its highest effectiveness (after the end of the line, the price returns - statistically - to the set level) Lookback days - the number of days back, subjected to historical analysis Base Time Frame - the

MACD Scanner provides the multi symbols and multi-timeframes of MACD signals. It is useful for trader to find the trading idea quickly and easily. User-friendly, visually clean, colorful, and readable. Dynamic dashboard display that can be adjusted thru the external input settings. Total Timeframes and Total symbols as well as the desired total rows/panel, so it can maximize the efficiency of using the chart space. The Highlight Stars on the certain matrix boxes line based on the selected Scan M

This indicator draws the high intraday price and the low intraday price of the first n minutes of the day. The chart shows the days with vertical lines and two horizontal lines to indicate the max and the min close price of the n first minutes of the day. The max/min lines start and end with the day calculated. With this indicator you can see how starts the day compared with the previous days. It is valid for any market inasmuch as the start time is calculated with the data received.
Paramete
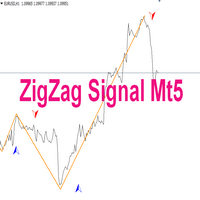
Indicator description: Indicator - ZigZag Signal is created on the basis of a well-known and popular indicator - ZigZag. The indicator can be used for manual or automatic trading by Expert Advisors. 1. The ZigZag Signal indicator has alerts of different notifications for manual trading. 2. If used in Expert Advisors, the indicator has signal buffers for buying and selling. You can also prescribe and call the indicator as an external resource and other settings and applications: (email me in a

Xtrade Trend Detector is an indicator capable of finding the best opportunities to take a position in any stock market. Indeed, it is a great tool for scalpers but also for Daytraders. You could therefore use it to identify areas to trade, it fits easily on a chart. I use it to detect trends on Big timeframes and take positions on Small timeframes. Don't hesitate to give me a feedback if you test it.

The Squeezer indicator simply draws ascending lines with Sell signal in the downtrend and descending lines with Buy signal in the uptrend to catch the pullbacks and sniper entries. This is a common successful trading strategy being used by many successful traders, and the good thing about this strategy is that it works with all time frames. The difference is in the take profit level between them. Buy / Sell signals are triggered at the close of the current candles above / below the ascending or

Promotion $66 lifetime for you.
The principle of this indicator is very simple: detecting the trend with Moving Average, then monitoring the return point of graph by using the crossing of Stochastic Oscillator and finally predicting BUY and SELL signal with arrows, alerts and notifications. The parameters are fixed and automatically calculated on each time frame. Example: If you install indicator on EURUSD, timeframe M5: the indicator will detect the main trend with the Moving Average on this
This indicator draws a price area in which the volume percentage was traded the day before. The chart shows the days with vertical lines and two horizontal lines to indicate the upper price and the lower price of the percentage of volume was traded the day before. The upper/lower lines start and end with the day calculated. But they are referred with the values of the day before. NOT the day in which are. With this indicator you can see where the volume moved in the day before. It uses percenti

Teniendo una entrada de precios suavizados, los cuales son procesador por un ZigZag en tiempo real, dando como resultado un suavizador ajustado a un ZigZag. Con valores de entrada (periodo) mayores se vuelve un poco lenta en M1,, Ideal para H1, H4, D1 Trabaja bien con otros suavizadores, ya que su intersección es ideal Al iniciar empiza con mayor precisión desde el momento de activación, siendo el historial (anterior) de referencia ----------------------------------------------------------------

Trend ML entry points should be used as potential market reversal points. The indicator works using the cyclic-wave dependence function. Thus, all entry points will be optimal points where the movement changes.
The simplest way to use the indicator is to open a trade in the direction of an existing trend. The best result is obtained by combining the indicator with fundamental news, it can act as a news filter, that is, it can show how the market reacts to this or that news.
A simple and con

Trend Hunter is based on the process of detecting the rate of change in price growth and allows you to find points of entry and exit from the market.
The indicator was created on the basis of the original indicators of the search for extremes, the indicator is well suited for detecting a reversal or a large sharp jerk to one side, thanks to it you will know when this will happen, it will notify you by the appearance of a blue point for buying red for selling
A fundamental technical indic

Merhaba; Tw79 time zone pivot strateji indikatörü önemli kırılımları bulur ve kırılımlar sonrası aynı yönde kar marjını koruyarak toplam kar hedefinin devamlılığını sağlar. İndikatör girdi açıklamaları; Start Hours:Başlangıç ve referans noktasını ifade eder.Sıfır yada bir rakamını kullanın. Offset:Referans sonrası hesaplanacak bar sayısını ifade eder.Ortalama değerler 55-144 arasındadır. Number of bar:Sinyal için hesaplanacak son mumu ifade eder.Bir olarak kalmalıdır. Sound On:Sinyal açık-kapalı
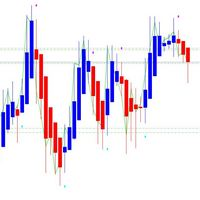
Heiken Ashi Signal göstergesi MT5 ticaret terminali için tasarlanmıştır. Mt5 terminalinde bulunan standart Heiken Ashi göstergesine dayanmaktadır. Gösterge, yazarın Uzman Danışmanları tarafından otomatik ticaretin yanı sıra manuel olarak da kullanılabilir. Ticaret EA'larında Heiken Ashi Sinyal göstergesini kullanmak için, piyasaya giriş ve alım satım pozisyonları açmak için sinyal tamponları vardır. Daha fazlasını aşağıda okuyabilirsiniz.
Heiken Ashi Sinyal göstergesinin özellikleri ve özelli
RSI Traffic Light Indicator tracks several RSI ( Relativ Streng Index) Periods and informs you, if the trend is changing. Trend is you friend, one of the classical Trend following is the Relativ Streng Index (RSI). With RSI Traffic Light Indicator you will get information about trendchange. The RSI Traffic Light Indicator alerts you if the trend is changing for your pair. Different trendchange criterials and visualisation themes inclusive. Your can adjust the indicator Trendchange criterials by
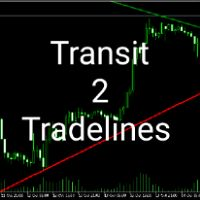
Transit2Trendline this indicator system is made to reduce the job of analyzing and to help those who can't or don't know how to draw trendlines.Transit 2 Trendlines draws only two important trendlines, support and resistance. The diagonal support is drawn in red color .The diagonal resistance is drawn in green color. Note this are very important trendlines which can easily be traded with the classic strategy of trendlines, breakout and retest. The Transit 2 Trendlines will draw patterns selected

Another renko-based indicator. It returns different usable values for an EA, and is directly displayed on the main chart. Its setting is very simple: The size of the renko The number of bars taken into account The falling color The color on the rise Returned values: Buffer 0 : Value of the middle Buffer 1 : Value of the Top Buffer 2 : Value of the Bottom Buffer 3 : Direction of renko (0.0 for top ; 1.0 for bottom) Buffer 4 : Ratio of the renko, for example, if it is twice, 3 times, ro more of
It is a very simple indicator to display daily loss percentage, open position loss percentage, monthly loss percentage and monthly profit percentage. MT4 version
We assure you that we welcome any suggestions to improve this indicator and make the necessary changes to improve this indicator.
You can contact us via Instagram, Telegram, WhatsApp, email or here. We are ready to answer you.

Developed by Smart Trader - Smart Reversion Pattern is an indicator capable of identifying reversal patterns , both bullish reversals and bearish reversals.
It is designed to provide fast, real-time awareness of patterns.
We also thought about the interface part, creating a clean and pleasant look to identify formation patterns on the chart.
Note: If any pattern you need is not listed, just contact us and request inclusion - we usually respond within a few hours.
Bearish Reversal P

S&R indicator automatically finds the closest support and resistance levels (or zones) for the loaded traffic.
• The indicator works on all timeframes (it is advisable to choose at least M15) • The indicator works on all markets • Doesn’t redraw • Flexible settings The work of the indicator is based on the fractal indicator built into the MT4 platform. The fractal is a local extremum described by Bill Williams. The support and resistance indicator automatically finds the levels or zones,

The Candle Timer indicator is an Custom Indicator that displays the remaining time before the current candle would close. The Candle Timer indicator works by retrieving the time from the broker’s server. It also retrieves the time when the next candle would begin. Then, it calculates the difference between the projected open time of the next candle and the current time on the broker’s server. The difference between the open time of the next candle and the current server time is then displayed o
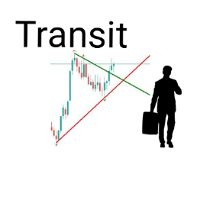
TransitX1 indicator is very useful, with unlimited signals and works on all the timeframes and all the piers. TransitX1 draws two trend lines very short trendlines (+/-20 bars) which can be considered as support and resistance. The support is in red trendline and the resistance is in green trendline. TransitX1 gives buying and selling signals, with only 3 being previous signals and the 4th one being the current signal. Buying signals are in green arrows and are always on the support trendline an
Tracker Candle Signal est un indicateur simple et pratique, capable de déterminer le mouvement des acheteurs et vendeurs, A savoir, qui aura le dessus à la fin de la chaque bougie en fonction de l'unité de temps choisi. Il est très précis sur les grandes unités de temps 1H, 4H, Daily. En effet, je l'utilises en daily pour comprendre le comportement du marché puis en 1H pour prendre position. Surtout n'hesitez pas à me faire un retour après utilisation.
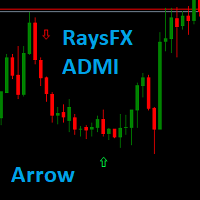
RaysFX (Average Directional Movement Index) to → ARROW
Technical indicator (ADX) helps to determine the market trend. It was developed and described in detail by Welles Wilder.
The simplest trading method based on the system of directional movement implies comparison of two direction indicators: the 14-period +DI one and the 14-period -DI.
To do this, one either puts the charts of indicators one on top of the other, or +DI is subtracted from -DI.
W. Wilder recommends buying whenever the +DI
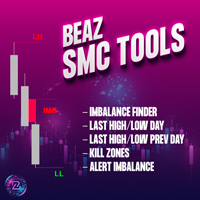
This indicator is an analysis tool for the smart money concept. It displays inducement imbalance, the line of the day, the last highs and lows of the day as well as those of the previous day. The options are customizable as desired, color, size, line type and visibility. It is possible to deactivate each option according to your way of working in order to keep your graph clean.

This MT5 indicator has been designed to be used on any currency pair and any time frame . It has the scalper and swing trader in mind. The indicator looks for short-term high-probability reversals in price and will indicate to you to go long (buy) or short (sell) if you see a green or red arrow next to the current candlestick respectively. The indicator provides the best trading opportunities to you during the active trading hours of London and New York, but it will continue to give signals al

This MT5 indicator has been designed to be used on any currency pair or indices and on the daily time frame or higher . The indicator looks for medium-term high-probability continuations in price and will indicate you to go long (buy) or short (sell) if you see a green or red arrow next to the current candlestick respectively. The indicator paints an arrow when the specific criteria are met, however, you must wait until the current candlestick has closed until you enter a trade . Therefore you w

This MT5 indicator has been designed to be used on any currency pair, but not indices, on the ONE HOUR time frame only . This indicator has the highest win rate of all my indicators but it is not perfect and there is no holy grail in trading. The indicator looks for short-term high-probability trend continuations in price and will indicate you to go long (buy) or short (sell) if you see a green or red arrow next to the current candlestick respectively. The indicator paints an arrow when the spe
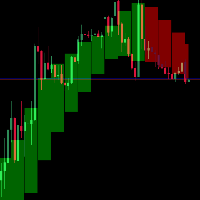
Anyone who is experienced in trading knows that longer time signals are trend signals. That's why it's always good to follow the trends of longer times to make a good trade.
With that in mind, I created the trend indicator in the background
Indicator Parameters TFBar - TimeFrame BackgroundEnabled - Enable Background NumbersOfBars - Numbers of Bar draw ColorUp - Color Up ColorDown - Color Down Smoothing - Heiken-Ashi Smoothing Average inpMA_METHOD - Smoothing Method width - Size Line bor

Ichimoku Genius (imG)
is a very Intelligent Indicator for the Perfect Entry & Exit. This is strongly recommended to: Check the Video properly to understand the Indicator setup, how does it work and exactly how to take Entries and Exit according to this Indicator. Please use this Indicator with "Pivot Points" & "Kijun-Sen" to get the Best result. Always give preference to Long Flat area of "KIJUN SEN" Line as this is act like a strong Support -or- Resistance.
Steps to Setup the Indicator: I

This Indicator help you to identify trends and patterns. It shows the short-term, medium-term and long-term trend at the same time on the screen. It supports every timeframe except monthly. This indicator NOT implement the ZigZag indicator, but it uses its own algorithm.
Supported markets: - Forex - Metal - Energies Spot - in Energies Futures only o US Crude Oils - in Indices Spot only o US Tech 100 Index o UK 100 Index o US Wall Street 30 I
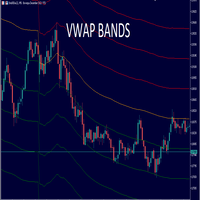
Este indicador contém 6 desvios, ótimo para ativos de alta volatilidade, podendo alterar as cores dos desvios como a largura da linha.
VWAP (Volume Weighted Average Price) nada mais é do que uma média móvel ponderada pelo volume das negociações de um ativo. Esse indicador é um dos mais utilizados pelos grandes investidores – na sua maioria institucionais –, pois permite ampla visualização da liquidez e dos pontos de interesse do ativo em análise. O volume é um dos elementos m
Interval Breakout (IB)
is a Breakout Indicator Mixing with Time Interval.
We can set a Particular Time and Support / Resistance Line Length for a Breakout Scanning. This is strongly recommended to: Check the Video properly to understand the Indicator setup, how does it work and exactly how to take Entries and Exit according to this Indicator. Give preference to Support / Resistance zone to get rid of False signal.
Steps to Setup the Indicator: Install the Custom Indicator; Set all the
The Black Swan Trading Panel was designed and built to make trading as easy as possible. Track any trading instruments with multiple time frames on one chart and thus have a complete overview of the market situation. The Black Swan Trading Panel uses three custom indicators that will give you a clear overview of the market situation regarding trend, price deviations and support/resistance zones. This indicator is highly customizable and therefore suitable for every type of trading. With this too

The Mathematical Trader is a new addition to my highly profitable indicator products. It can be used for scalping or catch the beginning of mid-term strong trends . This is an MT5 indicator only that utilises several mathematical formulations and has been designed to run on any instrument and any time frame less than the daily time frame . The lower the timeframe the more frequent the signals. The indicator will signal to you to go long (buy) or short (sell) if you see a green or red arrow next

To download MT4 version please click here . This is the exact conversion from TradingView: "WaveTrend [LazyBear]" By "zeusuk3". One of the coolest indicators out there to detect overbought and oversold zones. It can be used as a part of more complicated strategy and for confirming a potential trade setup. There are buffers to use in EAs also. The indicator is loaded light and non-repaint. - You can message in private chat for further changes you need. Thanks for downloading

Gösterge, tarihsel olanlarla karşılaştırılabilecek güncel teklifler oluşturur ve bu temelde bir fiyat hareketi tahmini yapar. Gösterge, istenen tarihe hızlı navigasyon için bir metin alanına sahiptir.
Seçenekler:
Sembol - göstergenin göstereceği sembolün seçimi;
SymbolPeriod - göstergenin veri alacağı dönemin seçimi;
GöstergeRenk - gösterge rengi;
Ters - doğru tırnakları tersine çevirir, yanlış - orijinal görünüm;
Sonraki, tarihi girebileceğiniz ve 'enter' tuşuna basa

Neural Bands is a scalping indicator. There are 2 different deviation bands for oversold and overbought levels. Color candles are to determine the trend if it passes the deviations and is showing a strong trend or if the color candles stop at the deviations and revert back to the mean. This indicator is a type of regression indicator trading ranges and breakouts in price. 15 min charts and above recommended. TRADE WITH THE LARGER TREND DIRECTION

Hello ! If you scroll in one chart, all charts will be scrolled If you change the time frame in one chart, it will change in all charts Of course, you can turn this feature on or off All the charts in which you want changes to be applied are specified through ID in the indicator settings You can scroll the charts of different time frames in two ways at the same time 1: Coordinated based on time That is, 1 hour candle is 60 candles one minute back 2: scroll in the form of number of candles That i
This indicator will mirror the assets in use in another Metatrader, being able to choose the timeframe and a template. This is the Metatrader 5 Server, it can work with Metatrader 4 or 5 Client versions: Metatrader 4 Mirror Chart Client: https://www.mql5.com/en/market/product/88649
Metatrader 5 Mirror Chart Client: https://www.mql5.com/en/market/product/88650 Details of how it works in the video.

Hush mt5 is an advanced indicator that gives a signal about the overbought or oversold market in a certain period of time
Hush mt5 the advantage of this indicator is that it does not disappear after the signal on the chart
Suitable for any trade: forex, stocks, cryptocurrency, metals
Hush mt5 can be used on any time period. The signal goes to the beginning of the next candle after the arrow
Hush mt5 performed best on the period H1,H4,daily
It can be used in addition to forex, in binar
This is 3 pre-filtered CCI, Commodity Channel Index, indicators pre-filtered by your choice of 3 Smoothing and/or Averaging methods. I have found certain settings to be very reliable and I plan to incorporate this into an Expert Advisor in the future. I have added a new form of Averaging: Smoothed TEMA, or Triple Smoothed EMA, Exponential Moving Average. It gives less noise than the TEMA, but provides the smoothing of the Double Smoothed EMA, so it should be a slight bit quicker. PLEASE Download
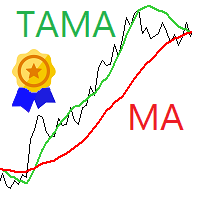
Short description : TAMA is, at its core, a novel method for correcting moving averages (MAs) during trends. | This usually also results in better smoothing and a significantly lower time delay (lag) of the MAs. | The indicator can additionally be used for price forecasts and band formation, also combined. | TAMA received an award from VTAD in 2022. |
Honored with the VTAD Award 2022 (VTAD = Association of Technical Analysts Germany, German branch of IFTA).
Core Features :
Classic MAs
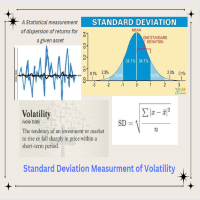
Standard Deviation Pivot Point will enhance your trading and highlight great trade opportunities with the Support and Resistance levels that professionals use based on volatility of market. Standard Deviation Pivot trading is a simple effective method for entry and finding targets that are statistically on your side, highlighting market key levels has been used by professionals for decades and is effective on all symbols: Forex, Crypto, Stocks, Indices. Standard deviation is a measurement if vol
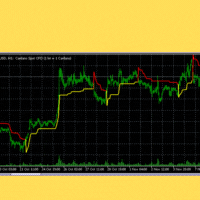
Supertrend, Olivier Sebam tarafından yatırımcıların eğilimleri belirlemelerine ve bir finansal varlığı ne zaman alıp ne zaman satacaklarını bilmelerine yardımcı olmak için - yukarıda belirtildiği gibi - geliştirilen nispeten popüler olmayan bir teknik göstergedir. Gösterge, TradingView ve MetaTrader'da varsayılan olarak bulunmaz. Yine de piyasada özel yapım Supertrend göstergelerini bulabilirsiniz.
Bir grafiğe uygulandığında, süper trend göstergesi iki rengiyle görünür. Değiştirilebilir olsal

TransitBlueOcean is indicator system that uses ocean wave's pattern, to help one to know when to buy and when to sell. The indicator system is very powerful like the ocean waves. Join the mql5 channel for TransitBlueOcean https://www.mql5.com/en/channels/transitblueocean How to use: Zoom in so that the Ocean will appear on your chart.
Buy when you see the candles, the candle will be above the ocean wave (buying signal).
Sell when you can't see the candles, the candles will be inside the w
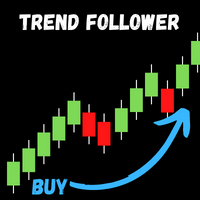
Trend Follower predicts the possible start of a trend, the indicator uses as a basis for the closing high possibility of the indicators to identify a possible entry or low possibility, the indicator just an entry parameter which can be the period .
Input parameters Period : A positive integer that indicates the period for number Alert: Sends an audible signal when a signal occurs
Check out other products: https://www.mql5.com/en/users/junioredj16/seller

Critical Trading, Currency Strength This indicator allows for viewing true value changes in the 8 major currencies, this ability has many applications for simple and advanced forex trading. No need to switch to inaccurate 3rd party applications or websites. Trend catching: No need to watch 28 charts, pair up the strongest and weakest performing pairs. Optimize entries: Show the currencies of your current chart and enter on reliable pullbacks for further confluence on your trades. Currency perfo
Şu anda tatil indiriminde $399! Fiyatlar gelecekte artabilir. Aşağıdaki açıklamayı okuyun!
Ultimate Sniper Dashboard için EN İYİ Giriş Göstergesi olan Ultimate Dynamic Levels ile tanışın! Son derece Düşük Riskli zamanında girişler ve yüksek RR!!!
Ultimate Sniper Dashboard'u BURADA bulabilirsiniz. Hem yeni başlayanlar hem de profesyonel tüccarlar için en önemli yetenek, bir piyasanın tam olarak nereye ve ne zaman dönme olasılığının en yüksek olduğunu ve güvenli bir şekilde nasıl girileceğin
300 downloads without review ? !!!!
If continued. I will not share any product for free. :( Small and very simple timer next to the current price to show the end time of the current candle
Very useful and important for scalpers and those who work on price action.
We assure you that we welcome any suggestions to improve this indicator and make the necessary changes to improve this indicator.
You can contact us via Instagram, Telegram, WhatsApp, email or here. We are ready to answer you.

TransitHazard is a trading indicator system's that use one of the best trading strategy. The indicator system have input options so that you can adjust or set the strategy to work the way you would like by allowing you to set the period and other adjusting set inputs and the indicator system has color settings to set your own preferred colors. Works on all the time frames and on all the pairs. Green colored candles give a buying signal and an alert after one bar will be given so that you don't m

Robotizz Indicator is a powerful trading indicator using price action and moving averages. Robotizz indicares with arrows on long trades ir short trades, showing some TP and SL points too. It works with any symbol, even on forex markets or B3 Brazilian markets. You can configure moving averages periods, besides simple or exponential moving averages. Also it is possible to configure arrow position. Try Robotizz for one month and take a boost on your manual trades.
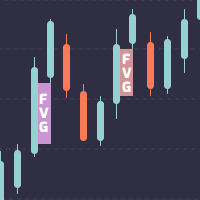
MetaTrader 4 için Adil Değer Farkı Göstergesi.
Adil Değer Boşluğu, ünlü akıllı para tüccarı iç çember tüccarı, diğer adıyla ICT tarafından öğretilen üç mumlu bir fiyat eylem modelidir. Temel olarak, fiyat çok hızlı hareket ettiğinde grafikte açık bırakılan bir boşluktur. Ortadaki mumun gövdesinin, sol mum ve yanındaki sağ mum tarafından üst üste bindirilmeyen bir alanıdır. Fiyat grafikte bir boşluk bıraktığında iki şeyi aklımızda tutabiliriz. Birincisi, fiyatın o yöne gitmek için gerçekten gü

Alış ve Satış Hedefleri Göstergesi Üç satırdan oluşur: ilk yeşil renk satın alma hedeflerini, ikinci kırmızı renk satış hedeflerini ve üçüncü mavi renk ortalama fiyatı belirtir. Girmenin iki yolu vardır - Yöntem 1: Ortalama fiyatın alttan uzun bir mumla kırıldığı ve yeşil bir mumla mavi çizginin üzerinde kaldığında giriş noktası satın alma olarak kabul edilir. Ortalama fiyat kırmızı bir mumla tepeyi aştığında, satış olarak kabul edilir. İkinci yöntem: Hedeflere ul

* Düzeltilmiş ve hızlandırılmış zigzag. (Aralığı değiştirebilirsiniz) * Her yeni mum/bar da zigzag güncellenir. * İsterseniz buton aktif ederek, sadece butona tıkladığınızda patern arar. Otomatik yaparsanız grafik her yenilendiğinde arama yapar. * Sıklıklıkla kullanılan 17 adet harmonik patern ve kendi oranlarınızı belirleyebileceğiniz özel pattern. * Fiyat gösterimi ile grafiği sade tutabilirsiniz. İsterseniz üçgen gösterimi yapabilirsiniz. * "History Mode" ile geçmiş performansları inceleyebi
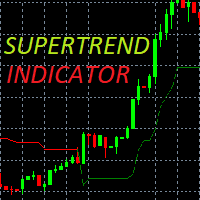
A super-trend indicator is plotted on either above or below the closing price to signal a buy or sell. The indicator changes colour, based on whether or not you should be buying. If the super-trend indicator moves below the closing price, the indicator turns green, and it signals an entry point or points to buy. If a super-trend closes above, then the indicator shows a sell signal in red. You will also note that at the point where buy or sell signal is generated is the crossover point. At the p
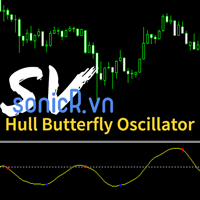
The Hull Butterfly Oscillator (HBO) is an oscillator constructed from the difference between a regular Hull Moving Average ( HMA ) and another with coefficients flipped horizontally . Levels are obtained from cumulative means of the absolute value of the oscillator. These are used to return dots indicating potential reversal points . This indicator draw line in separate window, plus blue dot (for buy signal) when hull oscillator is peak and red when sell signal. It also includes integrate
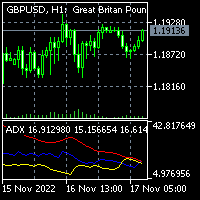
This is a two in one indicator implementation of Average Directional Index based on heiken ashi and normal candles. Normal candles and Heiken Ashi is selectable via input tab. The other inputs are ADX smoothing and DI length. This indicator lets you read the buffers: +di: buffer 6 -di: buffer 7 -adx: buffer 10 Note: This is a non-repaint indicator with light load processing. - You can message in private chat for further changes you need.
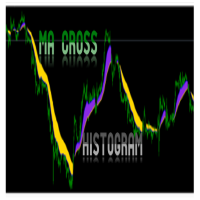
MA Histogram is MT5 Indicator for beginners which plot a histogram after Moving Average Crossover of 2 MAs. The Indicator does not have arrow or alert. It will simply plot on chart the potential Up and Down trend when trend is beginning or ending. It will show a Blue color for potential up trend and Gold color for potential down trend. Recommended Pairs: ALL Pairs including Indices for MT5 FOREX BROKERS Recommended Pairs On Deriv: BOOM 1000, Boom 500, Boom 300 and CRASH 1000, Crash 500, Cra
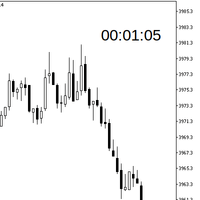
A simple indicator to help showing the remaining time until the candle closes for all pre-defined chart periods with the following formats depending on which timeframe the chart is on. DD:HH:MM:SS - in case of W1, and MN period HH:MM:SS - in case of other periods Included with some of configurations as follows (please see attached inputs screenshot) X/Y distance to the upper right corner of the chart window Text size Text color Show/hide
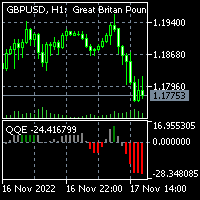
To download MT4 version please click here . - This is the exact conversion from TradingView: "QQE mod" By "Mihkel00". - It can be used to detect trend direction and trend strength. - Gray bars represent weak trends. You can set thresholds to achieve better accuracy in detecting trend strength. - There is buffer index 15 to use in EA for optimization purposes. - The indicator is loaded light and non-repaint. - You can message in private chat for further changes you need.
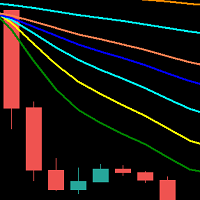
Multicolor moving average (8x). Define period, color, line width. Set period =0 to off moving average.
The moving average (MA) indicator is one of the most used technical indicators for forex traders. It's a formula used to calculate the averages of a market's movements over a longer time period (usually weeks or months rather than days) to identify trends , which is vital for a good forex trading strategy.

- This is an implementation of OCC ==> open close cross - This indicator applies twelve different averaging methods to open and close prices separately to signal the trend switching. - All MA methods are set as input as well as period and different offsets applied to linear regression and ALMA averaging. - Buffers 16 and 17 can be used in EAs to detect trend direction. - You can message in private chat for further changes you need.
The Legendary Super Trend Indicator Now at Savings Price!!!!!
My Supertrend indicator gives them clear entry and exit signals.
The indicator is volatility-based and is in its function rather a trend-following indicator.
Through the ATR indicator, which is integrated in the calculation of the Supertrend, price gaps are also calculated and not overlooked. Thus, more accurate values can be calculated.
When measuring volatility, the average value of the current price serves as a basis.

A Metatrade 5 technical Indicator made of the best trading strategy, very easy to use and to understand. Providing good and reliable signals for scalping and swing trading. Always killing the shower on any pair , whether currency’s, stock’s, index, community , Deriv synthetics and many more. TransitKiller is a very useful technical indicator system, that analyze the market using a unique technical strategy so that it can give accurate signal’s for buying or selling , and the bull’s and bear po
MetaTrader Mağaza, ticaret robotları ve teknik göstergelerin benzersiz bir deposudur.
Yatırımcılara sunduğumuz benzersiz hizmetler hakkında daha fazla bilgi edinmek için MQL5.community - Kullanıcı notunu okuyun: ticaret sinyallerini kopyalama, freelancerlar tarafından geliştirilen özel uygulamalar, ödeme sistemi aracılığıyla otomatik ödemeler ve MQL5 Bulut Ağı.
Ticaret fırsatlarını kaçırıyorsunuz:
- Ücretsiz ticaret uygulamaları
- İşlem kopyalama için 8.000'den fazla sinyal
- Finansal piyasaları keşfetmek için ekonomik haberler
Kayıt
Giriş yap
Gizlilik ve Veri Koruma Politikasını ve MQL5.com Kullanım Şartlarını kabul edersiniz
Hesabınız yoksa, lütfen kaydolun
MQL5.com web sitesine giriş yapmak için çerezlerin kullanımına izin vermelisiniz.
Lütfen tarayıcınızda gerekli ayarı etkinleştirin, aksi takdirde giriş yapamazsınız.