Смотри обучающее видео по маркету на YouTube
Как купить торгового робота или индикатор
Запусти робота на
виртуальном хостинге
виртуальном хостинге
Протестируй индикатор/робота перед покупкой
Хочешь зарабатывать в Маркете?
Как подать продукт, чтобы его покупали
Технические индикаторы для MetaTrader 5 - 30

This indicator can be used to study the repeating daily volatility structure, and also find deviations from the historical means. Black line tells the average volatility of current hour from last 30 days. Blue bands tell the confidence interval (2 times standard deviation). Red line tells the current volatility, ATR.
Inputs: - days: the number of days where to calculate the average volatility - atrp: the ATR period used to measure volatility
FREE

Description of ADTGroup_Oscillator.mq5 Indicator
The ADTGroup_Oscillator.mq5 indicator is a custom technical analysis tool created by avydel. It is designed to provide insights into market trends and potential trading opportunities. Here is an overview of its key features and functionality:
- **Indicator Type:** This oscillator is designed to be displayed in a separate window on the trading platform. - **Indicator Plots:** It utilizes one buffer for plotting data. - **Plot Style:** The indi
FREE

White Crow Indicator
by VArmadA A simple yet powerful candle analysis based indicator using the White Soldiers & Crow patterns.
Works with timeframes 1H and higher and tested on all major pairs. Pay attention to the signal: An arrow indicating a long or short entry.
How It Works:
Arrows indicate a ongoing trend. After multiple bullish or bearish candles in a row the chances for another candle towards that trend is higher.
Instructions: - Crow Count: Set the number of candles that n
FREE

Индикатор отображает количество и соотношение тиков роста и падения цены для каждой свечи графика. Верхняя часть гистограммы в виде тонких линий показывает количество тиков роста цены (сила быков), а нижняя - количество тиков падения цены (сила медведей). Более жирные столбцы гистограммы - это разность между силами быков и медведей. Положительная разность отображается зеленым цветом, а отрицательная - красным. Прирост силы быков происходит в тот момент, когда цена Ask текущего тика стала больше,
FREE
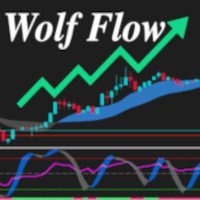
The Wolf Flow Indicator for MetaTrader 5 is the perfect solution for traders looking for instant clarity and precision in their market analysis. Simple to use and immediate to view, this tool offers you a complete overview of market dynamics in a single glance.
Strengths:
Absolute Simplicity: A clean and intuitive interface guarantees effortless use, even for less experienced traders. I mmediate and Rapid: Key data is presented in real time, allowing you to make instant decisions with

Индикатор, показывающий момент преодоления нулевой отметки индикатора MACD. Индикатор стрелочный и может быть использован для торговли бинарными опционами.
Входные параметры Period of SMA1 - Период 1 скользящей средней Period of SMA2 - Период 2 скользящей средней Period of SMA3 - Период 3 скользящей средней Inform about finding the signal - подавать уведомление, при нахождении сигнала
FREE

Candle Counter This product counts the candles and shows the result according to the configuration defined by the user. Professional traders use it to emphasize a specific candlestick.
Settings Position - Choose whether the numbers will be displayed above or below the candle Distance - The distance that the number will have from the candle, referring to the minimum or maximum Font Size - Font Size Color - Font Color
FREE
BW Dance - MTF Индикатор сигналов системы Билла Вильямса "Торговый Хаос"для МetaТrader 5 !!! Этот индикатор не является торговой системой !!!
Это только удобный инструмент для получения сигналов торговой системы Билла Вильямса в визуальном и звуковом режиме
- Сигналы - не перерисовываются
Основная идея индикатора: отображать текущие сигналы системы БВ на правом крае графика, по принципу ЗДЕСЬ и СЕЙЧАС выводить сигналы тремя способами:
рядом с ценовой шкалой под/над ценой внизу графи

This product contains following indicators: (Lines + LineSAR + Channels + BTL + Ladder) Phi Lines - special EMAs, similar to MIMAs from Phicube; Phi LineSAR - erase and highlight Phi Lines in support or resistance. Similart to MIMASAR from Phicube; Phi Channels - show support and resistance, similar to Phibo from Phicube (Green and Read Lines); Phi BTL - candles color following Phi Lines alignment; Phi LADDER - Indicator that allow you to visualize possible targets.
FUTURO Tool Future to

Fibonacci and RSI.
Demo versión only works with GBPUSD. For full version, please, visit visit https://www.mql5.com/en/market/product/52101
The indicator is a combination of the Fibonacci and RSI indicators.
Every time the price touches one of the fibonacci levels and the rsi condition is met, an audible alert and a text alert are generated.
Parameters number_of_candles : It is the number of candles that will be calculated. If you put 100, the indicator will give you the maximum and min
FREE

Индикатор DuettoFXTompson создан для работы с двумя инструментами у которых высокий уровень корреляции, индикатор можно использовать для парного трейдинга по валютам, акциям, и др. финансовым инструментам. Индикатор показывает момент расхождения инструментов и сумму двух инструментов ( желтая линия), дополнительно рассчитывается параметр Среднего значения МА. Рекомендуемый таймфрейм для работы М5. Контакты для связи 777basil@mail.ru , приготовим эксперта, индикатор по вашему заданию.
FREE

The Bolliger Bands On-Off let you control the indicator using the keyboard or a button . You can choose if you want the indicator always shown or always hided while switching among different time frames or financial instruments . ---> This indicator is part of Combo Indicator OnOff
The Bollinger Bands identify the degree of real-time volatility for a financial instruments . A lower amplitude corresponds to a low volatility, conversely a greater bandwidth corresponds to high volatility
FREE

FFx Universal Strength Meter PRO - это больше, чем простой измеритель силы. Вместо того, чтобы ограничивать расчет ценой, его значения могут быть основаны на любом из 19 встроенных режимов измерения силы + 9 таймфреймов. С FFx USM вы сможете задавать любой период для любой комбинации таймфреймов. Например, вы можете установить панель на последние 10 свечей на M15-H1-H4… Полная гибкость! Простая интерпретация... Это дает отличное представление о том, какие валюты слабые и сильные, поэтому вы смож
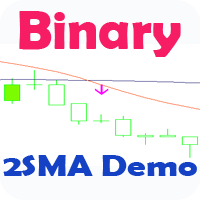
Стрелочный индикатор, выдающий сигнал при пересечении 2 SMA. Сигналы выдаются в виде стрелок и подходят для торговли бинарными опционами.
Это демо версия индикатора, в не нельзя изменять параметры. Полная версия .
Входные параметры First period- период 1 MA Second period - период 2 MA Invert signals - Возможность давать инвертированные сигналы (для работы по тренду) Candles to count - количество свечей для подсчета статистики Expiration - время экспирации сигнала Length - расстояние
FREE

Triple Exponential Moving Average (TRIX) It is a strong technical analysis tool. It can help investors determine price momentum and identify oversold and overbought signals in a financial asset.
Advantages of having an indicator like TRIX.
One of the main advantages of TRIX over other trend-following indicators is its excellent filtering of market noise and its tendency to be an early rather than late indicator.
To aid in the operations, a coloring was configured to facilitate the identif
FREE

3 Moving averages crossover , with customizable Notifications and pop ups. Comment for any ideas. Its a demo version , could use some work, hope you at least find it useful. Hit me up with anything or any ideas you feel might be helpful and i will try and add them in if i get the time. Thank you. This version is free as of now . I can't promise anything about the future. But enjoy and have fun. Truly PVRPLE BLVCK. PS don't forget to share and like.
FREE

FFx Watcher PRO - панель для отображения на одном графике текущего направления стандартных индикаторов (до 15 одновременно) на нескольких таймфреймах (до 21). Панель работает в двух режимах: Режим Watcher: Мульти-индикаторный Пользователь может выбрать до 15 индикаторов для отображения Пользователь может выбрать до 21 таймфрейма для отображения Режим Watcher: Мультивалютный Пользователь может выбрать любое количество символов Пользователь может выбрать до 21 таймфрейма для отображения В этом реж

An Adaptive Moving Average (AMA) is one more moving average overlay, just like EMA. It changes its sensitivity to price fluctuations . The Adaptive Moving Average becomes more sensitive during periods when price is moving in a certain direction and becomes less sensitive to price movement when price is volatile. For more information, welcome to our Telegram Group. https://t.me/InfinXx
FREE

Indicator that show candlestick bars with an different sampling method than time fixed. Real time data is sourced to the indicator and it may be used as substitute of the default graph. Each bar is formed when a predefined amount of ticks is received, showing in the graph the OHLC of this clusteri of ticks. The input variable is the amount of ticks of each bar. It's a different approach of sampling, the amount of bars is proportional to the amount of negotiations insted of a sample in a fixed am
FREE

Support Resistance View draws horizontal lines in the current chart that define in real time the values of Supports/Resistances for the timeframe tha you choose. Inputs: Lines color: color of the lines. Timeframe: timeframe for calculations. Support and Resistance are values at which the currency usually inverts the trend or have a breakthrought, so you can use this values to define a strategy for trading.

Expert Market Edge is scalping, trending, reversal indicator, with alerts . You can use it all and fit with your strategy whatever it fits you. My recommendation is to combine with my Colored RSI , and when 2 signals are matched, and pointing same direction (for example buy on this indicator, and green on RSI, you can take a long position, stop loss should be last local low, if you want to be more conservative, add ATR. ) you can take position. If you using moving averages, that's even better i

Стратегия форекс «Гора» основана на одном довольно сложном индикаторе. С его помощью генерируются вполне неплохие сигналы и, в принципе, автор указывал возможность торговли и на остальных инструментах, однако, мы решили взять изначальный вариант — торговлю только по GBP/USD. Так же следует сказать, что по ходу развития тренда торговая стратегия пропускает большое количество неплохих точек входа, но это только на первый взгляд. Фильтрация сигналов показала себя достаточно неплохо и в итоге торгов
FREE

Hello,
This is an easy symbol change panel.
The free version only can change major pairs which are "AUDUSD, EURUSD, GBPUSD, USDCHF, USDCAD, USDJPY, NZDUSD"
The full version can add your symbols.
FULL version here:
https://www.mql5.com/en/market/product/71173?source=Site+Market+MT5+Indicator+New+Rating005#description
Also, can change the TimeFrame as well.
Symbols must be active on your Market Watch list.
Parameters:
ratio - change the size LineNumber - you can set that how
FREE

Индикатор, показывающий моменты пересечения важных уровней индикатора RSI. Может быть использован для поиска моментов пересечения уровней для успешной торговли на отскок или по тренду.
Входные параметры Inform about finding the signal - параметр, отвечающий за получение уведомлений (Alert) о найденном сигнале. По умолчанию - нет RSI period - Период RSI для работы RSI Max - Значение максимальной границы RSI RSI Min - Значение минимальной границы RSI
FREE

*Used by MeditionSeed EA. Meditation is a practice in which an individual uses a technique – such as mindfulness, or focusing the mind on a particular object, thought, or activity – to train attention and awareness, and achieve a mentally clear and emotionally calm and stable state.[1][2][3][4][web 1][web 2] Plant a Meditation Seed to have wonderful future.
FREE

!! FLASH SALE !! Over 80% off !! For ONE week only. Now only $47 - normally $297! >>> Ends on 30 June 2023 - Don't miss it!
The Consolidation Breakout Alerts Indicator will revolutionize your trading strategy. Our innovative indicator offers unique buy and sell arrows when price breaks out from consolidation, allowing you to get in at the most optimal entry with minimal risk and maximum reward potential. Never again will you miss out on the lucrative trading opportunities available

Indicators are professional data statistics, position orders, historical order analysis->>>>>> <This version is in Chinese -> English version please move>
Necessary for traders: tools and indicators Waves automatically calculate indicators, channel trend trading Perfect trend-wave automatic calculation channel calculation , MT4 Perfect trend-wave automatic calculation channel calculation , MT5 Local Trading copying Easy And Fast Copy , MT4 Easy And Fast Copy , MT5 Local Trading copying For DE
FREE

--- StudentK Sync Chart --- 1. Move charts at the same time 2. Cross check among different Symbols and Timeframes 3. Plan your own trading strategies
=== Simple (Free) Version ===
1. Allow USDJPY only
2. Support M5 and M15
3. * Contact StudentK for unlocking all timeframes *
--- Context --- StudentK is not indicated as a master or K Sir for knowledgeable person who claims for winning all the time. (But lots of traders should know the fact that it is rarely truth, especially in fluctuat
FREE

Dynamic Theoretical Stop
Histogram indicator that dynamically analyzes the theoretical Stop levels in real time.
Operation :
The DTS - Dynamic Theoretical Stop does a mapping of fractals in previous candles and suggests two levels of Stop: For purchase and for sale.
Suggested reading :
It is necessary to make the definition of Maximum Stop in points in the Trading Plan. In this way, the trader can decide the best entry point by analyzing the theoretical stop levels:
Stop for sales: S
FREE

PACK 2 do Phi Cubic Fractals com opção para extender os indicadores no FUTURO, para o lado direito do gráfico Este produto contem os indicadores do PACK 2 (ROC full / SAINT 8 / SAINT 17 / SAINT 34 / SAINT 72 ) + MODO FUTURO Phi ROC - indicador do tipo oscilador, semelhante ao MIMAROC, que é capaz de mostrar a direção e a força do mercado, bem como determinar o ponto de entrada ótimo; Phi SAINT - indicador do tipo oscilador, semelhante ao SANTO do Phicube, que é capaz de mostrar a direção e a

Displays symbol tabs for easy access when trading, symbols that are coloured are symbols you have trades running on.
The indicator immediately shows the specified currency pair in the open window after clicking it. You no longer need to open a new window to view each chart thanks to the indicator. Additionally, it enables traders to concentrate on their trading approach by just keeping a small number of charts displayed.
FREE

Привет. Сегодня представляем индикатор корреляции - SynchroWindowTomson. Индикатор в одном окне показывает движение нескольких инструментов, по отношению друг к другу, удобно определять направление и изменение, особенно когда вы работаете с целым портфелем разных инструментов и нужно определить какой из них тянет результат назад и движется в другую сторону. Так же видны точки разворота спреда.
FREE

Indicador Regressão Linear – Par de Ativos - INTRADAY Indicador é um oscilador que faz o plot do Resíduo resultado da regressão linear entre os dois ativos inseridos como input do indicador, representado pela fórmula: Y = aX + b + R Onde Y é o valor do ativo dependente, X é o valor do ativo independente, a é a inclinação da reta entre os dois ativos, b é a intersecção da reta e R é o resíduo. O resíduo representa a quantidade da variabilidade que Y que o modelo ajustado não consegue explicar. E
FREE

Non-proprietary study of Joe Dinapoli used for overbought/oversold evaluation. Uses of Detrended Oscillator indicator Profit taking. Filter for market entry technics. Stop placement. Part of volatility breakout pattern. Determining major trend changes. Part of Dinapoli Stretch pattern. Inputs lnpPeriod: Perid of moving average Method: Calculation method ********************************************************************************* If you want to know market Overb
FREE

Индикатор имеет всего один параметр - это количество баров для анализа.
Индикатор рассчитывает статистику, когда рынок шел вниз, когда наверх, количество баров для каждого движения.
Из этих данных высчитывается средний показатель количества баров, который вырисовывается в окне индикатора.
Если значения индикатора резко понижается, то рынок готовится к движению наверх.
Если значения индикатора долго держится на высоких значениях, то рынок готовится к снижению.
FREE

What is this indicator? This indicator is the Stochastic Oscillator supporting Virtual Trading mode of Knots Compositor . When the mode is turned on, the indicator will be recalculated based on the displayed candlesticks. When the mode is turned off, the indicator will be recalculated based on the original chart candlesticks.
KC-Indicators - KC-MA (Moving Average) - KC-ENV (Envelopes) - KC-BB (Bollinger Bands) - KC-ADX (Average Directional Movement Index) - KC-MACD (Mo
FREE

Простейший индикатор для ручной торговли. Для комфортной торговли так же имеется эксперт https://www.mql5.com/ru/market/product/41133
Суть идикатора: уровни строяться на основе Moving Average с выбранным периодом по ценам High и Low. На разнице между High и Low строятся следующие уровни выше и ниже. В случае если бар не выходит за уровни, помечается зеленой меткой. Данную метку и уровни можно использовать для выставления отложенных ордеров когда цена на долго застревает между уровнями. Входны
FREE

Free version of https://www.mql5.com/en/market/product/44815 Simple indicator to calculate profit on fibonacci retracement levels with fixed lot size, or calculate lot size on fibonacci levels with fixed profit. Add to chart and move trend line to set the fibonacci retracement levels. Works similar as default fibonacci retracement line study in Metatrader. Inputs Fixed - select what value will be fix, lot or profit (available in full version, lot is set on free version) Fixed value - value tha
FREE

Numa folha qualquer
Eu desenho um sol amarelo
E com cinco ou seis retas
É fácil fazer um castelo
Corro o lápis em torno da mão e me dou uma luva
E se faço chover com dois riscos, tenho um guarda-chuva
Se um pinguinho de tinta
Cai num pedacinho azul do papel
Num instante imagino uma linda gaivota a voar no céu
Vai voando, contornando
A imensa curva norte-sul
Vou com ela viajando
Havai, Pequim ou Istambul
Pinto um barco à vela
Branco navegando
É tanto céu e mar num beijo azul
Entr
FREE

Sometimes swaps are hidden for certain financial instruments , hence incurring unprecedented costs over night. The need to uncover hidden swap costs is vital for profitable trading. With that being said, this expert indicator helps the trader to uncover the hidden swap costs.
Features chart objects with text short and long trade swap plug and play
Advantages uncover hidden swaps plug and play, no other configurations are needed to use it. usable on all charts and symbols swaps can be easily
FREE

Индикатор MWC COX показывает зоны экстремумов чистых длинных/коротких позиций в отчете по сделкам трейдеров, публикуемом комиссией CFTC раз в неделю за четыре периода. Настройки по умолчанию: периоды 12, 26, 52 и 156 недель.
Дополнительные функции Отображает сумму всех 4 периодов в одной строке Встроены индикаторы MA, MOM и RSI ( не в версии MQL5 Version 1.0 ) Необходимо скачать файл MWC_3L.dat в папку [...]/MQL5/Files . Более подробную инструкцию можно скачать здесь . Main data folder: www.my
FREE

Стрелочный индикатор, выдающий сигнал при пересечении канала боллинждера. Сигналы выдаются в виде стрелок и подходят для торговли бинарными опционами.
Входные параметры Period of BB - период боллинджера Shift of BB - смещение боллинджера Deviation of BB - отклонение боллинджера Inform about finding the signal - параметр, отвечающий за получение уведомлений (Alert) о найденном сигнале. По умолчанию - да
FREE

В стандартном индикаторе Bulls Power используется экспоненциальная скользящая средняя - Exponential Moving Average по цене закрытия - Price Close, что несколько ограничивает возможности этого индикатора. В представленном индикаторе Bulls Power Mod добавлен выбор из четырех скользящих средних и семи применяемых цен, что позволяет существенно расширить возможности данного индикатора.
FREE

Индикатор рисует цветную гистограмму из сравнений значений сил быков и медведей. Работает следующим образом: Берутся значения двух индикаторов Bears и Bulls, сравнивается кто сильнее на свече, заполняется столбец. Это всё.
.
FREE

Оригинальный трендовый индикатор. Индикатор рисует в отдельном окне три линии, характеризующие текущую динамику цены. Может принимать значения от -1 до +1. Чем ближе значение индикатора к +1, тем сильнее восходящий тренд. Чем ближе к -1, тем сильнее нисходящий. Также может применяться в качестве осциллятора для определения перекупленности/перепроданности. Индикатор имеет один входной параметр Period, в котором указывается количество баров, используемых для расчета.
FREE

The best Vwap Midas coding for Metatrader 5 you can find in White Trader indicators.
The indicator has been optimized not to recalculate (improving performance) and has several visual settings for you to adapt in your own way. TRY IT FOR FREE by clicking the free demo button Where and why to use Vwap Midas (and Auto Zig Vwap Midas) can be used on a variety of indices, currencies, forex, cryptocurrencies, stocks, indices and commodities.
Many successful traders use price and volume to ge

Индикатор Time And Sales Layout показывает проторгованные объемы покупок и продаж прямо на графике. Он предлагает графическое представление хорошо известной таблице (ленте) сделок "time and sales". Индикатор скачивает и обрабатывает историю реальных тиков. В зависимости от выбранной глубины истории процесс может занять ощутимое время. Во время обработки выводится комментарий с процентом выполнения. Когда история обработана, индикатор начинает анализировать тики в реальном времени. Последний бар

Indicator for fast navigation through financial instruments. When you click on the button, you go to the chart of the financial instrument, the name of which was written on the button. In other words, the indicator opens or unfolds an existing chart window. For each chart, you can customize the name of the financial instrument, text color and background color; in total, you can customize symbols buttons that you trade often. The indicator can be installed on any charts for which you need to swit
FREE

Индикатор измеряет и отображает разницу количества изменений цен "Bid" и "Ask" в виде цифровых, аналоговых и графических показателей. Предназначен для исследования рынка и для определения моментов выхода при скальпинговой торговле на периодах графиков не более одного часа (использование на старших периодах не запрещено, но не является информативным ввиду большого количества аккумулированных значений). Теория Цены "Bid" и "Ask" меняются не одновременно для большинства символов. Зачастую можно в
FREE

One of the simplest Pivot Point indicator, easy to operate, and most complete for a single chart in determining Resistance and Support level lines.
In single chart, it will show R&S Level Line with 5 popular types of Pivot Point, Highest&Lowest of closing price Include the Trend and up to 3 Time Frames.
Five types (Floor, Woodie, Camarilla, DeMark, & Fibonacci) of popular Pivot Points in determining Resistance and Support levels. With just using simple button on th
FREE

A scrolling Market Ticker that displays price changes from all symbols in the Market Watch list. Provides an easy snapshot of symbol prices, and keeps scrolling automatically while you trade and analyse the chart.
Options include: - MTF, eg choose to show price changes of the daily chart, or the hourly - use the live candle or the recently completed - font and background coloring
FREE

The RFOC Symbol Background was created to display the name of the asset and the current timeframe in the background of the chart.
Displaying the name of the asset at the bottom of the chart is often used by traders who are designing the screen for spectators, making it easier to identify the asset and the timeframe during a class, for example.
It is available for the user to select the font size (small, medium or large) and select the color for better viewing according to the background colo
FREE

Forex Indicator Arrows is an arrow Indicator used as an assistant tool for your trading strategy. The indicator analyzes the standard deviation of bar close for a given period and generates a buy or sell signals if the deviation increases. It good to combo with Martingale EA to follow Trend and Sellect Buy Only/Sell Only for EA work Semi-Automatic. You can use this Indicator with any EAs in my Products.
FREE

Мультитаймфреймовый трендовый индикатор, на основе индикатора ADX / ADXWilder Индикатор показывает трендовые участки, используя данные индикатора ADX или ADXWilder с нескольких таймфреймов. Импульсный режим индикатора позволяет поймать начало тренда, а несколько "Экранов" с разными таймфреймами позволяют отфильтровать рыночный шум.
Принцип работы индикатора: если PDI больше NDI, то устанавливается бычье движение; если PDI меньше NDI, то устанавливается медвежье движение; для определения какого
FREE

If your strategy requires trading during a certain period of market activity - calm or turbulent, this indicator will help you find such periods of time within a week for each currency pair using statistics.
The principle of the indicator is quite simple.
The entire trading week, from Monday 00:00 to Friday 23:59, is divided into timeslots, the duration of which corresponds to the current timeframe.
For each timeslot, activity is calculated - the average value of the difference between the
FREE

This indicator will mirror the assets in use in another metatrader, being able to choose the timeframe and a template. This is the Metatrader 5 Client, it needs the Metatrader 4 or 5 Server versions: Metatrader 4 Mirror Chart Server: https://www.mql5.com/en/market/product/88644
Metatrader 5 Mirror Chart Server: https://www.mql5.com/en/market/product/88652 Details of how it works in the video.
FREE

Spread Indicator MT5 - NS Finanças. (http://www.nsfinancas.com.br) Auxiliary tool to give Spread visibility to all types of currency pairs and timeframes. The labels are well positioned in the upper right corner of the chart so as not to disturb the visualization during the trade, however it is also possible to drag the indicator to the best place on your screen. In addition to the current spread, this indicator also monitors the minimum, maximum and average spread of the selected currency pair
FREE

Introduction
One of the patterns in "RTM" is the "QM" pattern, also known as "Quasimodo". Its name is derived from the appearance of "Hunchback of Notre-Dame" from Victor Hugo's novel. It is a type of "Head and Shoulders" pattern.
Formation Method
Upward Trend
In an upward trend, the left shoulder is formed, and the price creates a new peak higher than the left shoulder peak . After a decline, it manages to break the previous low and move upward again. We expect the pric

Consecutive candles can give us an indication as to the strength of a trend. With this indicator, you can set the number of consecutive bull or bear candles you wish to be present before achieving a valid signal of RSI crossing into overbought or oversold. With this information, you can better judge if a continuation or reversal situation is about to present. RSI has two settable levels
Interesting settings: Number of consecutive candles needed before a valid signal Overbought level of RSI Ove
FREE

Indicador Volatilidade Histórica Indicador é um oscilador que faz o plot da volatilidade histórica de um ativo, representado pelas fórmulas: Volatilidade Histórica = Raiz quadrada da média das diferenças ao quadrado * Fator de anualização. Média das diferenças ao quadrado = soma de todas as diferenças de retorno diário / número total das diferenças. Retorno diário = (preço atual - preço anterior) / preço anterior. Nesse indicador estamos utilizando os preços de fechamento de cada barra e fazemos
FREE
Индикатор отображает изменение баланса В правом нижнем углу окна.
Отображаются следующие периоды Сегодня Вчера 3 дня Неделя 10 дней Месяц 3 месяца Полгода Год Все время Есть возможность выставить расчетное время. Удобно пользоваться для расчетов прибыли/убытков с определенного часа.
Будет полезен например ночным скальперам. Данные совпадают с расчетами отчета в терминалее.
FREE

What is this indicator?
This indicator is the Envelopes supporting Virtual Trading mode of Knots Compositor . When the mode is turned on, the indicator will be recalculated based on the displayed candlesticks. When the mode is turned off, the indicator will be recalculated based on the original chart candlesticks.
Types of the moving average - Simple (SMA) - Exponential (EMA) - Smoothed (SMMA) - Linear weighted (LWMA)
Types of the applied price - Close - Open - High - Low - Median Pri
FREE

*Used by MeditionSeed EA. Meditation is a practice in which an individual uses a technique – such as mindfulness, or focusing the mind on a particular object, thought, or activity – to train attention and awareness, and achieve a mentally clear and emotionally calm and stable state.[1][2][3][4][web 1][web 2] Plant a Meditation Seed to have wonderful future.
FREE
Индикатор для арбитража. Отображает график произвольного сочетания торговых инструментов, описываемого введенной арифметической формулой. Область применения индикатора весьма обширна и ограничивается только вашей фантазией: Использование индикатора для арбитража. Подбор сочетаний инструментов, торгующихся в определенном канале, для применения к ним сеточных стратегий. Исследование динамики вашего портфеля активов. Использование индикатора: Добавьте индикатор на любой график. Символ графика не об
FREE

MACD ******************** MACD для платформы секундных графиков Micro . ********************* Секундный график на порядок увеличит точность ваших входов и выходов. Секундный период , в привычном формате, позволит увидеть то, что ранее было скрыто. Бесплатные индикаторы, дополнят визуальную картину, что, в совокупности выведет вашу торговлю на новый уровень. Идеально подходит как скальперам, так и трейдерам торгующим внутри дня. Индикатор MACD для платформы Micro. Входные параметры:
FREE
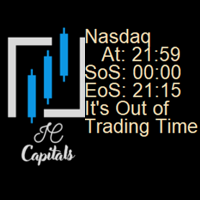
This indicator shows you the time of the opening and close of the trading time of every symbol. If it's out of the trading time it will show you a message in the screen, you can choose "PT-BR" or "ENG". For future updates i want to trigger a sound alarm in the preset value by the client for the opening of positions and closement of all positions.
If you want anything more than that just message me in the community ( https://discord.gg/P5mcttvXgw ) and I will update it for you!
FREE

Display the date, time and price according to the movement of the mouse cursor on the chart This is useful for discretionary trading.
It is an indispensable tool for verifying and studying past market prices and trades. Characteristic Date,Time and Price are displayed.
The value follows the movement of the mouse.
You can change the color of the text. Please refer to the video on youtube. For MT5 only.
FREE

Индикатор MAPC (Moving Average Percent's Change) показывает процентное изменение скользящей средней от одного периода к другому выбранному периоду и позволяет отслеживать сглаженный темп изменения цены. Индикатор MAPC рассчитывается по формуле: MAPC[i] = 100 * (MA[i] - MA[i - n]) / MA[i], где: MA[i] - текущее значение скользящей средней; MA[i - n] - значение скользящей средней, отстоящей на n периодов от текущего значения скользящей средней.
Входные настройки Period - период скользящей сред
FREE
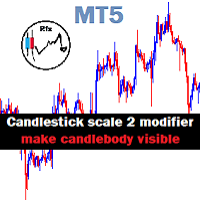
Chart Candlestick scale 2 zoom will visible instead of just a tiny unrecognized line make it look neat and tidy Instruction.
If you don't like the candles colors, you can do so by changing color. read below:
-Colors must be changed in the indicator setting.
-It won't change through the Chart properties to modify.
-After changing the color, save it as template so it wont change the colors to default value.
FREE
Простой индикатор RSI.
Пользователь может выбирать ТаймФрейм с которого рассчитывается RSI.
Например, вы используете чарт с графиком М5, но
хотите видеть в подвале графика RSI с ТаймФрейма H4.
RSIhtf.ex5(iRSI.ex5 - другое имя (h = higher, tf = timeframe) создан специально для такого случая.
Экспортирует 1 буфер со значениями индикатора.
Индикатор является частью торговой системы TS_DayTrader.
FREE
Узнайте, как легко и просто купить торгового робота в MetaTrader AppStore - магазине приложений для платформы MetaTrader.
Платежная система MQL5.community позволяет проводить оплату с помощью PayPal, банковских карт и популярных платежных систем. Кроме того, настоятельно рекомендуем протестировать торгового робота перед покупкой, чтобы получить более полное представление о нем.
Вы упускаете торговые возможности:
- Бесплатные приложения для трейдинга
- 8 000+ сигналов для копирования
- Экономические новости для анализа финансовых рынков
Регистрация
Вход
Если у вас нет учетной записи, зарегистрируйтесь
Для авторизации и пользования сайтом MQL5.com необходимо разрешить использование файлов Сookie.
Пожалуйста, включите в вашем браузере данную настройку, иначе вы не сможете авторизоваться.