Смотри обучающее видео по маркету на YouTube
Как купить торгового робота или индикатор
Запусти робота на
виртуальном хостинге
виртуальном хостинге
Протестируй индикатор/робота перед покупкой
Хочешь зарабатывать в Маркете?
Как подать продукт, чтобы его покупали
Технические индикаторы для MetaTrader 5 - 3

Indicador en MQL5, que obtiene el promedio de 10 EMAS, que son alineadas según Fibonacci, obteniendo un promedio, que sera suavizado. Se puede ingresar un numero desde 2 a N, que multiplica a los EMA-Fibonacci. Funciona en cualquier criptomoneda, etc. etc... pudiendo calcular el futuro segun la tendencia de las EMAS. Funciona excelentemente en tramos largos, determinando exactamente el mejor inicio/salida.
El precio inicial por apertura sera por un periodo de tiempo, luego aumentará.

It is a MetaTrader 5 integrated drawing tool inspired on the "Pointofix" software. You can paint, make annotations and drawings on the chart in real time. It works in multiple timeframes, that is, the drawings can be visualized in different timeframes. The drawings are also saved in files and can be restored even on MetaTrader restarting.
Simple and Pratical
Chart Pen is designed as simple, beautiful and innovative way to create and manage all your chart analysis. There is no existing drawi

ATR Scanner Pro is a multi symbol multi timeframe volatility scanner that monitors and analyzes Average True Range indicator value in up to 28 symbols and 9 timeframes in 3 modes : ATR value: As a volatility dashboard it shows the ATR indicator value in all pairs and timeframes and signals when the ATR value reaches a maximum or minimum in a given duration. Short term ATR/Long term ATR ratio: It shows ratio of 2 ATRs with different periods. It's useful in detecting short term volatility and

** All Symbols x All Timeframes scan just by pressing scanner button ** ***Contact me after purchase to send you instructions and add you in "RSI scanner group" for sharing or seeing experiences with other users. Introduction RSI divergence is a main technique used to determine trend reversing when it’s time to sell or buy because prices are likely to drop or pick in the charts. The RSI Divergence indicator can help you locate the top and bottom of the market. This indicator finds Regular diver

Trend Scanner mt5 сканирует рыночные тренды с мультисимволов и мультитаймфреймов и отображает их на подвижной панели на графике. Он использует индикатор Gold Stuff для анализа. Трейдер может выбрать несколько пар по своему выбору для отображения. Trend Scanner — отличный инструмент для определения направления тренда, который можно использовать для ручной торговли или торговли с помощью советника, разрешая только ордера на покупку или продажу в соответствии с трендом.
Результаты в режиме

Доброго времени суток!
Представляю вам торговый технический индикатор для синтетических индексов брокера Deriv. Данный индикатор работает ТОЛЬКО с нижеуказанными индексами: Boom 300 Index Boom 500 Index Boom 1000 Index Crash 300 Index Crash 500 Index Crash 1000 Index Индикатор создан для подачи сигналов на открытие среднесрочных сделок в сторону Спайков. Но вы можете открывать сделки и в противоположную Спайкам сторону, на свой риск. Торговля только на М1. Другие ТФ не гарантируют корректную р

MT4 Version Understanding market sentiment is a critical aspect of successful trading. Market sentiment refers to the overall feeling or attitude of traders and investors towards a particular financial instrument, such as a stock, currency pair, or cryptocurrency. It is a collective perception of market participants' emotions and beliefs about the asset's future price direction. Market sentiment can be bullish (positive), bearish (negative), or neutral (sideways). Knowing the market sentiment ca

Это индикатор торговых сессий который может отображать все уровни ( Open-High-Low-Close ) для четырех сессий. Сессии могут быть нарисованы линиями или с заливкой как свечи, линии могут быть продлены до следующей сессии. Вы можете легко скрывать/показывать каждую сессию нажатием на горячие клавиши. Также вы можете видеть ASR (средний диапазон сессий) (горячая клавиша по умолчанию «A»). Это похоже на расчет ADR, только он рассчитывается на основе последних X-сессий, что позволяет увидеть пот

One of the most powerful and important ICT concepts is the Power of 3. It explains the IPDA (Interbank Price Delivery Algorithm) phases. PO3 simply means there are 3 things that the market maker's algorithm do with price:
Accumulation, Manipulation and Distribution
ICT tells us how its important to identify the weekly candle expansion and then try to enter above or below the daily open, in the direction of the weekly expansion.
This handy indicator here helps you keep track of the weekly

ICT, SMC, Smart Money Concept, Support and Resistance, Trend Analysis, Price Action, Market Structure, Order Blocks, Breaker Blocks, Momentum Shift, Strong Imbalance, HH/LL/HL/LH, Fair Value Gap, FVG, Premium & Discount Zones, Fibonacci Retracement, OTE, Buyside Liquidity, Sellside Liquidity, Liquidity Voids, Market Sessions,Market Time, NDOG, NWOG,Silver Bullet,ict template
На финансовом рынке точный анализ рынка критически важен для инвесторов. Чтобы помочь инвесторам лучше понять тенденции

FREE Heiken Ashi Smoothed indicator is fully adjustable, easy to use and comes with possibility to access the indicator via iCustom function so you can use it in your own trading software. Indicator can also pop up alerts when signal changes or send push notifications. For Metatrader 4 version click here: https://www.mql5.com/en/market/product/70824 For detailed information click: >>HERE<< Features
Easy to use Accessible via iCustom Fully adjustable Alerts and Push notifications Possi
FREE

Classic MACD
It has MACD line, Signal line, and Histogram . The Histogram has 4 colors , showing its movement direction as simple as possible. The smoothing factor in the input helps to eliminate noisy signals. Besides different price types (hlc, hlcc, ohlc, ...), there is an option to use volume data as the source for MACD calculations (which is better to be used by real volume not unreliable tick volume). While the original MACD indicator uses Exponential Moving Average, this indicator provid
FREE

Прежде всего стоит подчеркнуть, что эта торговая система является индикатором без перерисовки, без перекрашивания и без задержек, что делает ее идеальной для профессиональной торговли.
Онлайн-курс, руководство пользователя и демонстрация. Торговая система "Умная система торговли на уровнях поддержки и сопротивления" является продвинутым индикатором, созданным для новичков и опытных трейдеров. Он дает трейдерам точность и уверенность на рынке Форекс. Эта всесторонняя система объединяет 7+ стр

note: this indicator is for METATRADER4, if you want the version for METATRADER5 this is the link: https://www.mql5.com/it/market/product/108106 TRENDMAESTRO ver 2.4 TRENDMAESTRO recognizes a new TREND in the bud, he never makes mistakes. The certainty of identifying a new TREND is priceless. DESCRIPTION TRENDMAESTRO identifies a new TREND in the bud, this indicator examines the volatility, volumes and momentum to identify the moment in which there is an explosion of one or more of these data a

The Supertrend indicator was originally created by a french fellow named Olivier Seban , and its goal is to identify the Primary Trend of prices . Its calculation is easy and based on the average of Highs and Lows and then we add the volatility of a custom period, plus a multiplier. This way we get the Supertrend Line. You can find in the web several approaches and trading strategies using this very useful indicator.
HOW TO "READ" THIS INDICATOR
If the closing prices are above Supertrend Line
FREE

Индикатор Market Structures MT5 находит на графике и показывает паттерн Break Of Structures (BoS) . Паттерн является важной составляющей частью системы Smart Money Concepts (SMC) .
Появление паттерна означает, что цена пробивает последний пик восходящего тренда, или последнее дно нисходящего тренда. Это указывает на изменение существующей структуры тренда и начало нового движения.
BOS — это инструмент технического анализа, используемый для выявления разворотов тренда. Набор входных параметро
FREE
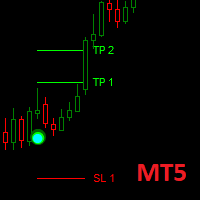
Dark Point is an Indicator for intraday trading. This Indicator is based on Trend Following strategy, also adopting the use of the atr to determine the right volatility. We can enter in good price with this Indicator, in order to follow the strong trend on the current instrument. If you love Dark Point, consider adding some power: Dark Power
Key benefits
Easily visible take profit/stop loss lines Intuitive directional points/arrows by colors Useful statistics , which indicate the
FREE

Market Structure Patterns is an indicator based on smart money concepts that displays SMC/ICT elements that can take your trading decisions to the next level. Take advantage of the alerts , push notifications and email messages to keep informed from when an element is formed on the chart, the price crosses a level and/or enters in a box/zone. Developers can access the values of the elements of the indicator using the global variables what allows the automation of trading

Представляем Koala FVG для MT5 – ваш профессиональный индикатор Fair Value Gap (FVG) Pattern. Koala FVG: ваш путь к точной торговле на MT5 Разблокируйте мощь паттерна Fair Value Gap (FVG) с Koala FVG – передовым индикатором, разработанным для MetaTrader 5. В течение ограниченного времени получите бесплатный доступ к этому профессиональному инструменту, прежде чем он станет платным. Основные функции: Обнаружение паттерна FVG: Koala FVG интеллектуально выявляет квалифицированные паттерны FVG на
FREE

Лучшее решение для новичка или трейдера-эксперта!
Этот индикатор является уникальным, высококачественным и доступным торговым инструментом, поскольку мы включили в него ряд собственных функций и секретную формулу. Всего на ОДНОМ графике он выдает алерты по всем 28 валютным парам. Представьте, как улучшится ваша торговля, ведь вы сможете точно определить точку запуска нового тренда или возможность скальпирования!
Построенный на новых базовых алгоритмах, он позволяет еще проще определять и по
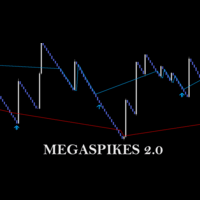
check out Megaclasic Spikes Robot here: https://www.mql5.com/en/market/product/109140 https://www.mql5.com/en/market/product/109140 MEGASPIKES BOOM AND CRASH v 2.0 NB: source codes of this indicator are available: PM me: https://t.me/Machofx The indicator is developed form a Studied combination of MA - Moving Average SAR - Parabolic Support and Resistance CCI - Commodity Channel Index
MegaSpikes 1.0 Download the 'MegaSpikes Boom and Crash' Technical Indicator for MetaTrader 5 in MetaTr
FREE

Dark Absolute Trend is an Indicator for intraday trading. This Indicator is based on Trend Following strategy but use also candlestick patterns and Volatility. We can enter in good price with this Indicator, in order to follow the main trend on the current instrument. It is advised to use low spread ECN brokers. This Indicator does Not repaint and N ot lag . Recommended timeframes are M5, M15 and H1. Recommended working pairs: All. I nstallation and Update Guide - Troubleshooting

Индикатор состоит из двух частей.
Часть I: Color Candles показывает главный тренд Color candles предназначен для идентификации состояния рынка по цвету свечей. Как видно на скриншотах, если бар окрашен в синий цвет, рынок находится в том состоянии, когда вам необходимо покупать или закрывать короткие позиции. Если бары окрашены в красный цвет, время продавать или закрывать длинные позиции. Если цвет меняется, следует подождать, пока он не сформируется (пока не закроется текущий бар). Часть II:

CAP Channel Trading - индикатор на основе волатильности, который в своей работе использует "теорию расширенных огибающих". Эти огибающие состоят из двух внешних линий. Теория огибающих утверждает, что рыночная цена, как правило, попадает в диапазон между границами огибающей (или канала). Если цены выходят за пределы огибающей, это торговый сигнал или торговая возможность.
Как торговать В основном CAP Channel Trading можно использовать для помощи при определении состояния перекупленности и пере
FREE

VJ Sniper - MT5 Buy / Sell Indicator: This Indicator is as simple as Buy in Up Trend & Sell in Down Trend. There are Support / Resistance Graphic levels for choosing the best Entries. Background: Any in-built indicator of MT5 does not work as stand alone such as Stochastic, CCI or DeMarker etc. But combination of them with trend projection work & give the best results for Trading entries. So this Indicator is blended to give the best

Um Inside Bar é um dos principais sinais de continuidade de uma tendência existente e as vezes reversão, pois nos mostra locais especiais de entrada, possibilitando uma boa taxa de Risco x Retorno. É simples visualizar um Inside Candle. Esse padrão é formado por apenas dois candles. O primeiro deve ser, preferencialmente grande, e o segundo deve estar integralmente contido dentro dos limites de máxima e mínima do primeiro.

Этот индикатор отображает до 6 уровней, которые можно включать и выключать, чтобы сделать график чище в соответствии с требованиями трейдера.
Эти 6 уровней разделены на 2 набора: высокий и низкий.
Для каждого набора можно выбрать другой таймфрейм
Он основан на стратегии разворота предыдущего максимума-минимума, поскольку считается, что цена обычно показывает отклонение на меньшем временном интервале, таком как 5 минут, когда цена достигает дневного, недельного или месячного максимума-мини

Если вы здесь, значит, вы уже знакомы с бесплатной версией Сканера стратегий . Кроме того, вам нужен инструмент с оповещениями, потому что это важно для вас: оповещения в MetaTrader оповещения на мобильном устройстве оповещения по электронной почте звуковые оповещения Эти оповещения всегда будут уведомлять вас, когда появится другая стрелка на активе на линии вашего Rule Plotter Scanner. Вы можете выбрать между звуковыми оповещениями, оповещениями в MetaTrader, оповещениями на вашем смартфоне и

To get access to MT4 version please click here . - This is the exact conversion from TradingView: "Hull Suite" By "Insilico". - This is a light-load processing and non-repaint indicator. - You can message in private chat for further changes you need. Here is the source code of a simple Expert Advisor operating based on signals from Hull Suite . #include <Trade\Trade.mqh> CTrade trade; int handle_hull= 0 ; input group "EA Setting" input int magic_number= 123456 ; //magic number input double fixe

MA 3 Trend – это хороший трендовый индикатор на трех МА. Преимущества индикатора: И ндикатор выдает сигналы с высокой точностью.
Подтвержденный сигнал индикатора не исчезает и не перерисовывается.
Торговать можно на торговой платформе MetaTrader 5 любого брокера.
Торговать можно любыми активами (валюты, металлы, крипто валюты, акции, индексы и т.д.).
Торговать можно на любых таймфреймах ( M 5- M 15 скальпинг и дейтрейдинг / М30-Н1 среднесрочная торговля / Н4- D 1 долгосрочная торг
FREE

Функции
Индикатор для торговли по уровням Фибоначчи График Фибоначчи рисуется на основе предыдущего выбранного бара из 1H, 4H, 1D и 1W. Когда рыночная цена касается уровня Фибоначчи, меняется цвет, и отображается время касания. График Фибоначчи рисуется на уровнях -23.6, 0, 23.6, 38.2, 50, 61.8, 76.4, 100 и 123.6, и график обновляется при обновлении бара.
Переменные
Таймфрейм: График Фибоначчи рисуется с выбранным таймфреймом из 1H, 4H, 1D и 1W. FiboWidth: Определяет толщину уровня. Fibo
FREE

To get access to MT4 version please click here . This is the exact conversion from TradingView: "ZLSMA - Zero Lag LSMA" by "veryfid". This is a light-load processing indicator. This is a non-repaint indicator. Buffers are available for processing in EAs. All input fields are available. You can message in private chat for further changes you need. Thanks for downloading

Stargogs Spike Catcher V3.12 This Indicator is Developed To milk the BOOM and CRASH indices . Send me Message if you need any help with the indicator. CHECK OUT THE STARGOGS SPIKE CATCHER EA/ROBOT V3: CLICK HERE ALSO CHECK OUT SECOND TO NONEFX SPIKE CATCHER: CLICK HERE STARGOGS SPIKE CATCHER V3.12 WHATS NEW! Brand New Strategy. This is the Indicator you need for 2023. The Indicator Gives you an Entry at a time when conditions are met enter on every arrow and exit when it gives an X. New Tren

The UT Bot Alert MT5 Indicator is an advanced technical analysis tool designed to help traders optimize their trading performance. This indicator is MT5 conversion of the UT Bot alerts indicator by “QuantNomad “ in Trading View website and some alert methods are added to provide real-time alerts when a trading signal is generated, in order to allow traders to act quickly and efficiently. Key Features: Alert Types: in addition to the terminal pop-up alerts, the mobile notification sends the alert

Вы устали вручную рисовать уровни Фибоначчи на своих графиках? Вы ищете удобный и эффективный способ определения ключевых уровней поддержки и сопротивления в своей торговле? Не смотрите дальше! Представляем DrawFib Pro, совершенный индикатор для MetaTrader 5, который выполняет автоматические уровни Фибоначчи. рисование на ваших графиках и предоставление своевременных предупреждений при нарушении этих уровней. С DrawFib Pro вы можете улучшить свои торговые стратегии, сэкономить время
FREE

Панда Фрактальный прорыв Простая визуализация фрактальных прорывов из моделей консолидации. Использует фракталы для определения угла поддержки и сопротивления для создания трендовых линий клешневого типа. Входы - Может показывать горизонтальную поддержку и сопротивление - Может показывать последний фрактал для стратегии Stop Loss - Может показывать фракталы на графике - Редактируемые цвета и стили линий Буферы для горизонтальных линий поставляются в окне данных, всего четыре буфера.
FREE

Elevate Your Trading Experience with the famous UT Bot Alert Indicator!
Summary: The UT Bot Alert Indicator by Quant Nomad has a proven track record and is your gateway to a more profitable trading journey. It's a meticulously crafted tool designed to provide precision, real-time insights, and a user-friendly experience.
Key Features: Precision Analysis: Powered by advanced algorithms for accurate trend identification, pinpointing critical support and resistance levels. Real-time

A Heatmap with a Volume Profile is like a thermal imager or x-ray machine. It will help you to estimate the relative distribution of volume during the price movement and to understand the relationship between volume and price. Indicator Volume Profile "Volumos Maxima" is a powerful tool for analyzing this relationship. After simple experimentation with heatmap, you can find that each trading instrument has its own “ characteristic ” way of distributing volume. And this will help you to make a b

Level 2 Book Visualization Indicator Our innovative indicator seamlessly integrates Level 2 order book data onto your trading chart, offering a real-time view of market depth and the dynamics of supply and demand. With its two key features, you can enhance your market analysis and make more informed trading decisions: Biggest Volume Highlight: This input allows traders to instantly identify the price levels with the largest order lots. By highlighting the heaviest concentration of buy or sell or
FREE

MT4 версия | FAQ | Советник Universal Breakout Universal Box строит на графике ценовые диапазоны , которые в дальнейшем можно использовать для торговли на пробой ценового диапазона. Есть довольно много стратегий, с которыми вы можете применить этот индикатор. Индикатор по умолчанию настроен так, чтобы отмечать на графике диапазоны Азиатской, Европейской и Американской торговых сессий . Диапазоны строятся в виде прямоугольников, границы которых это время начала и конца торговой се
FREE
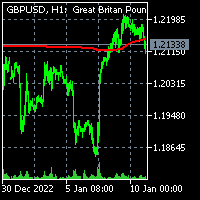
To get access to MT4 version please click here . - This is the exact conversion from TradingView: "Trend Regularity Adaptive Moving Average","TRAMA" By " LuxAlgo ". - This is a light-load processing and non-repaint indicator. - Buffer is available for the main line on chart. - You can message in private chat for further changes you need. Thanks for downloading

Dark Breakout is an Indicator for intraday trading. This Indicator is based on Trend Following strategy, providing an entry signal on the breakout. The signal is provided by the arrow, which confirms the breaking of the level. We can enter in good price with this Indicator, in order to follow the main trend on the current instrument. It is advised to use low spread ECN brokers. This Indicator does Not repaint and N ot lag . Recommended timeframes are M5, M15 and H1. Recommended working pairs

This is a simple order block locator. Searched for the existence of order blocks only at extremums. If you want multi criteria order block location check my other indicator which is more powerful here These order blocks are ICT order blocks without any buttering.
The indicator can be a useful tool for detecting reversals, continuations. You can also use the indicator as confluence with your other tools
FREE

This all-in-one indicator displays real-time market structure (internal & swing BOS / CHoCH), order blocks, premium & discount zones, equal highs & lows, and much more...allowing traders to automatically mark up their charts with widely used price action methodologies. Following the release of our Fair Value Gap script, we received numerous requests from our community to release more features in the same category. "Smart Money Concepts" (SMC) is a fairly new yet widely used term amongst price a

Добро пожаловать в наш паттерн ценовой волны MT5 --(паттерн ABCD)-- Паттерн ABCD является мощным и широко используемым торговым паттерном в мире технического анализа.
Это гармонический ценовой паттерн, который трейдеры используют для определения потенциальных возможностей покупки и продажи на рынке.
С помощью паттерна ABCD трейдеры могут предвидеть потенциальное движение цены и принимать обоснованные решения о том, когда открывать и закрывать сделки. Версия советника: Price Wave EA MT
FREE

Setup Tabajara был создан бразильским трейдером, известным как «OGRO с Уолл-стрит».
Идея этой установки состоит в том, чтобы указать трейдеру текущий тренд цен и тип операции, которую следует искать на графике.
Операция Он делает это путем позиционирования закрытия свечей и VWAP до 10:40 утра, а затем, используя среднее арифметическое значение за 20 периодов, раскрашивает свечи в 4 возможных цвета: Зеленый -> Цена растет в восходящем тренде (Поиск точек входа для ПОКУПКИ) Черный -> Коррекци
FREE

Introducing the Order Block Indicator , the pinnacle of trading technology. Order blocks, the large cluster of buy or sell orders placed by institutional traders, significantly influence market direction. They form at critical price levels and can act as robust support and resistance zones. Our cutting-edge indicator allows you to harness the full potential of these influential market dynamics, providing a never-before-seen level of precision and customization. Here's why this tool stands apart:

Успех или неудача при торговле на рынке Форекс по большей части зависит от управления капиталом. Как известно, открытие каждой сделки сопряжено с риском потери денег. Именно поэтому так важно контролировать риск.
Использование соотношения риска к прибыли в торговле При помощи Risk Reward Ratio для MetaTrader вы сможете оценивать риск каждой сделки, открытой на валютном рынке. Благодаря этому инструменту вы сможете проверить соотношение риска к прибыли у каждой запланированной сделки и точно оц

The True Oversold Overbought indicator provides you with ability to swiftly check whether the asset is oversold or overbought. Other than complementing your trading with True Oversold Overbought, you can use the indicator as your only trading system. It works with all forex instruments and will save you the headache of estimating when the market is due for a reversal or retracement. When the "Super Charge" feature is enabled, the areas where the price is in oversold/overbought status are ampli

This is the latest iteration of my famous indicator, Reversal Fractals, published for the first time almost a decade ago. It examines the price structure of fractals to determine possible reversal points in the market, providing timing to positional traders that already have a fundamental or technical valuation model. [ Installation Guide | Update Guide | Troubleshooting | FAQ | All Products ] Reversal fractals can start long trends The indicator is non repainting
It implements alerts of all k
FREE

Индикатор автоматически строит на графике уровни (зоны) поддержки и сопротивления с разных таймфреймов.
Уровни поддержки-сопротивления – это горизонтальные линии. Как правило, рынок реагирует не на конкретный уровень цены, а на диапазон цен вокруг уровня, т.к. спрос и предложение участников рынка формируются не четко на линии, а “размазаны” на некотором расстоянии от уровня
Индикатор определяет и рисует именно такой диапазон цен, в пределах которого формируются сильные позиции на продажу и п

ChartSync Pro MT5 is an indicator, designed for the MetaTrader 5 trading terminals. It enables the trader to perform better multi-timeframe technical analysis, by synchronizing symbols and objects into virtually unlimited charts. Built by traders for traders! Telegram Premium Support - Dd you purchase the Chart Sync indicator and need a bit of help? Send us a screenshot with your purchase and your Telegram ID so we can add you to our premium support Telegram group.
The indicator has vario

check out Megaclasic Spikes Robot here: https://www.mql5.com/en/market/product/109140 https://www.mql5.com/en/market/product/109140
MEGASPIKES BOOM AND CRASH v1.32 NB: source codes of this indicator are available: PM me: https://t.me/Machofx PLEASE JOIN THE CHANNEL BELOW TO HAVE ACCESS TO ALL PREVIOUS VERSIONS check out Spikes robot
BoomCrash Cheatcode EA : https://www.mql5.com/en/market/product/103365 https://t.me/machofxprotradin g Note: PLEASE THE NEW VERSION 1.32 OF THE SPIKES
FREE

Данный информационный индикатор будет полезен тем, кто всегда хочет быть в курсе текущей ситуации на счете.
- Больше полезных индикаторов Индикатор отображает такие данные, как прибыль в пунктах, процентах и валюте, а также спред по текущей паре и время до закрытия бара на текущем таймфрейме. Существует несколько вариантов расположения информационной строки на графике: Справа от цены (бегает за ценой); Как комментарий (в левом верхнем углу графика); В выбранном углу экрана. Так же имеется во
FREE

Introduction to Fractal Pattern Scanner Fractal Indicator refers to the technical indicator that makes use of the fractal geometry found in the financial market. Fractal Pattern Scanner is the advanced Fractal Indicator that brings the latest trading technology after the extensive research and development work in the fractal geometry in the financial market. The most important feature in Fractal Pattern Scanner is the ability to measure the turning point probability as well as the trend probabil

The indicator show Higher timeframe candles for ICT technical analisys Higher time frames reduce the 'noise' inherent in lower time frames, providing a clearer, more accurate picture of the market's movements.
By examining higher time frames, you can better identify trends, reversals, and key areas of support and resistance.
The Higher Time Frame Candles indicator overlays higher time frame data directly onto your current chart.
You can easily specify the higher time frame candles yo

KT Coppock Curve is a modified version of the original Coppock curve published in Barron's Magazine by Edwin Coppock in 1962. The Coppock curve is a price momentum indicator used to identify the market's more prominent up and down movements.
Features
It comes with up & down arrows signifying the zero line crossovers in both directions. It uses a simplified color scheme to represent the Coppock curve in a better way. It comes with all kinds of Metatrader alerts.
Applications It can provide

Gamma Bands This indcator shows the trend with the color histogram. It is simple and easy to use. Usage: If the histogram changes from the aqua to the fuchsia, which means the trend is up. If the histogram changes from the fuchsia to the aqua,which means the trend is down. Inputs: MaPeriods: the periods of moving average. f1: the multiplier of inner bands f2: the multiplier of outer bands Popup Window Alert Email Alert Mobile Push Alert Alerts When the trend changes for the long trend to the

An ICT fair value gap is a trading concept that identifies market imbalances based on a three-candle sequence. The middle candle has a large body while the adjacent candles have upper and lower wicks that do not overlap with the middle candle. This formation suggests that there is an imbalance where buying and selling powers are not equal. Settings Minimum size of FVG (pips) -> FVGs less than the indicated pips will be not be drawn Show touched FVGs Normal FVG color -> color of FVG that hasn't
FREE

MT5 Version Dashboard: Free scanner to monitor All pairs and timeframes. Please contact me after purchase, i will send it to you! MT4 version indicator: https://www.mql5.com/en/market/product/59127 Tip: This is an indicator for real-time signal display. When the indicator is loaded and running on the chart, the past signal cannot be displayed Market structure changes as price reverses And filter with all import features built inside one tool. Breaker's smart algorithm detects the reverses,

Если вам нравится этот проект, оставьте 5-звездочный обзор. Следуйте на instagram: borelatech Данный показатель рисует открытые, высокие, низкие и закрывающие цены на
указанные
период и его можно отрегулировать для специфического часового пояса. Это важные уровни, которые выглядят многие институциональные и профессиональные
трейдеры и могут быть полезны для вас, чтобы знать места, где они могут быть
больше
активный. Доступные периоды: Предыдущий день. Предыдущая неделя. Предыдущий месяц.
FREE

This indicator obeys the popular maxim that: "THE TREND IS YOUR FRIEND" It paints a GREEN line for BUY and also paints a RED line for SELL. (you can change the colors). It gives alarms and alerts of all kinds. IT DOES NOT REPAINT and can be used for all currency pairs and timeframes. Yes, as easy and simple as that. Even a newbie can use it to make great and reliable trades. NB: For best results, get my other premium indicators for more powerful and reliable signals. Get them here: https://www.m
FREE

Эта панель обнаруживает и отображает на графике зоны спроса и предложения , как в скальпинге, так и в долгосрочном режиме, в зависимости от вашей торговой стратегии для выбранных символов. Кроме того, сканерный режим панели помогает сразу проверить все нужные символы и не пропустить ни одной подходящей позиции / MT4 версия
Бесплатный индикатор: Basic Supply Demand
Особенности Позволяет просматривать торговые возможности по нескольким валютным парам , давая вам четкое и ясное п

Индикатор отображает на графике уровни пиковой активности, образованные свечами с пиковым содержанием объёма, отслеживая корреляцию таких свечей на таймфреймах, от старшего к младшему. Каждый объёмный уровень, в результате, представляет собой некую ключевую проторговку, наиболее важный кластер - внутри месяца, внутри недели, внутри дня, внутри часа и т.д..
Особенности работы индикатора Объёмный уровень приобретает статус Demand (спрос), если ближайший к нему объёмный уровень, находящийся левее

Indicator that will show your Balance , and your Equity . Really simple to use, no specific requirements to install it. However you can deeply configure it for your own wishes. The pannel has 4 buttons. Only current will display the information of the chart you linked the indicator. If this is deselected, you will have the information of the whole account. Only Buys will display only the BUY orders and Only Sells will display only the SELL orders. Show Zero will display the 0

Мультивалютный и мультитаймфреймовый индикатор Bollinger Bands. На панели вы можете видеть прорывы и касания (ценой) линий Боллинджера. В параметрах можете указать любые желаемые валюты и таймфреймы. Также индикатор может отправлять уведомления при касании Полос Боллинджера. По клику на ячейке будет открыт данный символ и период.
Параметры Настройки Bollinger Bands Averaging period — период усреднения для вычисления индикатора. Standard deviations — количество стандартных отклонений от основ

Royal Scalping Indicator is an advanced price adaptive indicator designed to generate high-quality trading signals. Built-in multi-timeframe and multi-currency capabilities make it even more powerful to have configurations based on different symbols and timeframes. This indicator is perfect for scalp trades as well as swing trades. Royal Scalping is not just an indicator, but a trading strategy itself. Features Price Adaptive Trend Detector Algorithm Multi-Timeframe and Multi-Currency Trend Low

PipTick Volume indicator is a great tool for measuring tick volume or real volume activity. Он помогает трейдерам легко и просто оценить текущий объем. Индикатор для классификации объема применяет скользящую среднюю и ее коэффициенты. Соответственно, участок, где расположен объем (относительно скользящей средней), помечается как сверхнизкий, низкий, средний, высокий, очень высокий или сверхвысокий. Данный индикатор рассчитывает скользящую среднюю четырьмя способами: SMA - простая скользящая сред

Introduction
Reversal Candles is a cutting-edge non-repainting forex indicator designed to predict price reversals with remarkable accuracy through a sophisticated combination of signals.
Signal Buy when the last closed candle has a darker color (customizable) and an up arrow is painted below it Sell when the last closed candle has a darker color (customizable) and a down arrow is painted above it
FREE

Pivot Point Fibo RSJ - это индикатор, который отслеживает линии поддержки и сопротивления дня с использованием ставок Фибоначчи.
Этот впечатляющий индикатор создает до 7 уровней поддержки и сопротивления через точку разворота с использованием ставок Фибоначчи. Замечательно, как цены уважают каждый уровень этой поддержки и сопротивления, где можно определить возможные точки входа / выхода из операции.
Функции До 7 уровней поддержки и 7 уровней сопротивления Устанавливайте цвета уровней индив
FREE
MetaTrader Маркет - лучшее место для продажи торговых роботов и технических индикаторов.
Вам необходимо только написать востребованную программу для платформы MetaTrader, красиво оформить и добавить хорошее описание. Мы поможем вам опубликовать продукт в сервисе Маркет, где его могут купить миллионы пользователей MetaTrader. Так что занимайтесь только непосредственно своим делом - пишите программы для автотрейдинга.
Вы упускаете торговые возможности:
- Бесплатные приложения для трейдинга
- 8 000+ сигналов для копирования
- Экономические новости для анализа финансовых рынков
Регистрация
Вход
Если у вас нет учетной записи, зарегистрируйтесь
Для авторизации и пользования сайтом MQL5.com необходимо разрешить использование файлов Сookie.
Пожалуйста, включите в вашем браузере данную настройку, иначе вы не сможете авторизоваться.