The power of ZigZag (part II). Examples of receiving, processing and displaying data
Anatoli Kazharski | 19 March, 2019
Contents
- Introduction
- Indicators defining the price behavior
- FrequencyChangeZZ indicator
- SumSegmentsZZ indicator
- PercentageSegmentsZZ indicator
- MultiPercentageSegmentsZZ indicator
- EA for collecting and displaying statistics
- Counting the number of segments by size
- Counting the number of segments by duration
- Some details of working with the graphical interface
- Conclusion
Introduction
In the first part of the article, I have described a modified ZigZag indicator and a class for receiving data of that type of indicators. Here, I will show how to develop indicators based on these tools and write an EA for tests that features making deals according to signals formed by ZigZag indicator.
As an addition, the article will introduce a new version of the EasyAndFast library for developing graphical user interfaces.
Main topics of the article:
- indicators defining the price behavior;
- EA with a graphical interface for collecting the price behavior statistics;
- EA for calculating the number of ZigZag indicator segments in specified ranges.
Indicators defining the price behavior
Let's consider three indicators defining the price behavior.
- FrequencyChangeZZ calculates frequency of oppositely directed ZigZag indicator segments formation.
- SumSegmentsZZ calculates sums of segments from the obtained set and their average value.
- PercentageSegmentsZZ defines the percentage ratio of segment sums and the difference between them.
- MultiPercentageSegmentsZZ defines the nature of the formation of several segments from a higher timeframe based on the values of the previous PercentageSegmentsZZ indicator.
The code structure of each of these indicators is the same as in the ZigZag indicator described in the first part of the article. Therefore, we will dwell only on the main function (FillIndicatorBuffers) where data is received and indicator buffers are filled.
FrequencyChangeZZ indicator
For FrequencyChangeZZ indicator, the code of the main function is the same as in the listing below. Bar index and time array are passed to the function. Next, a necessary number of ZigZag indicator and time array elements (source data) are copied from the current bar time. If source data is received, the final data are requested. After that, it remains only to call a method that returns the number of bars in the segment set. The result is saved to the current element of the indicator buffer.
//+------------------------------------------------------------------+
//| Fill in the indicator buffers                                    |
//+------------------------------------------------------------------+
void FillIndicatorBuffers(const int i,const datetime &time[])
  {
   int copy_total=1000;
   for(int t=0; t<10; t++)
     {
      if(::CopyBuffer(zz_handle,2,time[i],copy_total,h_zz_buffer_temp)==copy_total &&
         ::CopyBuffer(zz_handle,3,time[i],copy_total,l_zz_buffer_temp)==copy_total &&
         ::CopyTime(_Symbol,_Period,time[i],copy_total,t_zz_buffer_temp)==copy_total)
        {
         //--- Get ZZ data
         zz.GetZigZagData(h_zz_buffer_temp,l_zz_buffer_temp,t_zz_buffer_temp);
         //--- Save the number of bars in the segment set to the indicator buffer
         segments_bars_total_buffer[i]=zz.SegmentsTotalBars();
         break;
        }
     }
  }
In the external indicator parameters, we will specify the following:
(1) values should be calculated on all available data,
(2) minimum deviation for the ZigZag indicator's new segment formation and
(3) the number of extremums for obtaining final data.
All indicators in this article will have the same parameters.
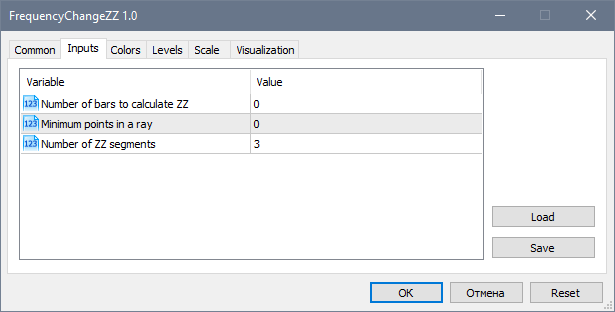
Fig. 1. Indicator external parameters
The FrequencyChangeZZ indicator displays the chart in a subwindow as displayed below. ZigZag indicator is uploaded on the main chart for more visibility. The indicator clearly displays when the price slows down in choosing its direction.
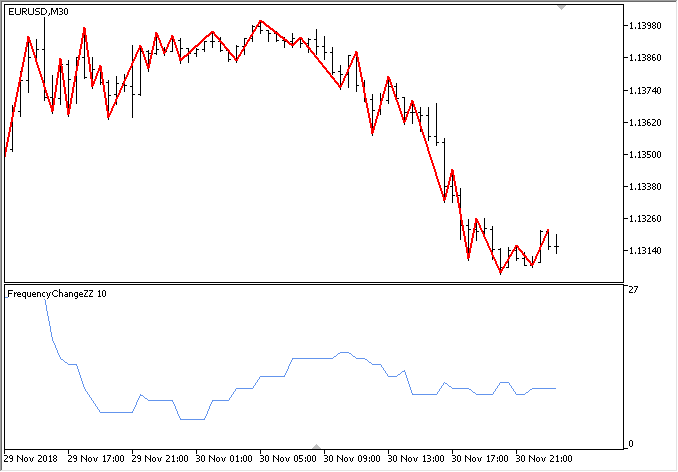
Fig. 2. FrequencyChangeZZ indicator
SumSegmentsZZ indicator
In the SumSegmentsZZ indicator, the main function for obtaining data looks as displayed in the following listing. All is the same as in the previous example. The only difference is that three indicator buffers are filled here for upward and downward segments separately. One more buffer is used to calculate the average of these parameters on the current values.
//+------------------------------------------------------------------+
//| Fill in the indicator buffers                                    |
//+------------------------------------------------------------------+
void FillIndicatorBuffers(const int i,const datetime &time[])
  {
   int copy_total=1000;
   for(int t=0; t<10; t++)
     {
      if(CopyBuffer(zz_handle,2,time[i],copy_total,h_zz_buffer_temp)==copy_total &&
         CopyBuffer(zz_handle,3,time[i],copy_total,l_zz_buffer_temp)==copy_total &&
         CopyTime(_Symbol,_Period,time[i],copy_total,t_zz_buffer_temp)==copy_total)
        {
         //--- Get ZZ data
         zz.GetZigZagData(h_zz_buffer_temp,l_zz_buffer_temp,t_zz_buffer_temp);
         //--- Get data by segments
         segments_up_total_buffer[i] =zz.SumSegmentsUp();
         segments_dw_total_buffer[i] =zz.SumSegmentsDown();
         segments_average_buffer[i]  =(segments_up_total_buffer[i]+segments_dw_total_buffer[i])/2;
         break;
        }
     }
  }
After uploading SumSegmentsZZ on the chart, you will see the result as in the screenshot below. Here we can see that after the blue line exceeds the red one, the sum of upward segments is greater that the sum of downward ones. The situation is reversed if the red line exceeds the blue one. Only experiments in the strategy tester can tell us whether this is a reliable source of info on the future price direction. At first glance, the longer the sum of unidirectional segments exceeds the sum of opposite segments, the higher the reversal probability.

Fig. 3. SumSegmentsZZ indicator
PercentageSegmentsZZ indicator
Now, let's have a look at the PercentageSegmentsZZ indicator. As in the previous case, three indicator buffers should be filled in the indicator's main function: one buffer each for the percentage ratios of segment sums directed (1) upwards and (2) downwards, as well as one buffer (3) for the difference between these values.
//+------------------------------------------------------------------+
//| Fill in the indicator buffers                                    |
//+------------------------------------------------------------------+
void FillIndicatorBuffers(const int i,const datetime &time[])
  {
   int copy_total=1000;
   for(int t=0; t<10; t++)
     {
      if(CopyBuffer(zz_handle,2,time[i],copy_total,h_zz_buffer_temp)==copy_total &&
         CopyBuffer(zz_handle,3,time[i],copy_total,l_zz_buffer_temp)==copy_total &&
         CopyTime(_Symbol,_Period,time[i],copy_total,t_zz_buffer_temp)==copy_total)
        {
         //--- Get ZZ data
         zz.GetZigZagData(h_zz_buffer_temp,l_zz_buffer_temp,t_zz_buffer_temp);
         //--- Get data on segments
         double sum_up =zz.SumSegmentsUp();
         double sum_dw =zz.SumSegmentsDown();
         double sum    =sum_up+sum_dw;
         //--- Percentage ratio and difference
         if(sum>0)
           {
            segments_up_total_buffer[i]   =zz.PercentSumSegmentsUp();
            segments_dw_total_buffer[i]   =zz.PercentSumSegmentsDown();
            segments_difference_buffer[i] =fabs(segments_up_total_buffer[i]-segments_dw_total_buffer[i]);
            break;
           }
        }
     }
  }
The result is shown below. Let's try to interpret it. When the difference in percentage ratios between the amounts of multidirectional segments is less than a certain threshold, that can be considered as flat. In this case, we should also keep in mind that the ratios should often interchange, since the price can shift in one direction for a long time, while the difference is lower than the level selected by the optimizer. In these cases, we should apply the models considering formation of the patterns in a certain sequence.

Fig. 4. PercentageSegmentsZZ indicator
MultiPercentageSegmentsZZ indicator
In the previous article, we have demonstrated the EA analyzing ZigZag indicator data from higher and lower timeframes simultaneously. Thus, it was possible to analyze in more detail how the price behaved within the segments from the higher timeframe. In other words, we defined how the higher timeframe segments formed on a lower timeframe. Let's see how this group of parameters will look in the form of a separate indicator displaying these values on the price history.
Like in the previous article's EA, we will receive four values of the difference between percentage ratios of the oppositely directed segment sums: one value is for the higher timeframe and three values are for the lower one. The values are calculated by the last three ZigZag indicator segments on the higher timeframe. The colors of the indicator buffers will be the same as in the EA from the previous part. After that, we will develop an EA to test the indicator, so that it is much easier for us to understand what data and for what time period we observe on the chart.
//--- Number of buffers
#property indicator_buffers 4
#property indicator_plots   4
//--- Colors of color buffers
#property indicator_color1 clrSilver
#property indicator_color2 clrRed
#property indicator_color3 clrLimeGreen
#property indicator_color4 clrMediumPurple
Declare four instances of the CZigZagModule class:
#include <Addons\Indicators\ZigZag\ZigZagModule.mqh>
CZigZagModule zz_higher_tf;
CZigZagModule zz_current0;
CZigZagModule zz_current1;
CZigZagModule zz_current2;
Let's add the ability to set a timeframe for a higher indicator for external parameters:
input             int NumberOfBars    =0;         // Number of bars to calculate ZZ
input             int MinImpulseSize  =0;         // Minimum points in a ray
input             int CopyExtremum    =5;         // Copy extremums
input ENUM_TIMEFRAMES HigherTimeframe =PERIOD_H1; // Higher timeframe
The main function for filling in the indicator buffers is implemented as follows. First, get the source data from the higher timeframe specified in the external parameters. Then get the final data and save the parameter value. Next, we consistently get data on the three indicator segments from the higher timeframe. After that, fill in all indicator buffers. I had to develop two separate code blocks, so that the indicator could be correctly calculated on history and on the last bar in real time/tester.
//+------------------------------------------------------------------+
//| Fill in the indicator buffers                                    |
//+------------------------------------------------------------------+
void FillIndicatorBuffers(const int i,const int total,const datetime &time[])
  {
   int index=total-i-1;
   int copy_total=1000;
   int h_buff=2,l_buff=3;
   datetime start_time_in =NULL;
   datetime stop_time_in  =NULL;
//--- Get source data from the higher timeframe
   datetime stop_time=time[i]-(PeriodSeconds(HigherTimeframe)*copy_total);
   CopyBuffer(zz_handle_htf,2,time[i],stop_time,h_zz_buffer_temp);
   CopyBuffer(zz_handle_htf,3,time[i],stop_time,l_zz_buffer_temp);
   CopyTime(_Symbol,HigherTimeframe,time[i],stop_time,t_zz_buffer_temp);
//--- Get final data from the higher timeframe
   zz_higher_tf.GetZigZagData(h_zz_buffer_temp,l_zz_buffer_temp,t_zz_buffer_temp);
   double htf_value=zz_higher_tf.PercentSumSegmentsDifference();
//--- First segment data
   zz_higher_tf.SegmentTimes(zz_handle_current,h_buff,l_buff,_Symbol,HigherTimeframe,_Period,0,start_time_in,stop_time_in);
   zz_current0.GetZigZagData(zz_handle_current,_Symbol,_Period,start_time_in,stop_time_in);
//--- Second segment data
   zz_higher_tf.SegmentTimes(zz_handle_current,h_buff,l_buff,_Symbol,HigherTimeframe,_Period,1,start_time_in,stop_time_in);
   zz_current1.GetZigZagData(zz_handle_current,_Symbol,_Period,start_time_in,stop_time_in);
//--- Third segment data
   zz_higher_tf.SegmentTimes(zz_handle_current,h_buff,l_buff,_Symbol,HigherTimeframe,_Period,2,start_time_in,stop_time_in);
   zz_current2.GetZigZagData(zz_handle_current,_Symbol,_Period,start_time_in,stop_time_in);
//--- On the last bar
   if(i<total-1)
     {
      buffer_zz_higher_tf[i] =htf_value;
      buffer_segment_0[i]    =zz_current0.PercentSumSegmentsDifference();
      buffer_segment_1[i]    =zz_current1.PercentSumSegmentsDifference();
      buffer_segment_2[i]    =zz_current2.PercentSumSegmentsDifference();
     }
//--- On history
   else
     {
      //--- In case there is a new bar of the higher timeframe
      if(new_bar_time!=t_zz_buffer_temp[0])
        {
         new_bar_time=t_zz_buffer_temp[0];
         //---
         if(i>2)
           {
            int f=1,s=2;
            buffer_zz_higher_tf[i-f] =buffer_zz_higher_tf[i-s];
            buffer_segment_0[i-f]    =buffer_segment_0[i-s];
            buffer_segment_1[i-f]    =buffer_segment_1[i-s];
            buffer_segment_2[i-f]    =buffer_segment_2[i-s];
           }
        }
      else
        {
         buffer_zz_higher_tf[i] =htf_value;
         buffer_segment_0[i]    =zz_current0.PercentSumSegmentsDifference();
         buffer_segment_1[i]    =zz_current1.PercentSumSegmentsDifference();
         buffer_segment_2[i]    =zz_current2.PercentSumSegmentsDifference();
        }
     }
  }
Let's make a copy of the EA from the previous article and add a few lines to test the MultiPercentageSegmentsZZ indicator. Add the external parameter for setting a higher timeframe. In order for the indicator to be displayed during an EA test in the tester in the visualization mode, it is enough to get its handle.
//--- External parameters
input            uint CopyExtremum    =3;         // Copy extremums
input             int MinImpulseSize  =0;         // Min. impulse size
input ENUM_TIMEFRAMES HigherTimeframe =PERIOD_H1; // Higher timeframe

...

//+------------------------------------------------------------------+
//| Expert initialization function                                   |
//+------------------------------------------------------------------+
int OnInit(void)
  {

...

//--- Path to ZZ indicator
   string zz_path1="Custom\\ZigZag\\ExactZZ_Plus.ex5";
   string zz_path2="Custom\\ZigZag\\MultiPercentageSegmentsZZ.ex5";
//--- Get indicator handles
   zz_handle_current   =::iCustom(_Symbol,_Period,zz_path1,0,MinImpulseSize,false,false);
   zz_handle_higher_tf =::iCustom(_Symbol,HigherTimeframe,zz_path1,0,MinImpulseSize,false,false);
   zz_handle           =::iCustom(_Symbol,_Period,zz_path2,0,MinImpulseSize,CopyExtremum,HigherTimeframe);

...

   return(INIT_SUCCEEDED);
  }
This is how it looks in the tester:
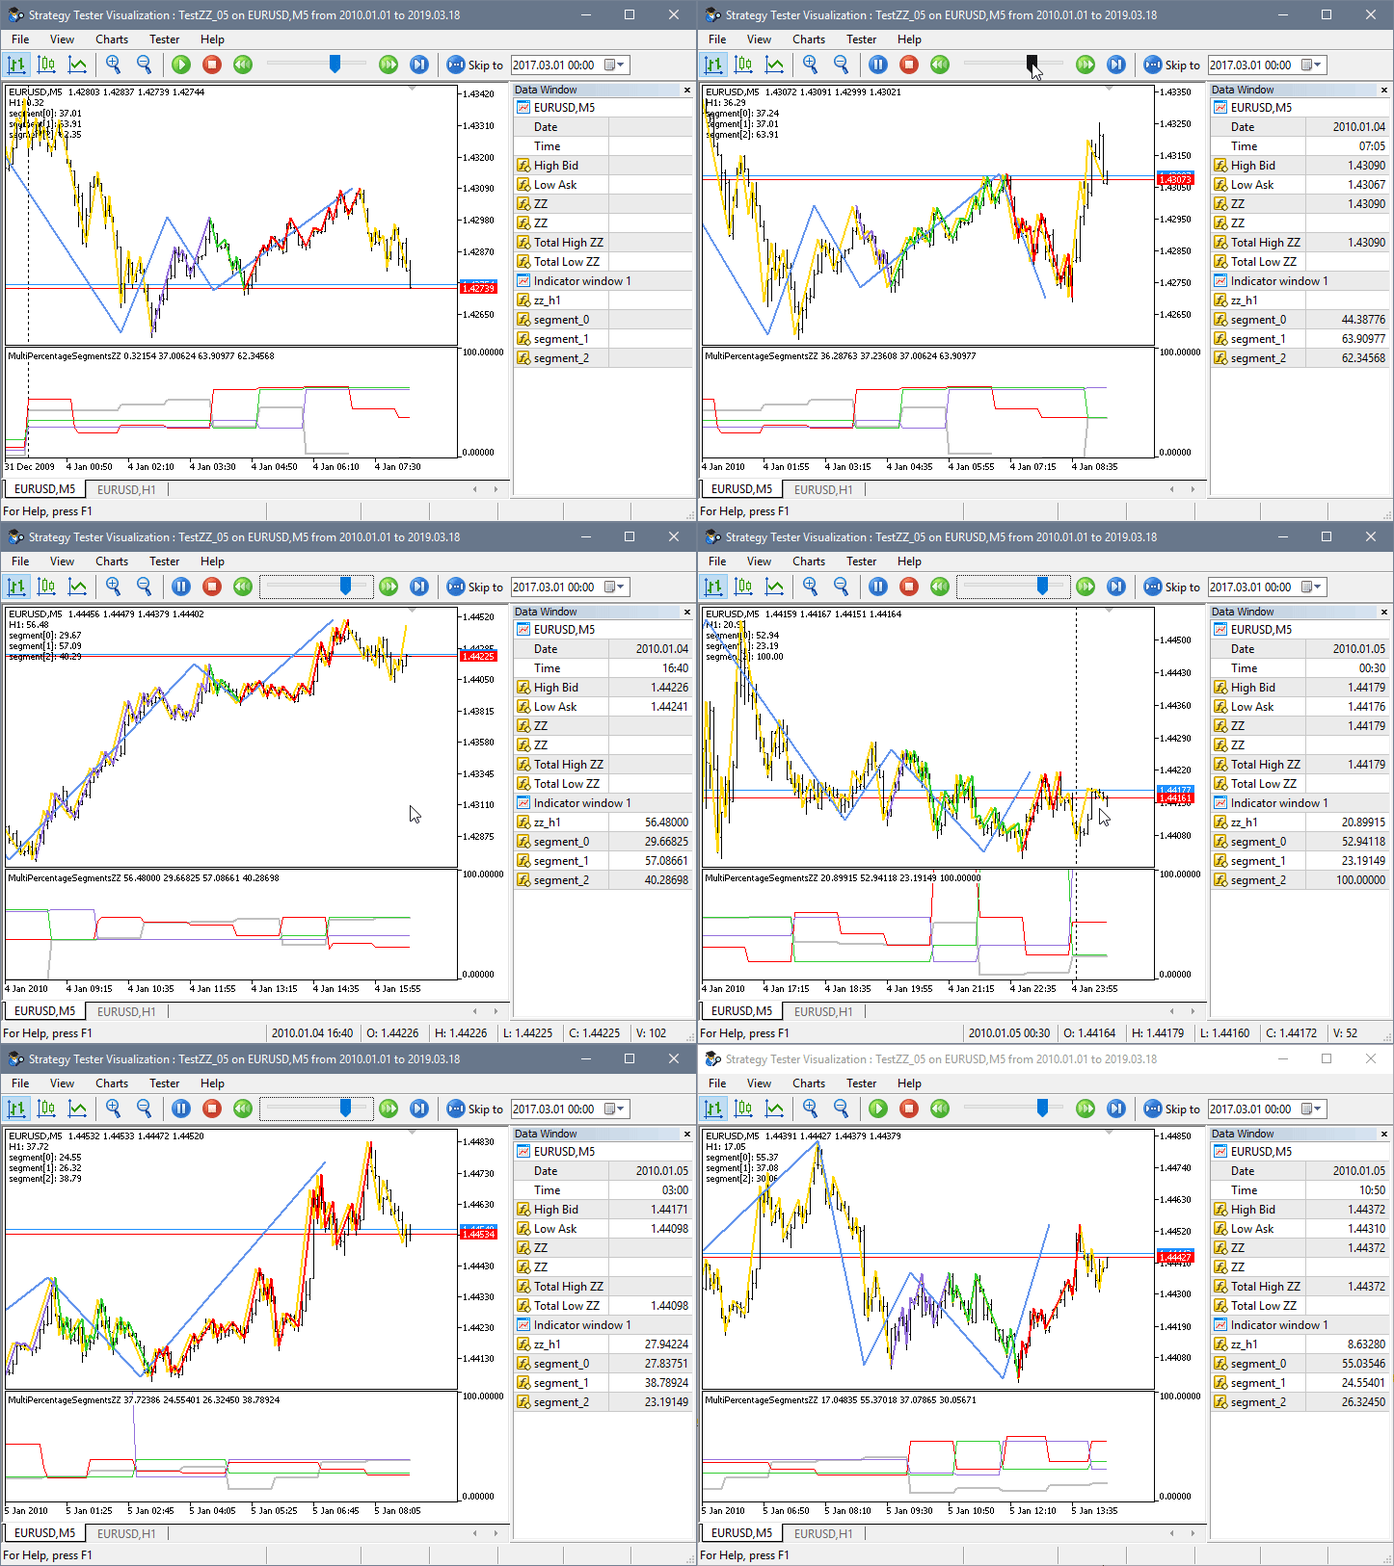
Fig. 5. MultiPercentageSegmentsZZ indicator
All the indicators described above can be used in various combinations and at the same time on different timeframes. Now, let's use the descried tools to gather some statistics on the set of symbols to understand which of them are better suited for trading in the price channel.
EA for collecting and displaying statistics
As an addition, the article introduces a new version of the EasyAndFast library for developing graphical user interfaces. Here we will list only the new library features:
- Changing the background color of each table cell (CTable class).
- Sorting direction.
- If the appropriate mode is enabled, a row is not highlighted when clicking on a checkbox in the table cell.
- Added support for the numeric keypad in the CKeys class.
- Added the CFrame class for combining elements into groups:

Fig. 6. Combining elements into groups
- Vertical scrolling in tables and lists.
- Added the CWndCreate class, which includes basic template methods for quick creation of most elements. It should be used as a base one for the custom class. Using this class allows you not to repeat the declaration and implementation of the same methods of creating elements in different projects, which greatly speeds up the development.
- Added the check for the correct sequence of creating elements to the CElement class.
- In the CWndEvents class, the ID is always reset after removing an element.
- Added the GetActiveWindowIndex() method to the CWndEvents for receiving the activated window index.
- Fixed the CListView class. Some auxiliary fields should be reset in the Clear() method to avoid out of range arrays in other methods of the CListView class.
The new version of the library can be downloaded in the CodeBase.
Next, let's create a test EA for gathering some statistics using the new version of the EasyAndFast library. We will start from developing the application's graphical user interface (GUI) and then proceed to methods for collecting and displaying statistics.
Let's define what GUI controls we need:
- Controls form.
- Status bar.
- Input field for sorting currencies that should be collected in the Market Watch window list.
- Drop-down calendars to indicate start and end dates for collecting statistics.
- Input field for setting the indicator level.
- Data request button.
- Table to display collected data.
- Progress bar.
As mentioned earlier, the CWndCreate class should be included to the custom class as a base one to develop a GUI faster and more conveniently. The full connection looks as follows: CWndContainer -> CWndEvents -> CWndCreate -> CProgram. The presence of the CWndCreate class allows creating GUI elements in a single line without creating separate methods in a custom class. The class contains different templates for almost all library elements. You can add new templates if necessary.
To create a GUI, declare the elements contained in the above list as shown in the following code listing. The current version of the CWndCreate class has no fast table creation template, therefore let's develop this method on our own.
//+------------------------------------------------------------------+
//|                                                      Program.mqh |
//|                        Copyright 2018, MetaQuotes Software Corp. |
//|                                              http://www.mql5.com |
//+------------------------------------------------------------------+
#include <EasyAndFastGUI\WndCreate.mqh>
//+------------------------------------------------------------------+
//| Class for developing the application                             |
//+------------------------------------------------------------------+
class CProgram : public CWndCreate
  {
private:
   //--- Window
   CWindow           m_window;
   //--- Status bar
   CStatusBar        m_status_bar;
   //--- Drop-down calendars
   CDropCalendar     m_from_date;
   CDropCalendar     m_to_date;
   //--- Buttons
   CButton           m_request;
   //--- Input fields
   CTextEdit         m_filter;
   CTextEdit         m_level;
   //--- Combo boxes
   CComboBox         m_data_type;
   //--- Tables
   CTable            m_table;
   //--- Progress bar
   CProgressBar      m_progress_bar;
   //---
public:
   //--- Create a GUI
   bool              CreateGUI(void);
   //---
private:
   //--- Tables
   bool              CreateTable(const int x_gap,const int y_gap);
  };
To create a graphical interface with such content, simply call the necessary methods of the CWndCreate class by specifying the values of properties as arguments as shown in the code listing below. To define a property a method parameter is related to, set a text cursor in it and click Ctrl + Shift + Space:

Fig. 7. Viewing method parameters
If you need to set additional properties, you can do that the same way as shown in the example involving the currency filter input field. Here it is indicated that the checkbox is to be enabled by default right after creating the element.
//+------------------------------------------------------------------+
//| Create a GUI                                                     |
//+------------------------------------------------------------------+
bool CProgram::CreateGUI(void)
  {
//--- Create control forms
   if(!CWndCreate::CreateWindow(m_window,"ZZ Market Scanner",1,1,640,480,true,true,true,true))
      return(false);
//--- Status bar
   string text_items[1];
   text_items[0]="For Help, press F1";
   int width_items[]={0};
   if(!CWndCreate::CreateStatusBar(m_status_bar,m_window,1,23,22,text_items,width_items))
      return(false);
//--- Currency filter input field
   if(!CWndCreate::CreateTextEdit(m_filter,"Symbols filter:",m_window,0,true,7,25,627,535,"USD","Example: EURUSD,GBP,NOK"))
      return(false);
   else
      m_filter.IsPressed(true);
//--- Drop-down calendar
   if(!CWndCreate::CreateDropCalendar(m_from_date,"From:",m_window,0,7,50,130,D'2018.01.01'))
      return(false);
   if(!CWndCreate::CreateDropCalendar(m_to_date,"To:",m_window,0,150,50,117,::TimeCurrent()))
      return(false);
//--- Input field for specifying the level
   if(!CWndCreate::CreateTextEdit(m_level,"Level:",m_window,0,false,280,50,85,50,100,0,1,0,30))
      return(false);
//--- Button
   if(!CWndCreate::CreateButton(m_request,"Request",m_window,0,375,50,70))
      return(false);
//--- Table
   if(!CreateTable(2,75))
      return(false);
//--- Progress bar
   if(!CWndCreate::CreateProgressBar(m_progress_bar,"Processing:",m_status_bar,0,2,3))
      return(false);
//--- End GUI development
   CWndEvents::CompletedGUI();
   return(true);
  }
In the case of a table, create a custom method, since it is a complex element with a large number of properties that should be specified before creating an element. It is to feature four columns. The first one will display currency pairs. The remaining ones will show statistical data on three timeframes: M5, H1 and H8.
//+------------------------------------------------------------------+
//| Create a table                                                   |
//+------------------------------------------------------------------+
bool CProgram::CreateTable(const int x_gap,const int y_gap)
  {
#define COLUMNS1_TOTAL 4
#define ROWS1_TOTAL    1
//--- Save a pointer to the main element
   m_table.MainPointer(m_window);
//--- Column width array
   int width[COLUMNS1_TOTAL];
   ::ArrayInitialize(width,50);
   width[0]=80;
//--- Array of text offset in columns by X axis
   int text_x_offset[COLUMNS1_TOTAL];
   ::ArrayInitialize(text_x_offset,7);
//--- Array of text alignment in columns
   ENUM_ALIGN_MODE align[COLUMNS1_TOTAL];
   ::ArrayInitialize(align,ALIGN_CENTER);
   align[0]=ALIGN_LEFT;
//--- Properties
   m_table.TableSize(COLUMNS1_TOTAL,ROWS1_TOTAL);
   m_table.TextAlign(align);
   m_table.ColumnsWidth(width);
   m_table.TextXOffset(text_x_offset);
   m_table.ShowHeaders(true);
   m_table.IsSortMode(true);
   m_table.IsZebraFormatRows(clrWhiteSmoke);
   m_table.AutoXResizeMode(true);
   m_table.AutoYResizeMode(true);
   m_table.AutoXResizeRightOffset(2);
   m_table.AutoYResizeBottomOffset(24);
//--- Create a control
   if(!m_table.CreateTable(x_gap,y_gap))
      return(false);
//--- Headers
   string headers[]={"Symbols","M5","H1","H8"};
   for(uint i=0; i<m_table.ColumnsTotal(); i++)
      m_table.SetHeaderText(i,headers[i]);
//--- Add an object to the common array of object groups
   CWndContainer::AddToElementsArray(0,m_table);
   return(true);
  }
Now let's consider methods for obtaining data. First, we need to get symbols we are to work with. In this EA version, we will receive data from Forex symbols. At the same time, we will exclude symbols, for which trading is disabled. Here we will also need the CheckFilterText() auxiliary method to check the symbol by the filter. In the input field, users are able to enter comma-separated text values that should be present in symbol names. If the field checkbox is disabled or the text is not entered, the check is not performed. If the checks are passed and a match should be found, the entered text is divided into substrings and the search for a necessary string is performed.
class CProgram : public CWndCreate
  {
private:
   //--- Check a symbol by filter
   bool              CheckFilterText(const string symbol_name);
  };
//+------------------------------------------------------------------+
//| Check a symbol by filter                                         |
//+------------------------------------------------------------------+
bool CProgram::CheckFilterText(const string symbol_name)
  {
   bool check=false;
//--- If the symbol name filter is enabled
   if(!m_filter.IsPressed())
      return(true);
//--- If a text is entered
   string text=m_filter.GetValue();
   if(text=="")
      return(true);
//--- Divide into substrings
   string elements[];
   ushort sep=::StringGetCharacter(",",0);
   ::StringSplit(text,sep,elements);
//--- Check for match
   int elements_total=::ArraySize(elements);
   for(int e=0; e<elements_total; e++)
     {
      //--- Delete outside spaces
      ::StringTrimLeft(elements[e]);
      ::StringTrimRight(elements[e]);
      //--- If a match is detected
      if(::StringFind(symbol_name,elements[e])>-1)
        {
         check=true;
         break;
        }
     }
//--- Result
   return(check);
  }
In the CProgram::GetSymbols() method, pass along all symbols present on the server in a loop and collect the ones fitting the specified criteria into the array. In the general loop, all symbols are deleted from the Market Watch window. Only the ones contained in the array are added to the window afterwards.
class CProgram : public CWndCreate
  {
private:
   //--- Symbol array
   string            m_symbols[];
   //---
private:
   //--- Get symbols
   void              GetSymbols(void);
  };
//+------------------------------------------------------------------+
//| Get symbols                                                      |
//+------------------------------------------------------------------+
void CProgram::GetSymbols(void)
  {
//--- Progress
   m_progress_bar.LabelText("Get symbols...");
   m_progress_bar.Update(0,1);
//--- Clear symbol array
   ::ArrayFree(m_symbols);
//--- Collect the array of Forex symbols
   int symbols_total=::SymbolsTotal(false);
   for(int i=0; i<symbols_total; i++)
     {
      //--- Get a symbol name
      string symbol_name=::SymbolName(i,false);
      //--- Hide it in the Market Watch window
      ::SymbolSelect(symbol_name,false);
      //--- If this is not a Forex symbol, go to the next one
      if(::SymbolInfoInteger(symbol_name,SYMBOL_TRADE_CALC_MODE)!=SYMBOL_CALC_MODE_FOREX)
         continue;
      //--- If trading is disabled, go to the next one
      if(::SymbolInfoInteger(symbol_name,SYMBOL_TRADE_MODE)==SYMBOL_TRADE_MODE_DISABLED)
         continue;
      //--- Check a symbol by filter
      if(!CheckFilterText(symbol_name))
         continue;
      //--- Save a symbol to the array
      int array_size=::ArraySize(m_symbols);
      ::ArrayResize(m_symbols,array_size+1,1000);
      m_symbols[array_size]=symbol_name;
     }
//--- If the array is empty, set the current symbol as a default one
   int array_size=::ArraySize(m_symbols);
   if(array_size<1)
     {
      ::ArrayResize(m_symbols,array_size+1);
      m_symbols[array_size]=_Symbol;
     }
//--- Display in the Market Watch window
   int selected_symbols_total=::ArraySize(m_symbols);
   for(int i=0; i<selected_symbols_total; i++)
      ::SymbolSelect(m_symbols[i],true);
  }
To obtain data on the collected symbols, we should first get the indicator handles on them. Every time we get the indicator handle, we need to wait until the end of its calculation before copying its data for further analysis. After all the data are received, the necessary calculations are carried out.
The CProgram::GetSymbolsData() method is used for that. It accepts two parameters: symbol and timeframe. After receiving the indicator handle, find out how many bars are present in the specified time range. The date range can be specified using the application’s GUI controls. Next, we try to get the amount of calculated indicator data. The indicator calculation may not be completed immediately after receiving the handle. Therefore, if the BarsCalculated() function returns -1, we make new attempts to get a valid value till it is equal or exceeds the total number of bars in the specified time range.
After the indicator data are calculated, we can try getting them into the array. It may as well take several attempts until the quantity is also greater than or equal to the total number of bars.
If the indicators are successfully copied to the array, it remains only to make the necessary calculations. In this case, we calculate the percentage ratio of the total amount of data to the amount, in which the indicator value is above the specified level. This level can also be specified in the application's GUI.
At the end of the method, remove the indicator handle releasing its calculation part. The CProgram::GetSymbolsData() method is called multiple times for a selected list of symbols and several timeframes. Calculation for each of them should be performed only once, and the resulting value is displayed in the GUI table, so the handles are no longer needed and can be removed.
class CProgram : public CWndCreate
  {
private:
   //--- Get symbol data
   double            GetSymbolsData(const string symbol,const ENUM_TIMEFRAMES period);
  };
//+------------------------------------------------------------------+
//| Get symbol data                                                  |
//+------------------------------------------------------------------+
double CProgram::GetSymbolsData(const string symbol,const ENUM_TIMEFRAMES period)
  {
   double result       =0.0;
   int    buffer_index =2;
//--- Get indicator handle
   string path   ="::Indicators\\Custom\\ZigZag\\PercentageSegmentsZZ.ex5";
   int    handle =::iCustom(symbol,period,path,0,0,5);
   if(handle!=INVALID_HANDLE)
     {
      //--- Copy data within a specified range
      double   data[];
      datetime start_time =m_from_date.SelectedDate();
      datetime end_time   =m_to_date.SelectedDate();
      //--- Number of bars in a specified range
      int bars_total=::Bars(symbol,period,start_time,end_time);
      //--- Number of bars in a specified range
      int bars_calculated=::BarsCalculated(handle);
      if(bars_calculated<bars_total)
        {
         while(true)
           {
            ::Sleep(100);
            bars_calculated=::BarsCalculated(handle);
            if(bars_calculated>=bars_total)
               break;
           }
        }
      //--- Get data
      int copied=::CopyBuffer(handle,buffer_index,start_time,end_time,data);
      if(copied<1)
        {
         while(true)
           {
            ::Sleep(100);
            copied=::CopyBuffer(handle,buffer_index,start_time,end_time,data);
            if(copied>=bars_total)
               break;
           }

        }
      //--- Exit if no data is received
      int total=::ArraySize(data);
      if(total<1)
         return(result);
      //--- Count the number of repetitions
      int counter=0;
      for(int k=0; k<total; k++)
        {
         if(data[k]>(double)m_level.GetValue())
            counter++;
        }
      //--- Percentage ratio
      result=((double)counter/(double)total)*100;
     }
//--- Release the indicator
   ::IndicatorRelease(handle);
//--- Return the value
   return(result);
  }
Every time a new symbol list is formed, the table needs to be rebuilt. To do this, simply delete all rows and add the necessary amount.
class CProgram : public CWndCreate
  {
private:
   //--- Re-build the table
   void              RebuildingTables(void);
  };
//+------------------------------------------------------------------+
//| Re-build the table                                               |
//+------------------------------------------------------------------+
void CProgram::RebuildingTables(void)
  {
//--- Remove all rows
   m_table.DeleteAllRows();
//--- Add data
   int symbols_total=::ArraySize(m_symbols);
   for(int i=1; i<symbols_total; i++)
      m_table.AddRow(i);
  }
The CProgram::SetData() method is used to fill in the table columns with data. Two parameters (column index and timeframe) are passed to it. Here, we move through the cells of a specified column and fill them with calculated values in a loop. The progress bar displays a symbol and a timeframe, the data on which have just been received, so that users understand what is currently going on.
class CProgram : public CWndCreate
  {
private:
   //--- Set values to a specified column
   void              SetData(const int column_index,const ENUM_TIMEFRAMES period);
   //--- Timeframe to a string
   string            GetPeriodName(const ENUM_TIMEFRAMES period);
  };
//+------------------------------------------------------------------+
//| Set values to a specified column                                 |
//+------------------------------------------------------------------+
void CProgram::SetData(const int column_index,const ENUM_TIMEFRAMES period)
  {
   for(uint r=0; r<(uint)m_table.RowsTotal(); r++)
     {
      double value=GetSymbolsData(m_symbols[r],period);
      m_table.SetValue(column_index,r,string(value),2,true);
      m_table.Update();
      //--- Progress
      m_progress_bar.LabelText("Data preparation ["+m_symbols[r]+","+GetPeriodName(period)+"]...");
      m_progress_bar.Update(r,m_table.RowsTotal());
     }
  }
//+------------------------------------------------------------------+
//| Return the period string value                                   |
//+------------------------------------------------------------------+
string CProgram::GetPeriodName(const ENUM_TIMEFRAMES period)
  {
   return(::StringSubstr(::EnumToString(period),7));
  }
The main method for filling the table with data is CProgram::SetDataToTable(). The table is rebuilt here first. Next, we need to set headers and data type in it (TYPE_DOUBLE). Set collected symbols to the first column. Re-draw the table to see the changes immediately.
Now we can start receiving the indicator data on all the specified symbols and timeframes. To do this, simply call the CProgram::SetData() method passing the column index and timeframe as parameters.
class CProgram : public CWndCreate
  {
private:
   //--- Fill the table with data
   void              SetDataToTable(void);
  };
//+------------------------------------------------------------------+
//| Fill the table with data                                         |
//+------------------------------------------------------------------+
void CProgram::SetDataToTable(void)
  {
//--- Progress
   m_progress_bar.LabelText("Data preparation...");
   m_progress_bar.Update(0,1);
//--- Re-build the table
   RebuildingTable();
//--- Headers
   string headers[]={"Symbols","M5","H1","H8"};
   for(uint i=0; i<m_table.ColumnsTotal(); i++)
      m_table.SetHeaderText(i,headers[i]);
   for(uint i=1; i<m_table.ColumnsTotal(); i++)
      m_table.DataType(i,TYPE_DOUBLE);
//--- Set values to the first column
   for(uint r=0; r<(uint)m_table.RowsTotal(); r++)
      m_table.SetValue(0,r,m_symbols[r],0,true);
//--- Show the table
   m_table.Update(true);
//--- Fill the remaining columns with data
   SetData(1,PERIOD_M5);
   SetData(2,PERIOD_H1);
   SetData(3,PERIOD_H8);
  }
Before receiving new data using the CProgram::GetData() method, we should make the progress bar visible with the help of the CProgram::StartProgress() method. After new data is received, hide the progress bar and remove focus from the pressed button. To do this, call the CProgram::EndProgress() method.
class CProgram : public CWndCreate
  {
private:
   //--- Get data
   void              GetData(void);

   //--- Progress (1) start and (2) end
   void              StartProgress(void);
   void              EndProgress(void);
  };
//+------------------------------------------------------------------+
//| Get data                                                         |
//+------------------------------------------------------------------+
void CProgram::GetData(void)
  {
//--- Progress start
   StartProgress();
//--- Get symbol list
   GetSymbols();
//--- Fill the table with data
   SetDataToTable();
//--- Progress end
   EndProgress();
  }
//+------------------------------------------------------------------+
//| Progress start                                                   |
//+------------------------------------------------------------------+
void CProgram::StartProgress(void)
  {
   m_progress_bar.LabelText("Please wait...");
   m_progress_bar.Update(0,1);
   m_progress_bar.Show();
   m_chart.Redraw();
  }
//+------------------------------------------------------------------+
//| Progress end                                                     |
//+------------------------------------------------------------------+
void CProgram::EndProgress(void)
  {
//--- Hide the progress bar
   m_progress_bar.Hide();
//--- Update the button
   m_request.MouseFocus(false);
   m_request.Update(true);
   m_chart.Redraw();
  }
When a user clicks Request, the ON_CLICK_BUTTON custom event is generated, and we are able to define a pressed button by the element ID. If this is the Request button, launch the data obtaining process.
In the table creation method, we included the ability to sort the table by clicking on the headers. The ON_SORT_DATA custom event is generated every time we do this. When the event is received, the table should be updated to display the changes.
//+------------------------------------------------------------------+
//| Event handler                                                    |
//+------------------------------------------------------------------+
void CProgram::OnEvent(const int id,const long &lparam,const double &dparam,const string &sparam)
  {
//--- Button pressing events
   if(id==CHARTEVENT_CUSTOM+ON_CLICK_BUTTON)
     {
      if(lparam==m_request.Id())
        {
         //--- Get data
         GetData();
         return;
        }
      //---
      return;
     }
//--- Sorted table events
   if(id==CHARTEVENT_CUSTOM+ON_SORT_DATA)
     {
      if(lparam==m_table.Id())
        {
         m_table.Update(true);
         return;
        }
      //---
      return;
     }
  }
Now, let's see the results. If we compile the program and load it on to the chart, the result will be as in the screenshot below. The following parameters are set by default:
- The Symbols filter input field is enabled. It indicates that it is necessary to obtain data only for symbols having USD in their names.
- The data should be obtained within the 2018.01.01 - 2018.12.21 time interval.
- The Level value used as a reference point for the calculations is set to 30.
- In this version, timeframes the calculations are performed at are rigidly set in the code: M5, H1 and H8.

Fig. 8. MQL application's GUI
Pressing Request launches the data acquisition:
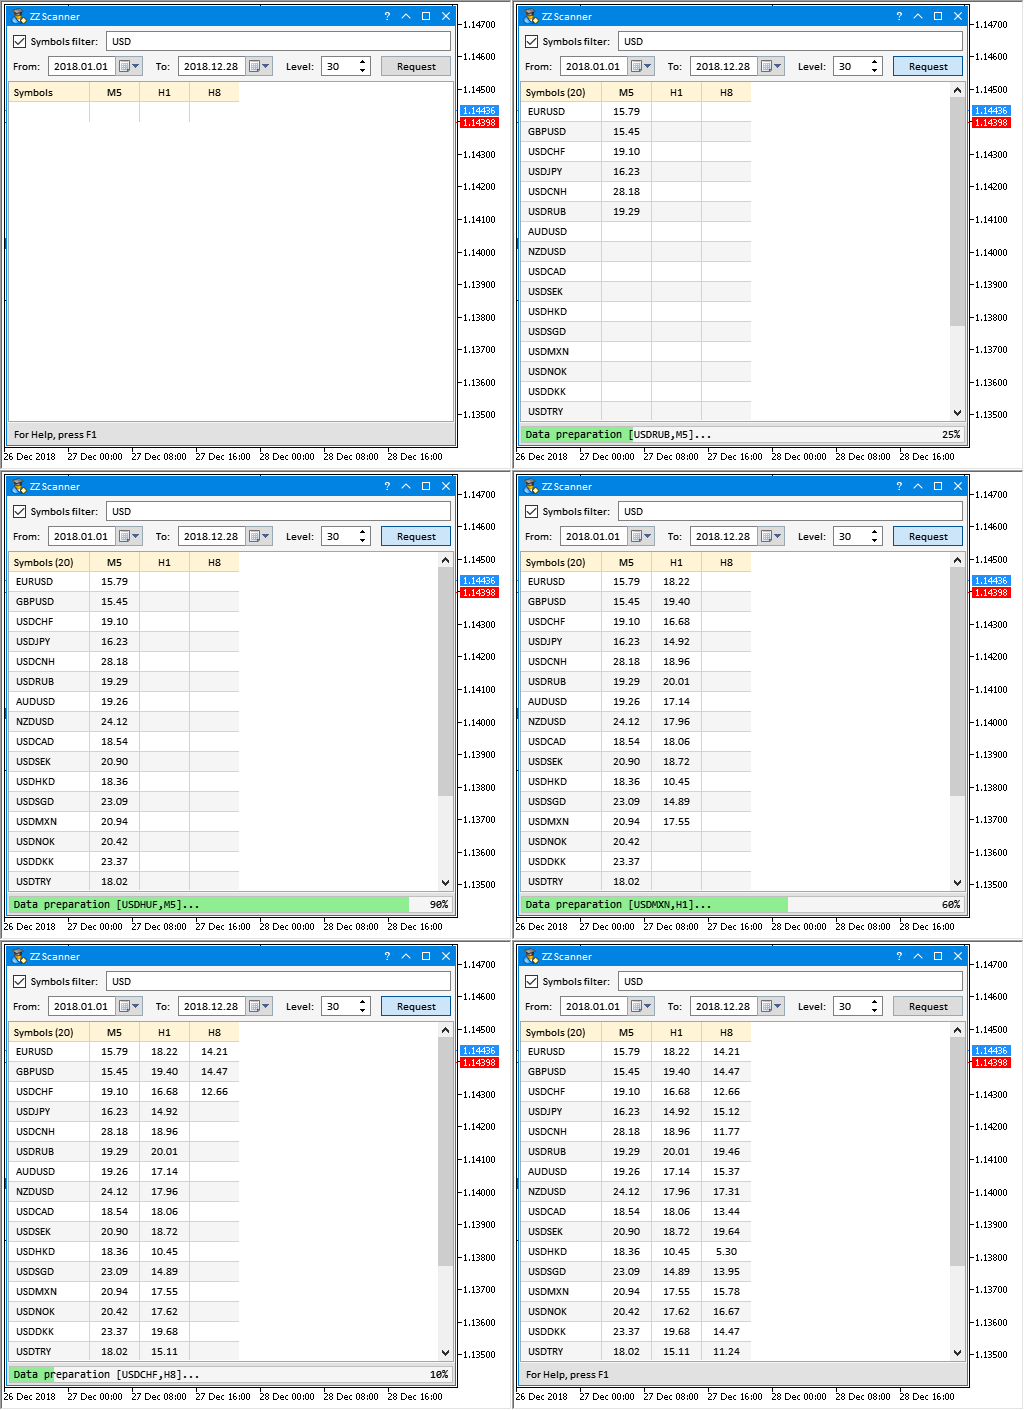
Fig. 9. Receiving data
After receiving all the data, you can sort them:
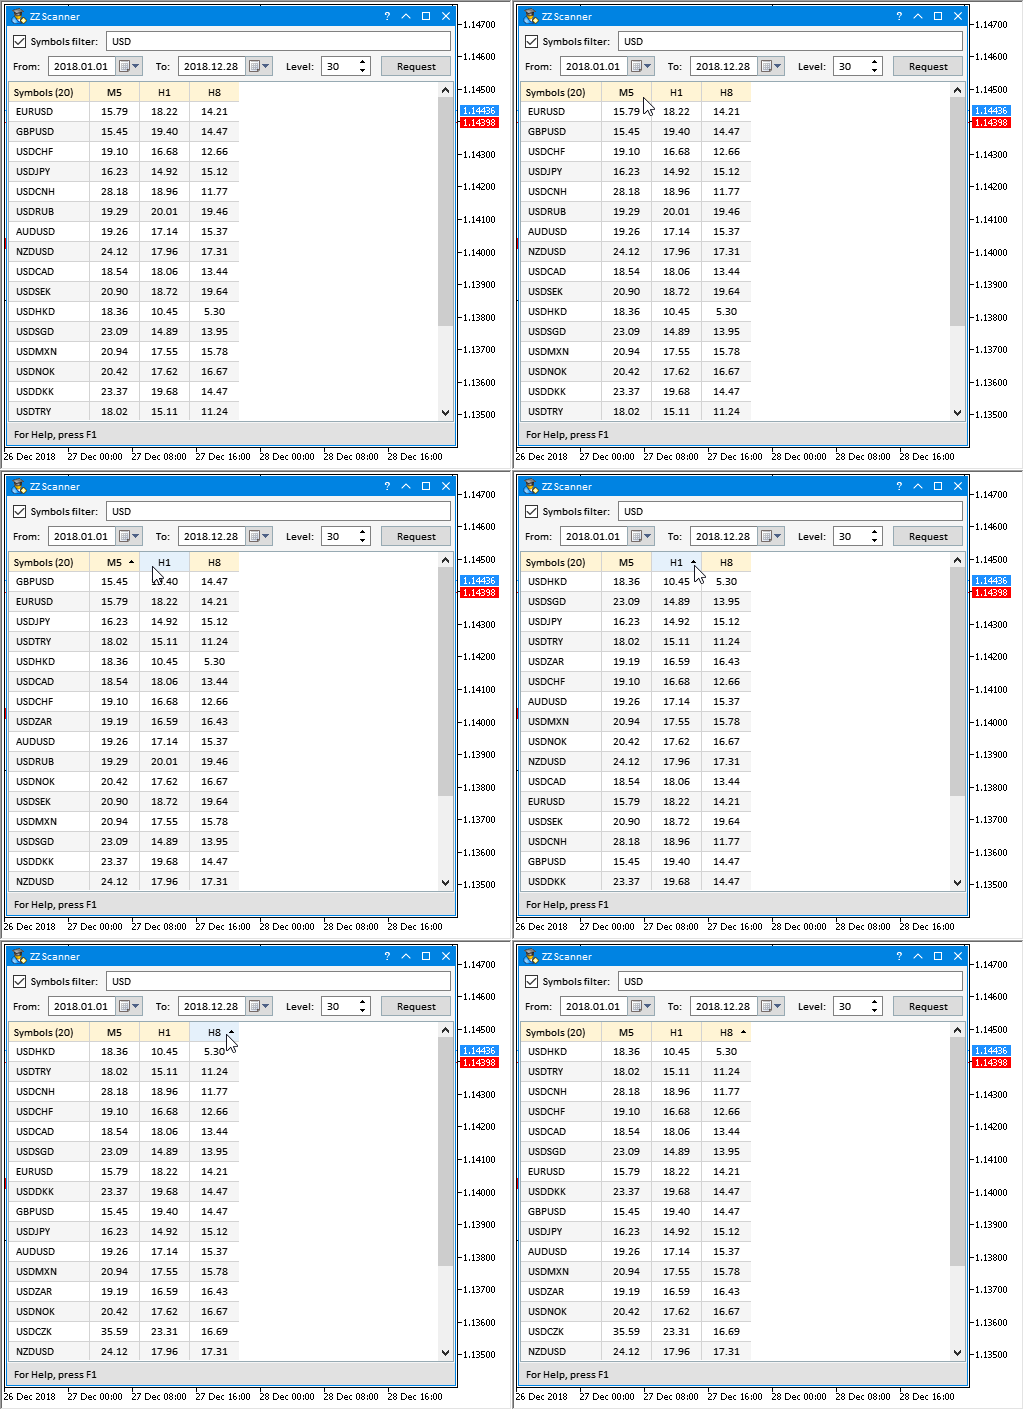
Fig. 10. Sorting table data
You can modify and use this application to solve some of your tasks. The table can be filled with any other parameters.
Below I will provide another example demonstrating how to improve table data visibility even further. As I have already mentioned at the beginning of this section, the latest version of the EasyAndFast library features the ability to set the background color of the table cells. This allows you to format the table as you see fit the same way as it is done in various table editors. The screenshot below shows formatting data in Excel spreadsheets. Each cell has its own background color remaining at the same value even when sorting arrays.
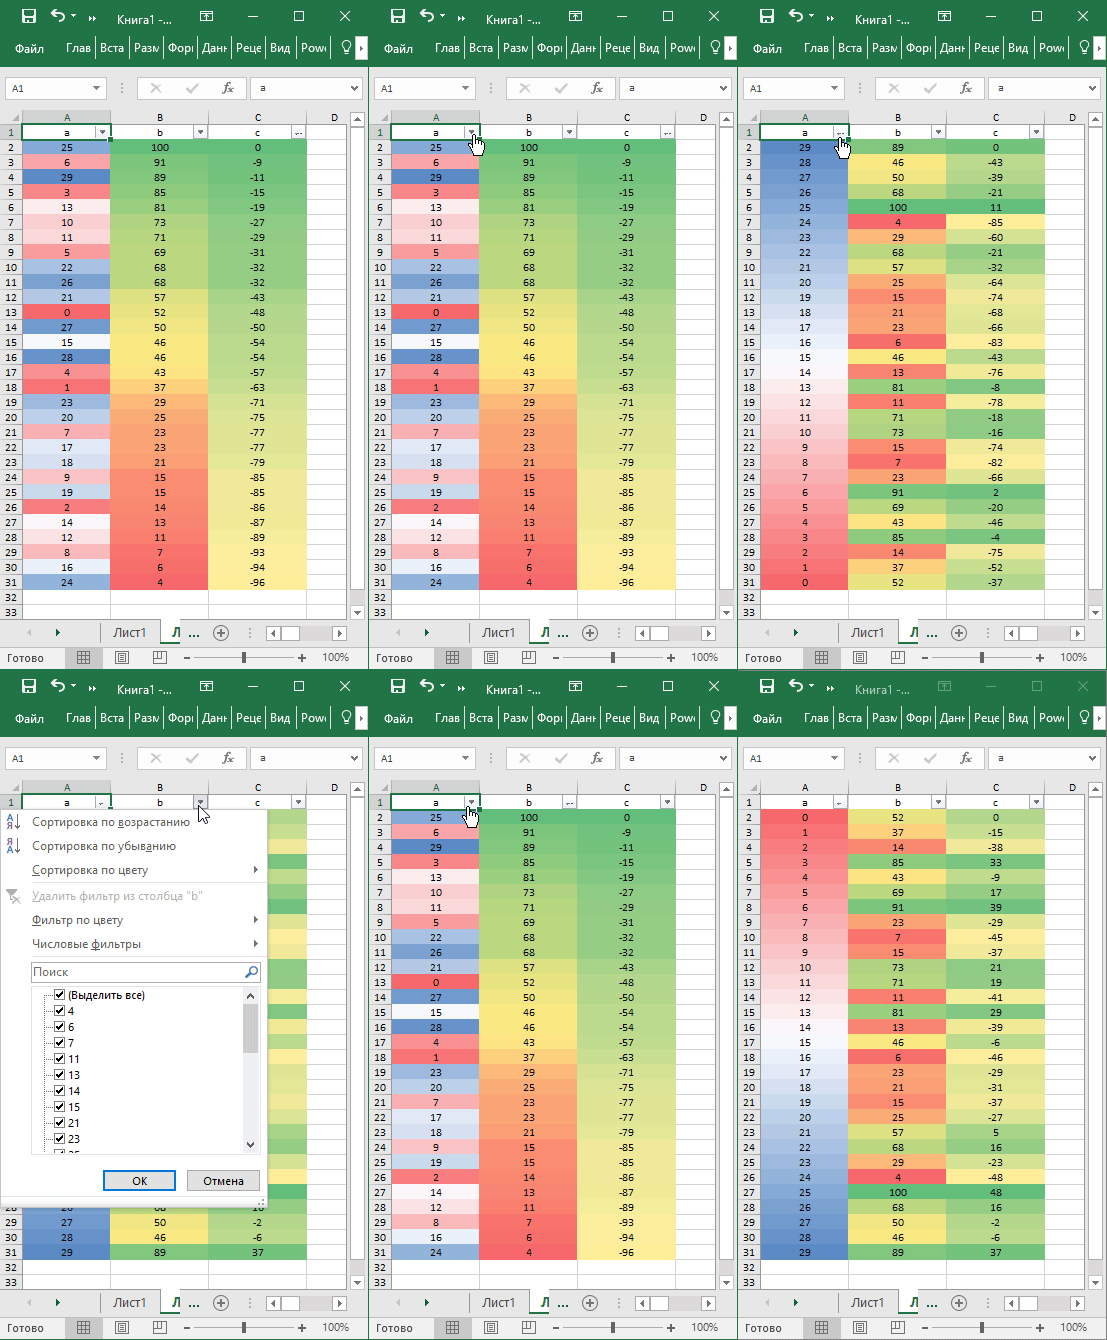
Fig. 11. Color scales in Excel
Such formatting makes it possible to quickly perform visual data analysis.
Let's make small changes and additions to the MQL application considered above. To set a unique color for each table cell, disable zebra-style formatting. Comment out this code string.
// m_table.IsZebraFormatRows(clrWhiteSmoke);
Now, let's create the CProgram::SetColorsToTable() method for table formatting. The CColors class is to be used for working with color. It is already present in the library for creating GUIs, therefore there is no need to include the file in the project. Declare two arrays for work: (1) array for obtaining gradient colors and (2) array of colors the gradient is to be formed from. We are going to create the three-color gradient. The lower the value, the more red the color becomes (clrTomato). The higher the value, the more blue it becomes (clrCornflowerBlue). Let's add the white color to separate these two color zones.
Define the size of the value ranges from the minimum to the maximum one. This will be the size of the gradient array. The CColors::Gradient() method is used to set the array size and fill it in. Colors of table cells are set in the final loop. In order not to get out of the array range, the index is calculated as the cell value minus the range minimum value. At the end of the method, the table is updated to display the implemented changes.
class CProgram : public CWndCreate
  {
private:
   //--- Filling the table with background color for cells
   void              SetColorsToTable(void);
  };
//+------------------------------------------------------------------+
//| Formatting the table                                             |
//+------------------------------------------------------------------+
void CProgram::SetColorsToTable(void)
  {
//--- For working with color
   CColors clr;
//--- Array for receiving the gradient
   color out_colors[];
//--- Three-color gradient
   color colors[3]={clrTomato,clrWhite,clrCornflowerBlue};
//--- Find the lowest and highest table values
   double max =0;
   double min =100;
   for(uint c=1; c<(uint)m_table.ColumnsTotal(); c++)
     {
      for(uint r=0; r<(uint)m_table.RowsTotal(); r++)
        {
         max =::fmax(max,(double)m_table.GetValue(c,r));
         min =::fmin(min,(double)m_table.GetValue(c,r));
        }
     }
//--- Correct to the nearest integer below
   max =::floor(max);
   min =::floor(min);
//--- Get the range
   int range =int(max-min)+1;
//--- Get the gradient array of colors
   clr.Gradient(colors,out_colors,range);
//--- Set the background color for cells
   for(uint c=1; c<(uint)m_table.ColumnsTotal(); c++)
     {
      for(uint r=0; r<(uint)m_table.RowsTotal(); r++)
        {
         int index=(int)m_table.GetValue(c,r)-(int)min;
         m_table.BackColor(c,r,out_colors[index],true);
        }
     }
//--- Update the table
   m_table.Update();
  }
Below you can see how this looks in the GUI. In this case, the results show that the lesser the value, the lesser the number of trends in the considered area. It would be wise to set as wide range of dates as possible in order to obtain information using as much data as possible.
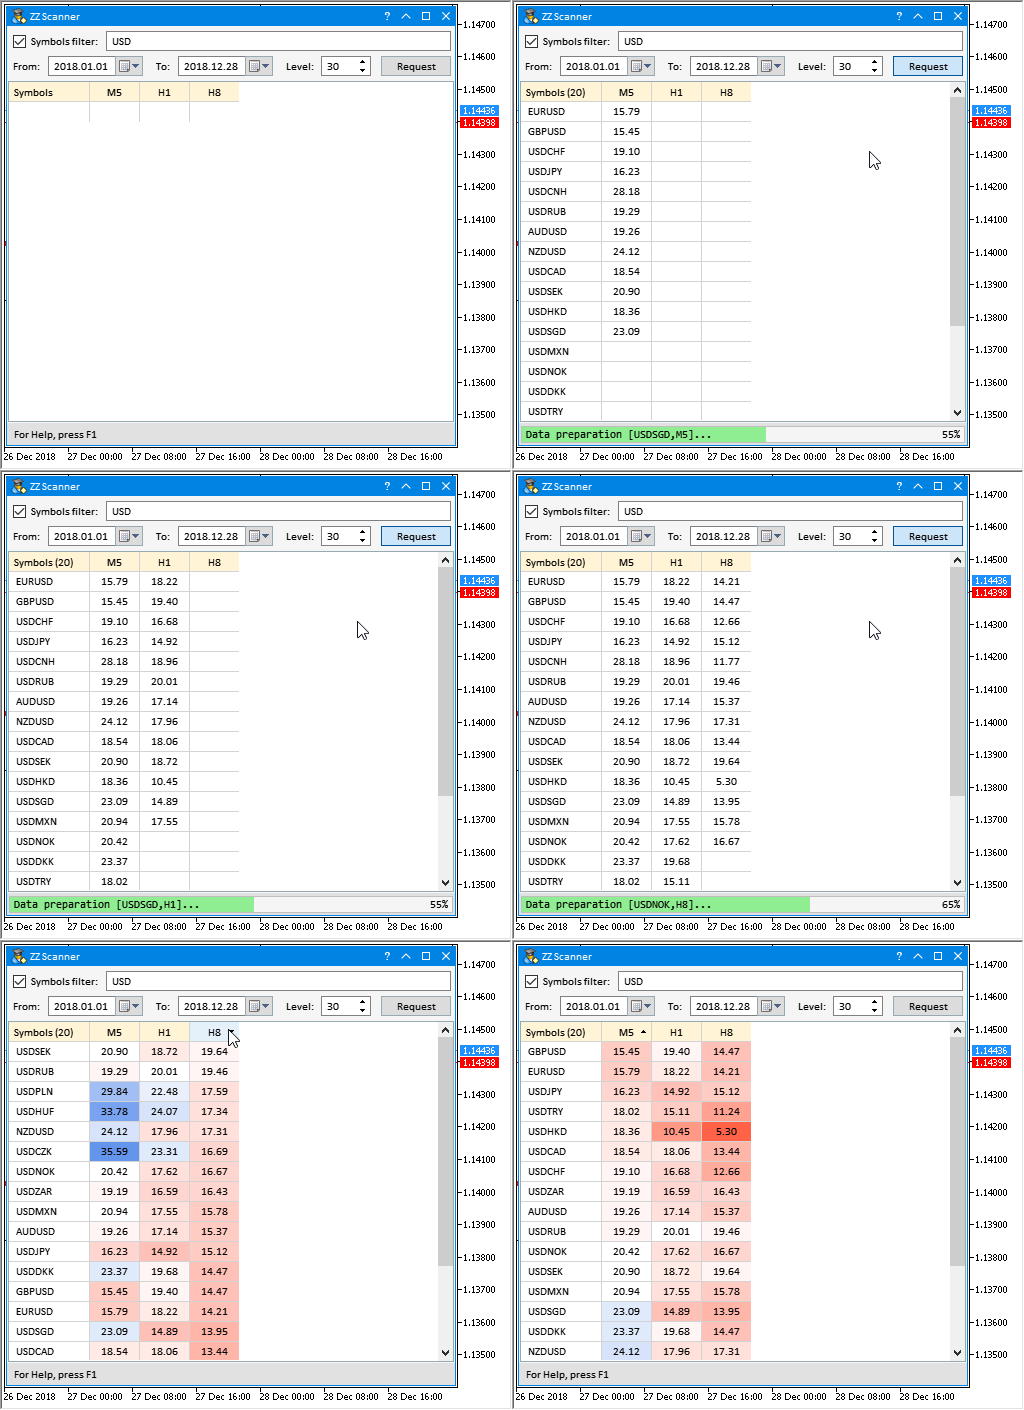
Fig. 12. Color scale for visualizing table data
The wider the range of dates, the more data are used and, accordingly, the more time it will take to generate data and calculate the parameters. If there is not enough data, an attempt is made to download them from the server.
Counting the number of segments by size
Now, let's develop a program for counting the number of segments by their size. Copy the EA from the previous section and make the necessary changes and additions to it. There will be two tables here. The first one is to use only one column with the list of analyzed symbols. The second one uses two data columns: (1) increasing ranges in points and (2) the number of segments by ranges in the first column. Below you can see how the GUI looks right after the application is uploaded on the chart.

Fig. 13. Program for calculating the number of segments by size
The Request button requests the symbol list by a specified filter. When clicking Calculate, data from the specified time range are collected and distributed in the second table.
Basically, all the methods have remained the same as in the previous EA, so let's consider only the things related to the second table. First, we need to receive the indicator data. This is done in the CProgram::GetIndicatorData() method. Initially, we connect to the ZigZag indicator and then get its data in the specified time range. Symbol, timeframe and the number of obtained indicator segments are displayed in the status bar.
class CProgram : public CWndCreate
  {
private:
   //--- Get the indicator data
   void              GetIndicatorData(const string symbol,const ENUM_TIMEFRAMES period);
  };
//+------------------------------------------------------------------+
//| Get the indicator data                                           |
//+------------------------------------------------------------------+
void CProgram::GetIndicatorData(const string symbol,const ENUM_TIMEFRAMES period)
  {
//--- Get the indicator handle
   string path   ="::Indicators\\Custom\\ZigZag\\ExactZZ_Plus.ex5";
   int    handle =::iCustom(symbol,period,path,0,0);
   if(handle!=INVALID_HANDLE)
     {
      //--- Copy data in the specified range
      datetime start_time =m_from_date.SelectedDate();
      datetime end_time   =m_to_date.SelectedDate();
      m_zz.GetZigZagData(handle,2,3,symbol,period,start_time,end_time);
      //--- Display data in the status bar
      string text="["+symbol+","+(string)GetPeriodName(period)+"] - Segments total: "+(string)m_zz.SegmentsTotal();
      m_status_bar.SetValue(0,text);
      m_status_bar.GetItemPointer(0).Update(true);
     }
//--- Release the indicator
   ::IndicatorRelease(handle);
  }
Price ranges with a specified step should be calculated for the first column. The CProgram::GetLevels() method is used for that. To define the number of ranges, we should first obtain the maximum segment size in the obtained data set. Next, fill the array with levels using a specified step in a loop till the maximum value is reached.
class CProgram : public CWndCreate
  {
private:
   //--- Range array
   int               m_levels_array[];
   //---
private:
   //--- Get the levels
   void              GetLevels(void);
  };
//+------------------------------------------------------------------+
//| Get the levels                                                   |
//+------------------------------------------------------------------+
void CProgram::GetLevels(void)
  {
//--- Release the array
   ::ArrayFree(m_levels_array);
//--- Get the maximum segment size
   int max_value=int(m_zz.LargestSegment()/m_symbol.Point());
//--- Fill in the array with levels
   int counter_levels=0;
   while(true)
     {
      int size=::ArraySize(m_levels_array);
      ::ArrayResize(m_levels_array,size+1);
      m_levels_array[size]=counter_levels;
      //---
      if(counter_levels>max_value)
         break;
      //---
      counter_levels+=(int)m_step.GetValue();
     }
  }
The CProgram::SetDataToTable2() method is used to fill in the second table with data. At the very beginning, the check is performed on whether the symbol is highlighted in the first table list. If it is not, the program exits the method sending the message to the experts log. If a row in the first table is highlighted, define the symbol and get data on it. After that, the methods described above are called for receiving the indicator data and calculating the levels. We receive the indicator data with the same timeframe the EA is launched on.
When we know the number of levels, we are able to build a table of the required size and fill it with values. First, fill in the first column with range values. After that, fill in the second column. By sequentially moving through all the ranges, increase the counter in cells for the segments fitting in this range.
class CProgram : public CWndCreate
  {
private:
   //--- Fill in the table 2 with data
   void              SetDataToTable2(void);
  };
//+------------------------------------------------------------------+
//| Fill in the table 2 with data                                    |
//+------------------------------------------------------------------+
void CProgram::SetDataToTable2(void)
  {
//--- Exit if the row is not highlighted
   if(m_table1.SelectedItem()==WRONG_VALUE)
     {
      ::Print(__FUNCTION__," > Select a symbol in the table on the left!");
      return;
     }
//--- Progress start
   StartProgress();
//--- Hide the table
   m_table2.Hide();
//--- Get the symbol from the first table
   string symbol=m_table1.GetValue(0,m_table1.SelectedItem());
   m_symbol.Name(symbol);
//--- Get the indicator data
   GetIndicatorData(symbol,_Period);
//--- Get the levels
   GetLevels();
//--- Re-build the table
   RebuildingTable2();
//--- Set ranges in the first column
   for(uint r=0; r<(uint)m_table2.RowsTotal(); r++)
      m_table2.SetValue(0,r,(string)m_levels_array[r],0);
//--- Get values for the second column
   int items_total=::ArraySize(m_levels_array);
   int segments_total=m_zz.SegmentsTotal();
   for(int i=0; i<items_total-1; i++)
     {
      //--- Progress
      m_progress_bar.LabelText("Get data ["+(string)m_levels_array[i]+"]...");
      m_progress_bar.Update(i,m_table2.RowsTotal());
      //---
      for(int s=0; s<segments_total; s++)
        {
         int size=int(m_zz.SegmentSize(s)/m_symbol.Point());
         if(size>m_levels_array[i] && size<m_levels_array[i+1])
           {
            int value=(int)m_table2.GetValue(1,i)+1;
            m_table2.SetValue(1,i,(string)value,0);
           }
        }
     }
//--- Show the table
   m_table2.Update(true);
//--- End the progress
   EndProgress();
  }
As an example, let's receive segments for EURUSD since 2010 up to present on M5 chart. Set ranges with the step of 100 five-digit points. The result is shown on the below screenshot.
The total number of segments is 302145. As we can see, the maximum number of segments is within the range of zero to 100. Further on, the number of segments is decreased from level to level. Within the specified time period, the maximum segment size reached 2400 five-digit points.

Fig. 14. Result of calculating the number of segments by size
Counting the number of segments by duration
It would also be good to know the duration of segments in the formed groups. To find any patterns, we need to have all the statistics on the analyzed data. Let's develop another EA version. Simply copy the program from the previous section and add another table to the GUI. The table is to feature two columns: (1) number of bars and (2) number of segments with that number of bars. Below you can see how the GUI looks right after the application is uploaded on the chart.

Fig. 15. Program for calculating the number of segments by duration
The sequence of actions for receiving data in all the tables is to be as follows:
- Click Request to receive the symbol list.
- Select a symbol highlighting a row in the first table.
- Click Calculate to receive data for the second table.
- To receive data for the third one, select the necessary range highlighting a row in the second table.
The listing below provides the code of the CProgram::SetDataToTable3() method for receiving data and filling the third table. The highlighted row here is used to receive the range, within which the number of segments is to be calculated by their duration. The number of rows in the table is defined by the longest (in bars) segment out of the obtained data set. When filling in the second column of the table, move through all the rows and count the segments fitting the selected range and number of bars by size.
class CProgram : public CWndCreate
  {
private:
   //--- Fill in the table 3 with data
   void              SetDataToTable3(void);
  };
//+------------------------------------------------------------------+
//| Fill in the table 3 with data                                    |
//+------------------------------------------------------------------+
void CProgram::SetDataToTable3(void)
  {
//--- Exit if the row is not highlighted
   if(m_table2.SelectedItem()==WRONG_VALUE)
     {
      ::Print(__FUNCTION__," > Select a range in the table on the left!");
      return;
     }
//--- Progress start
   StartProgress();
//--- Hide the table
   m_table3.Hide();
//--- Get the highlighted row
   int selected_row_index=m_table2.SelectedItem();
//--- Range
   int selected_range=(int)m_table2.GetValue(0,selected_row_index);
//--- Re-build the table
   RebuildingTable3();
//--- Set the values to the first column
   for(uint r=0; r<(uint)m_table3.RowsTotal(); r++)
      m_table3.SetValue(0,r,(string)(r+1),0);
//--- Get the values for the second column
   int segments_total=m_zz.SegmentsTotal();
   for(uint r=0; r<(uint)m_table3.RowsTotal(); r++)
     {
      //--- Progress
      m_progress_bar.LabelText("Get data ["+(string)r+"]...");
      m_progress_bar.Update(r,m_table3.RowsTotal());
      //---
      for(int s=0; s<segments_total; s++)
        {
         int size =int(m_zz.SegmentSize(s)/m_symbol.Point());
         int bars =m_zz.SegmentBars(s);
         //---
         if(size>selected_range &&
            size<selected_range+(int)m_step.GetValue() &&
            bars==r+1)
           {
            int value=(int)m_table3.GetValue(1,r)+1;
            m_table3.SetValue(1,r,(string)value,0);
           }
        }
     }
//--- Display the table
   m_table3.Update(true);
//--- Progress end
   EndProgress();
  }
When highlighting table and list rows, the ON_CLICK_LIST_ITEM custom event is generated. In this case, we track the arrival of the event with the second table's ID.
//+------------------------------------------------------------------+
//| Event handler                                                    |
//+------------------------------------------------------------------+
void CProgram::OnEvent(const int id,const long &lparam,const double &dparam,const string &sparam)
  {
...
//--- Events of clicking the rows
   if(id==CHARTEVENT_CUSTOM+ON_CLICK_LIST_ITEM)
     {
      //--- Table row clicked
      if(lparam==m_table2.Id())
        {
         //--- Get data for the third table
         SetDataToTable3();
         return;
        }
      //---
      return;
     }
...
  }
When receiving a new list of symbols or calculating data on the new highlighted symbol in the first table, irrelevant data from previous calculations should be cleared out of the tables to avoid confusion about what data are currently displayed.
//+------------------------------------------------------------------+
//| Event handler                                                    |
//+------------------------------------------------------------------+
void CProgram::OnEvent(const int id,const long &lparam,const double &dparam,const string &sparam)
  {
//--- Event of clicking the buttons
   if(id==CHARTEVENT_CUSTOM+ON_CLICK_BUTTON)
     {
      //--- Request button clicked
      if(lparam==m_request.Id())
        {
         //--- Get data for the first table
         SetDataToTable1();
         //--- Delete irrelevant data from the tables
         m_table2.DeleteAllRows(true);
         m_table3.DeleteAllRows(true);
         return;
        }
      //--- Calculate button clicked
      if(lparam==m_calculate.Id())
        {
         //--- Get data for the second table
         SetDataToTable2();
         //--- Delete irrelevant data from the tables
         m_table3.DeleteAllRows(true);
        }
      //---
      return;
     }
...
  }
After launching the EA on the chart, we obtain the result as shown below. In this case, we formed the list of currency pairs featuring USD. Data on GBPUSD from the beginning of 2018 were received afterwards and the range list (second table) was formed with the step of 100 and calculated segments for each of them. As an example, the row with the range of 200 and the number of segments of 1922 (from 200 to 300) is highlighted in the second table. The third table displays duration of all segments from the range highlighted in the second table. For example, we can see that only 11 segments with the duration of 10 bars from the specified range were present on GBPUSD during this period.

Fig. 16. Result of calculating the number of segments by duration
Some details of working with the graphical interface
As a supplement, I would like to show how to properly handle the event of changing a chart symbol and timeframe when a GUI is used in an MQL program. Since GUIs may contain multiple various controls, it may take some time to upload and initialize the entire set. Sometimes, this time can be saved, which is exactly the case with changing a chart symbol and timeframe. Here, there is no need to constantly remove and create a GUI over and over again.
This can be achieved as follows:
Create a field for storing the last reason for the program deinitialization in the main class of the program:
class CProgram : public CWndCreate
  {
private:
   //--- Last reason for deinitialization
   int               m_last_deinit_reason;
  };
//+------------------------------------------------------------------+
//| Constructor                                                      |
//+------------------------------------------------------------------+
CProgram::CProgram(void) : m_last_deinit_reason(WRONG_VALUE)
  {
  }
During the deinitialization, the GUI is removed in all cases, except for the ones where the reason is REASON_CHARTCHANGE.
//+------------------------------------------------------------------+
//| Deinitialization                                                 |
//+------------------------------------------------------------------+
void CProgram::OnDeinitEvent(const int reason)
  {
//--- Remember the last deinitialization reason
   m_last_deinit_reason=reason;
//--- Remove GUI if the reason is not related to changing a symbol and a period
   if(reason!=REASON_CHARTCHANGE)
     {
      CWndEvents::Destroy();
     }
  }
Since the GUI is created when initializing the program by calling the CProgram::CreateGUI() method, it is now sufficient to check the last cause of deinitialization. If the reason is that a symbol or timeframe has been changed, then there is no need to create a GUI. Instead, simply exit the method notifying that all is well.
//+------------------------------------------------------------------+
//| Create a GUI                                                     |
//+------------------------------------------------------------------+
bool CProgram::CreateGUI(void)
  {
//--- Exit if a chart or timeframe has been changed
   if(m_last_deinit_reason==REASON_CHARTCHANGE)
      return(true);
...
   return(true);
  }
Conclusion
The idea that ZigZag is not suitable for generating trading signals is widely spread on trading forums. This is a big misconception. In fact, no other indicator provides so much information to determine the nature of the price behavior. Now you have a tool allowing you to easily obtain all the necessary ZigZag indicator data for a more detailed analysis.
In the next part, I am going to show what other data can be obtained using the tools developed in these articles.
| File name | Comment |
|---|---|
| MQL5\Indicators\Custom\ZigZag\FrequencyChangeZZ.mq5 | Indicator for calculating the frequency of oppositely directed ZigZag indicator segments formation |
| MQL5\Indicators\Custom\ZigZag\SumSegmentsZZ.mq5 | Indicator for calculating the sum of segments from the obtained set and their average value |
| MQL5\Indicators\Custom\ZigZag\PercentageSegmentsZZ.mq5 | Indicator of the percentage ratio of segment sums and the difference between them |
| MQL5\Indicators\Custom\ZigZag\MultiPercentageSegmentsZZ.mq5 | Indicator for defining the nature of the formation of several segments from a higher timeframe using the difference between percentage ratios of the oppositely directed segment sums |
| MQL5\Experts\ZigZag\TestZZ_05.mq5 | EA for testing the MultiPercentageSegmentsZZ indicator |
| MQL5\Experts\ZigZag\ZZ_Scanner_01.mq5 | EA for collecting statistics on the PercentageSegmentsZZ indicator |
| MQL5\Experts\ZigZag\ZZ_Scanner_02.mq5 | EA for calculating segments in different price ranges |
| MQL5\Experts\ZigZag\ZZ_Scanner_03.mq5 | EA for calculating segments located in different price ranges and having different duration |