Tester Chart and Data Window Values not matching
Yes the tester draws indicators automatically.
Your screenshot shows that the values match.
Thank you for the reply, I realize I wasn't very clear. My issue isnt the values themselves, they do show the correct number whilst highlighting the lines, its that the lines are not drawn with respect to their numbers. The yellow line has a current value of 40.45xx, while the line drawn above it (MA2, highlighted green in the data window), has a current value of 39.54xx, which to me, would mean it should be drawn below the yellow one. To be honest the bottom line should have 2 lines below it, the RSI21 is also under number wise, but being drawn way over. And I havent even mentioned that the chart has the 30-70 horizontal lines and where the marked yellow line with a value of 40.45 is under then 30 horizontal.
Thank you for the reply, I realize I wasn't very clear. My issue isnt the values themselves, they do show the correct number whilst highlighting the lines, its that the lines are not drawn with respect to their numbers. The yellow line has a current value of 40.45xx, while the line drawn above it (MA2, highlighted green in the data window), has a current value of 39.54xx, which to me, would mean it should be drawn below the yellow one. To be honest the bottom line should have 2 lines below it, the RSI21 is also under number wise, but being drawn way over. And I havent even mentioned that the chart has the 30-70 horizontal lines and where the marked yellow line with a value of 40.45 is under then 30 horizontal.
Ok I see what you mean. This is a scale issue, the indicators are all displayed in the same window but they have different scales. So they can't really be compared.
You would need to use a fixed scale, the same for the 4 indicators. Unfortunately I am not sure this is doable within the Visual Tester.
In summary all is normal for the values, but the display is confusing due to the different scales.
Thank you for the reply! I was starting to think the same thing, like each plot has its own y-axis. If its not possible to set scale in the tester window, can I make it do the right thing in the normal window? The normal window currently only plots the RSI itself, it doesn't add the other ones. Can I tell it do add the MA's via code or would I have to manually recreate the MA's on the chart myself?
You can use ChartIndicatorAdd() to add them by code.
Or you can use a template too. Depends of your exact needs.
Thanks for the reply! I'm messing with it but its not doing what I want. I can fix the y axis to 0-100 fine, but it doesn't effect how the lines are scaled, they still draw like the picture above. All I'm after is the lines drawing in relation to each other, is there a post/code/link somewhere that gives an example I can follow?
Thanks again!
Thank you for the reply!
Man I have been around and around looking for people controlling subwindows in an EA and setting scales. From what I can tell its not possible. All the CHART_SCALE_xx options work on the window which my understanding is the main price action chart. I don't see how to specify which subwindow/chart to apply the scaling to unless your in a custom indicator. But custom indicators dont seem to be able to just run existing ones like I do in the EA. So I'm immensely stuck currently trying to make a useful EA.
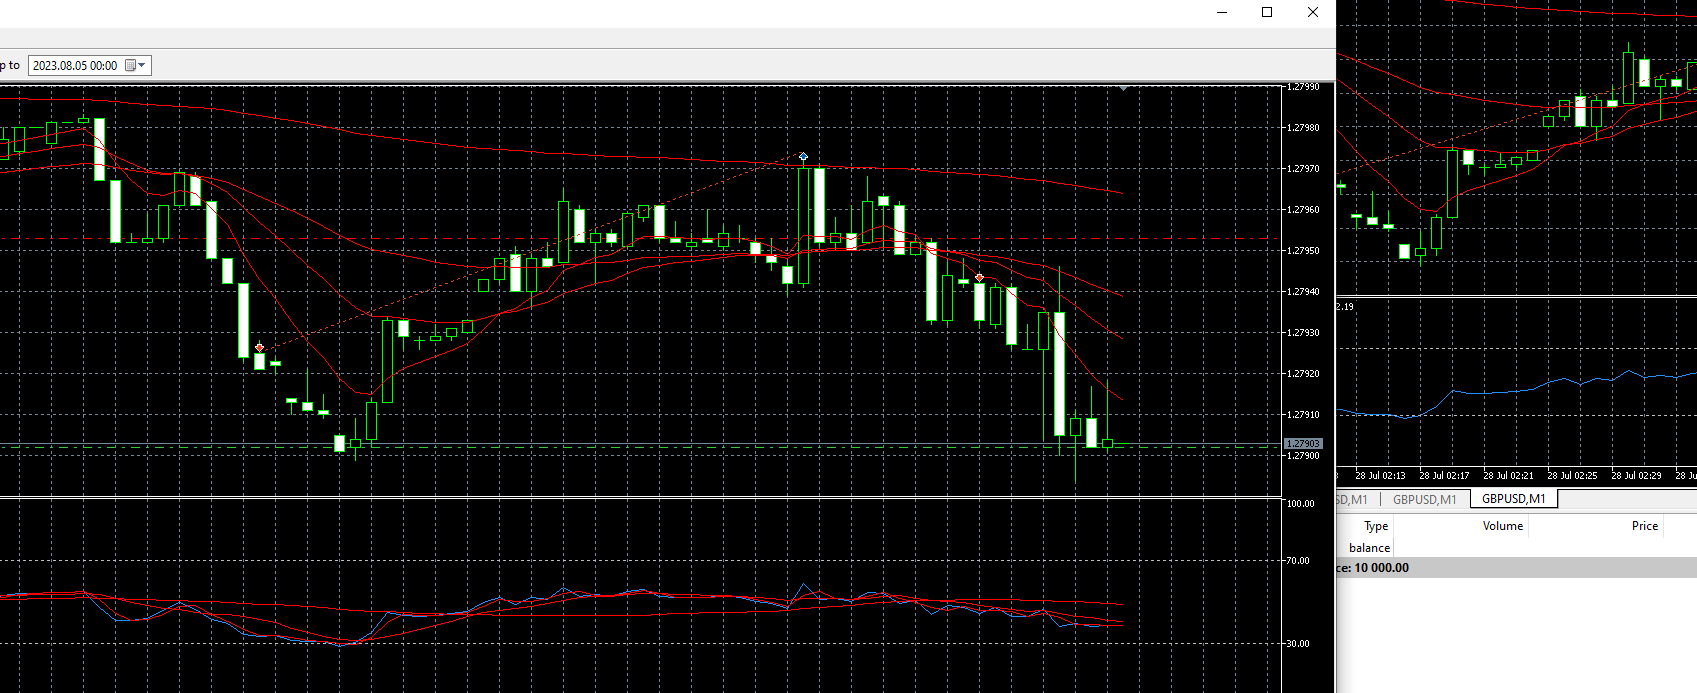
Also interesting is that the extra MA's show up in the tester, but not in the main MT5 window, there only the RSI renders.Interesting behavior I've noticed. I still cant get the MA's to show up in the main MT5 (see pic, mt5's on the right), but while the EA is running, the scale in the tester is correct! Its only when it finishes that it goes nuts and becomes unusable.
My current onInit:
int OnInit()
{

   InitLogger("EMAPullBack", LOG_LEVEL_DEBUG, LOG_LEVEL_DEBUG);

   // populate our handles
   emaShortHandle = iMA(_Symbol, _Period, EmaShortTf, 0, MODE_EMA, PRICE_CLOSE);
   emaMedHandle   = iMA(_Symbol, _Period, EmaMedTf, 0, MODE_EMA, PRICE_CLOSE);
   emaLongHandle  = iMA(_Symbol, _Period, EmaLongTf, 0, MODE_EMA, PRICE_CLOSE);
   emaUberHandle  = iMA(_Symbol, _Period, EmaUberTf, 0, MODE_EMA, PRICE_CLOSE);
   rsiHandle      = iRSI(_Symbol, _Period, RSIPeriod,PRICE_CLOSE);
   rsiFastMaHandle= iMA(_Symbol, _Period, RSIFastMa, 0, MODE_SMA, rsiHandle);
   rsiSlowMaHandle= iMA(_Symbol, _Period, RSISlowMa, 0, MODE_SMA, rsiHandle);
   rsiUberMaHandle= iMA(_Symbol, _Period, RSIUberMa, 0, MODE_SMA, rsiHandle);

   // set buffers to timeseries sorted
   ArraySetAsSeries(emaShortBuff, true);
   ArraySetAsSeries(emaMedBuff, true);
   ArraySetAsSeries(emaLongBuff, true);
   ArraySetAsSeries(emaUberBuff, true);
   ArraySetAsSeries(rsiBuff, true);
   ArraySetAsSeries(rsiFastBuff, true);
   ArraySetAsSeries(rsiSlowBuff, true);
   ArraySetAsSeries(rsiUberBuff, true);

   int subWindow = ChartGetInteger(0, CHART_WINDOWS_TOTAL);
   Alert("Chart window total: ", subWindow);
   // add the MA's to the chart
  // Doesn't show up
   if (!ChartIndicatorAdd(0, subWindow, rsiFastMaHandle))
   {
      LOG(LOG_LEVEL_ERROR, "Unable to add indicator to chart ");
   }
  // Doesn't show up
   if (!ChartIndicatorAdd(0, subWindow, rsiSlowMaHandle))
   {
      LOG(LOG_LEVEL_ERROR, "Unable to add indicator to chart ");
   }
  // Doesn't show up
   if (!ChartIndicatorAdd(0, subWindow, rsiUberMaHandle))
   {
      LOG(LOG_LEVEL_ERROR, "Unable to add indicator to chart ");
   }


   return(INIT_SUCCEEDED);
}
I've tried various values for the chart_id and subWindow, but like I said above, I'm not sure how to get the subWindow ID for the RSI itself when inside an EA and not a custom indicator. To be clear, I don't know how to query for the window that holds the RSI, I can just call CHART_WINDOW_TOTAL, but that doesnt seem right.
- Free trading apps
- Over 8,000 signals for copying
- Economic news for exploring financial markets
You agree to website policy and terms of use
All,
I have a simple EA that I'm working on which is generating an RSI, then some MA's (2,7,34) on top of the RSI.
I personally don't tell it to chart anything, but it seems to create and draw anything I make a handle to automatically. The problem is the chart its drawing, and the values in the data window don't line up. See Attached chart.
My mouse is where the yellow arrow is, showing the value of line MA7 40.45xx. Whats weird is that the line is BELOW MA2, which is currently at 39.54xx. This makes visual inspection impossible because I'm looking for MA2 to be above/below MA7!
Any ideas why this is?
Thank you.