Смотри обучающее видео по маркету на YouTube
Как купить торгового робота или индикатор
Запусти робота на
виртуальном хостинге
виртуальном хостинге
Протестируй индикатор/робота перед покупкой
Хочешь зарабатывать в Маркете?
Как подать продукт, чтобы его покупали
Технические индикаторы для MetaTrader 4 - 39

This indicator determines minimum volumes needed during a candle formed so that it would be higher than current volume's average. Although you can place MAs on your volume indicator, this indicator has non-repaint characteristic so you may not to worry about sudden volume increase. This indiator also draw volume indicator for its own. Input Description: period: Period used for indicator. Must be higher than 1. Output Description: VolumeXover: This indicator's main feature. During the time the vo
FREE

Indicator support for only: Entry Point to Trend Pro Link indicator support : https://www.mql5.com/en/market/product/70867
Supports all currency pairs declared in the definition. Help investors do not need to open many charts. Notice the DEAL: multiple time frames confluence M15, H1, H4.
Entry Point to Trend Pro The indicator helps investors to identify the earliest and perfect reversal point. Easy to make decision to trade with the trend Price action trading. support resistance
FREE

This indicator is an utility for have always under control, how much time is left at the end of the bar setted.
The utility show on the lower right of the chart, the countdown to the end.
When the remaining seconds is = to the seconds set in the input, the color of remaining seconds on chart, change color and play a warning sound to warn you that the bar is about the end. When the remaining seconds is < to the seconds set in the input, the utility play a beep to warn you that the bar is in
FREE
This indicator gives the highest and lowest information of the currency you have selected and the day you selected. It also shows the average. In this way, you can find out the profit / loss probability of your transactions for the same days. Reported: Average points per week Average points per year Lifetime average points Note: It does not provide you with buy / sell signals. Shows average points only
FREE
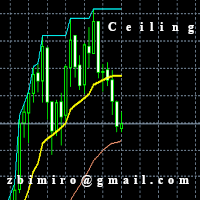
The "Ceiling MT4" indicator has been designed to determine the exit point from the market and it is based on a moving average set in parameters and shows 3 lines. 1. Ceiling lines, that is the highest / lowest value currently achieved on the chart in the horizon set in the "Plafon Horyzon" parameter. 2. The "Signal" line that shows the line shifted to the part specified in the "Signal_Part" parameter is set by default to 2, which means that it is halfway between the moving average and the plafon
FREE

The indicator still has a few bugs but is ready for testing.
This is my first indicator that determines entry and exit points. The entry point is based on breaking the peaks determined by a channel indicating highs and lows (invisible channels). TP1 is a probable target at which most positions can be closed. The channel determining the opening and closing of positions is based on different assumptions. The red stop loss line is determined based on lows and highs.
The stop loss can be adjusted
FREE

Технический Индикатор Ускорения/Замедления (Acceleration/Deceleration, Accelerator/Decelerator Oscillator, AC) измеряет ускорение и замедление текущей движущей силы. Этот индикатор будет изменять направление перед изменением движущей силы, а она в свою очередь будет изменять свое направление перед изменением цены. Понимание того, что АС является более ранним предупреждающим сигналом, дает очевидные преимущества. Но классический индикатор AC не имеет входных параметров. В исходном коде можно увид
FREE
The Ergodic is an oscillator based on William Blau's True Strength Index, which is based on Momentum to which double smoothing has been applied. 100* EMA(EMA(Momentum) / EMA(EMA( |Momentum|)) The Ergodic adds a moving average to the TSI which will act as a Signal Line. This oscillator can be used to identify trend reversal zones, or trend continuation phases.
VERY USEFUL WHEN USED IN CONJUNCTION WITH THE CURRENCY INDEX.
L' Ergodic è un oscillatore basato sul True Strenght Index di William B
FREE

(перевод Google) Этот индикатор реализует оригинальный " Average True True Range (ATR) ", разработанный Джоном Уэллсом Уайлдером-младшим , как описано в его книге: Новые концепции в технических системах торговли[1978] . Он использует скользящее среднее Уайлдера , также известное как сглаженное скользящее среднее (SMMA) , вместо простого скользящего среднего (SMA) . как используется во встроенном в MetaTrader индикаторе ATR . По умолчанию применяется период 7 вместо 14, как описано в его книге. (
FREE

Это авторская торговая система. Предназначен для внутридневной торговли. Сигналы не переписываются . Подойдет для любого инструмента и таймфрейма. Можно включить оповещения. Легок в использовании. Смотри скриншоты. Подпишись на мой telegram канал, ссылка в контактах моего профиля . Простые настройки! Все уже сделано для вас! Основа - это анализ текущего тренда. Индикатор ищет выход из накопления. Если ты давно ищешь хорошую торговую систему, то она перед тобой!
FREE

This indicator will mirror the assets in use in another metatrader, being able to choose the timeframe and a template. This is the Metatrader 4 Client, it needs the Metatrader 4 or 5 Server versions: Metatrader 4 Mirror Chart Server: https://www.mql5.com/en/market/product/88644
Metatrader 5 Mirror Chart Server: https://www.mql5.com/en/market/product/88652 Details of how it works in the video.
FREE

Time to Trade Trading timing indicator is based on market volatility through 2 ATR indicators to determine the timing of a transaction. The indicator determines the times when the market has strong volatility in trend. When histogram is greater than 0 (blue) is a strong market, when histogram is less than 0 (yellow) is a weak market. Should only trade within histograms greater than 0. Based on the histogram chart, the first histogram value is greater than 0 and the second histogram appears, this
FREE

This indicator calculates average speed of moving average indicator. Here is parameters: BarsToProcess - indicator calculating period; MaPeriod - period of Moving Average indicator; AveragingPeriod - period (MA values) of the basis of which the average value is calculated; MA_Method, MA_Apply_to - using to set MA indicator parameters; Thats all! Good luck.
FREE
"Visual Range - Spread Indicator". This Indicator is an Essential Tool for Manual trading. it helps to avoid "off price" and "bad" entries caused by abnormally High spreads. ...................................................................................................................... At the Market Opening and News Reports - the Size of the Spread can go temporarily widely High. The Indicator shows the current Size of the Spread visually on the chart and its distance from the current pr
FREE

Introducing Force Jurik—a powerful indicator designed to enhance trading insights by combining custom moving averages based on Jurik with the MetaTrader 4 indicator, Force Index.
Jurik moving averages are renowned for their precision and smoothness, making them ideal for analyzing price movements in the forex market. They offer traders a reliable method of identifying trends and filtering out market noise, ultimately providing clearer signals for decision-making.
The Force Index, a popular
FREE

X-axis lines prevail in grid manner, ruled by Average True Range. There’s an inevitable change in specific periods of time of this matter! The Average True Range (ATR) indicator is not directly based on volume . Instead, it measures volatility in price movements. It’ll stretch, expand, shrink, and evolve with 4 timely choices of grid states! MATR means “multiplying average true range” in which grandeurs the grid pip-distant levels, seeming to grasp a wave of perfectly synched par
FREE

Trend Panel Limited is an indicator that allows you to know the trend of a pair in a given timeframe using 2 moving averages. You can modify the period of the moving averages. Allows you to select which pairs you want to monitor in the input parameters. You also decide in what time period you want to follow up. In short, TrendPanel gives you the possibility of knowing the trend of a pair in a certain period of time without having to change the chart. Version limitations: You can only select 2 pa
FREE
Данный индикатор окрашивает свечи в соответствии с прогнозируемым ценовым движением.
Данный индикатор отображает на графике цены сигналы о пересечении ценой закрытия линии стандартной скользящей средней, а также об изменении скользящей средней своего направления. Индикатор на полностью сформированных свечах не перерисовывается. Свеча которая формируется может менять цвет, в зависимости от текущих данных. Таким образом для принятия решения следует дождаться завершения формирования свечи.
Наст
FREE

Представленный индикатор на новом уровне реализует идею, заложенную в классические индикаторы Bulls и Bears. Данный индикатор отображает разность максимальной и минимальной цен за текущий период времени и значений канала, построенного по максимальным и минимальным ценам, сглаженным по методу Лягерра. Рост значений индикатора выше нуля говорит о том, что максимальная цена за текущий период больше среднего значения максимальных цен. Такая ситуация в большинстве случаев говорит о росте стоимости ак
FREE

This indicator is based on the MACD indicator
Also, some candlestick patterns are used in it to identify better signals
Can be used in all symbols
Can be used in all time frames
Easy to use method
Adequate settings
Settings: period: The number of candles used to calculate signals. pFast: Like the MACD indicator settings pSlow: Like the MACD indicator settings
alarmShow: If you want to receive an alert in Metatrader after receiving the signal, enable this setting alarmShowNoti: If you
FREE
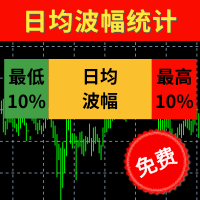
【最低10%】 统计过往100天蜡烛图的波幅并进行排序,最低10%的波幅以点数显示。 【日均波幅】 统计过往100天蜡烛图的平均波幅,并以点数显示。 【最高10%】 统计过往100天蜡烛图的波幅并进行排序,最高10%的波幅以点数显示。 【今日】 今日波幅以点数统计,箭头的位置是今日波幅相对于历史总体波幅的位置。越靠近左侧说明今日波幅越小,越有侧说明波幅越大。 波幅指标最适合用来审视当日距今为止波幅的大小,使用方法如下: 若今日时间尚早而且今日波幅尚较低,说明今日可能行情尚未启动,还有入场机会。 若今日时间尚早但今日波幅已经超过80%,说明今日趋势行情可能已经结束,接下的行情可能反弹。 若今日时间较晚,而且今日波幅已经超过60%,说明今日行情可能已经走完。 当日的止盈点位+当日已完成波幅最好不超过最高10%的波动点数。 当日的止损点位+当日已完成波幅最好超过最高10%的波动点数。 当然该指标是基于过往的100日数据进行统计,并不代表接下来今日的波幅一定不会创新低或者创新高,其作用是给日内交易者的入场时机和日内交易空间提出判断依据。 更多细节请看 http://www.sygdpx.co
FREE
Индикатор подает сигналы на открытие позиции. Принцип работы - сравнение текущей цены закрытия с диапазоном цен закрытия за больший период. Подтверждением сигнала считается преодоление ценой максимума/минимума бара на котором индикатор подал сигнал. Сопровождение открытой позиции ведется на меньшем TF. Сигналы индикатора на открытие противоположной позиции на меньшем TF являются сигналом к закрытию сделки. Индикатор не перерисовывается и не пересчитывается.
Сигналы при работе с индикатором:
FREE
Highly configurable Volume indicator.
Features: Highly customizable alert functions (at levels, crosses, direction changes via email, push, sound, popup) Multi timeframe ability Color customization (at levels, crosses, direction changes) Linear interpolation and histogram mode options Works on strategy tester in multi timeframe mode (at weekend without ticks also) Parameters:
Volume Timeframe: You can set the lower/higher timeframes for Volume. Volume Bar Shift: you can set the offset of th
FREE
Технический индикатор представляет собой более продвинутую версию индекса относительной силы (RSI), который применяет принципы конвергенции-дивергенции скользящей средней (MACD) к индикатору двойного сглаживания RSI (DS RSI). Индикатор выводится путем вычисления разницы между двойным сглаженным RSI и простой скользящей средней (SMA) DS RSI. Цель индикатора-обеспечить более точные сигналы на покупку и продажу, чем стандартный расчет RSI.
MACD получается путем вычитания 12-периодной экспоненциа
FREE
Представленный индикатор подает сигналы о выходе цены за пределы Keltner channel, а также о возращении цены в канал. Keltner channel — технический индикатор, состоящих из двух полос над и под скользящей средней ценового показателя, ширина которых определяется как доля от среднего изменения цены за период. Автором данной методики является Chester W. Keltner, опубликовавший её в своей книге How To Make Money in Commodities в 1960 году. Keltner channel подвергался широким исследованиям и модификац
FREE

Fast T3 MA Trend indicator derived from T3 moving averages. This indicator is part of the T3 Cloud MA indicator and is posted here on its own. Buying/Selling opportunities above/below line. The MA line can also be used as dynamic support/resistance for more aggressive entries. Use default values for best settings. The number of look back bars is user defined. This indicator can be used in combination with other strategies such as price action. Suitable for all time frames.
FREE

Introducing RSI Jurik—an innovative indicator designed to revolutionize your forex trading strategy by combining custom moving averages based on the Relative Strength Index (RSI) with the MetaTrader 4 indicator, RSI.
Jurik moving averages are renowned for their accuracy and reliability in analyzing price movements in the forex market. They provide traders with smoother representations of price action, reducing noise and offering clearer signals for identifying trends and potential reversals.
FREE

The indicator allows you to trade binary options. The recommended time frame is М1 and the expiration time is 1 minute. The indicator suitable for auto and manual trading. A possible signal is specified as a arrows above/under a candle. You should wait until the candle closes! Arrows are not re-painted Trade sessions: LONDON and NEWYORK section Currency pairs: GRB/USD Working time frame: M1 Expiration time: 1 minute. The indicator also shows good results when using the martingale strategy - "Mar
FREE

Volume Cross Over is an indicator that measure positive and negative volume flow in a financial instrument, such as a stock, commodity, or index. It is base on the idea of On-Balance Volume developed by Joseph Granville. However instead of trending lines, this indicator shows volume cross over. When the closing price of an asset is higher than the previous closing price, then the Bull volume is greater than zero and Bear volume is negative. It suggests that buying volume is dominating, a
FREE

Используется метод расчета канала Честера Кельтнера, модифицированный известным трейдером Линдой Рашке. За счет модификации рассчитанный канал вмещает в себя более полную картину совокупных ценовых движений, что позволяет повысить вероятность прогноза последующего движения цены. В отличие от классического метода Кельтнера, базовая линия канала строится на основе экспоненциальной скользящей средней, а для расчета верхней и нижней линий используется средний истинный интервал. В зависимости от пара
FREE

Индикатор отображает сетку в виде "пчелиных сот" или правильный шестиугольник. Альтернатива стандартной сетке торгового терминала. Описание настроек индикатора: color_comb - цвет сетки width - ширина, пример: 22 для экрана с разрешением 1920*1080, 15 для экрана с разрешением 1366*768 и т.д. height - высота, пример: 6 для экрана с разрешением 1920*1080, 4 для экрана с разрешением 1366*768 и т.д.
FREE
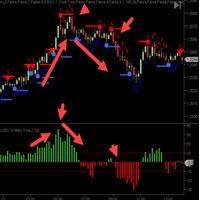
Индикатор значения силы закрытия CycleTraderPro измеряет расстояние от ОТКРЫТОГО нового бара до ЗАКРЫТИЯ этого бара. Вход - длина = 10 по умолчанию Мы добавляем эти значения вместе, возвращаясь к настройке длины. Если бы 1-й бар был плюс 10 тиков, а затем следующий бар был минус 7 тиков, то это зарегистрировало бы +3 Есть 2 способа торговать значением Close Strength: 1. Торгуйте в направлении более низких максимумов и более низких минимумов и наоборот для покупок, более высоких максимумов и боле
FREE

Индикатор MAtrio, отображает на любом таймфрейме сразу три скользящих средних с периодом 50 -дневная ,100 -дневная , 200 -дневная . После присоединения к графику сразу отображает три скользящих средних с параметрами простой (SMA) скользящей средней SmoothingType50 , простой (SMA) скользящей средней SmoothingType100, простой (SMA) скользящей средней SmoothingType200. Соответственно с типом цены ValuePrices50, ValuePrices100, ValuePrices200 по умолчанию везде стоит цена Close price .
FREE
Parabolic Sar easy mode, remake the original p.sar indicator making it more easy to read for novicians traders and experimented traders looking to reduce the time analizing the charts, you can make your own strategy modificating the periods and fusioning it with others indicators like RSI ,stochastic or what you want,its one indicator runs better on high time charts like H4 or D1.
FREE

Utility for show on charts the visual informations about: - a vertical line at start of each bar of selected timeframe - a vertical line at start of each day - a vertical line at start of each week - vertical lines at start / end of trading sessions selected - bid / ask prices, spread, money value for each point (of 1 standard lot) and last tick time recived" You can enable / disable each information and set the color for each line
FREE

Целью этой новой версии стандартного MT4 индикатора, входящего в поставку платформы, является отображение в подокне нескольких таймфреймах одного и того же индикатора. См. пример, приведенный на рисунке ниже. Однако индикатор отражается не как простой индикатор MTF. Это реальное отображение индикатора на его таймфрейме. Доступные настройки в индикаторе FFx: Выбор таймфрейма для отображения (от M1 до MN) Установка ширины (количество баров) для каждого окна таймфрейма Всплывающее оповещение/звуков
FREE

WONNFX create arrow tester. Сonstructor/Tester. Tester for buffer indicators. Converting a buffer indicator into an arrow signal on the chart. Combining two buffer indicators into one arrow signal. Filter by candle color. You can move the arrow signal several bars forward (useful in cases where the indicator gives signals 2-3 bars late
"WONNFX create arrow tester" is a tool designed specifically for traders who use buffer indicators in their trading strategies. This tester converts the buffer
FREE

ON Trade Pivots is A technical indicator that Draws all Pivot levels depending on time frame that defined in settings.
Notes It will be good tool for all traders who use pivot levels in their trades. Let me inform you that this indicator draw this level as buffers not as objects then you can connect it easily to EA. This indicator allow you to find pivots levels for any time frame not only daily you are free to choose time frame from settings.
Parameters Use_System_Visuals - Enable /Disable
FREE

Для текущего инструмента индикатор строит аффинный график, вычитая из цены трендовую составляющую. При запуске создает трендовую линию в главном окне. Расположите эту линию в нужном направлении. Индикатор перестроит аффинный график в соответствии с указанным трендом.
Входные параметры Maximum number of pictured bars - максимальное количество отображаемых баров; Trend line name - имя линии тренда; Trend line color - цвет линии тренда; Black candle color - цвет черной свечи; White candle color -
FREE

Описание Универсальный цветной мультивалютный/мультиинструментальный индикатор скользящих средних: Moving Average, Double Moving Average, Triple Moving Average . Индикатор строится в отдельном окне, что позволяет пользователю под основным торговым графиком увидеть развитие событий на другом финансовом инструменте. Очень полезен при рассмотрении разных скользящих средних при разных финансовых инструментах совместно под основным торговым графиком цен. Индикатор может быть использован у любого бро

A BB indicator with MA options
You're no longer limited to the built in default of using BB off a SMA method, now you can choose from SMA-EMA-SMMA-LWMA. You now also have up to 3 standard deviation levels, with price labels.
Options: - MTF - moving average type SMA-EMA-SMMA-LWMA - 3 adjustable deviation levels
- separate coloring to lines and texts
Troubleshooting: - If there are any issues or suggestions for the indicator, please comment and let me know. The feedback will be noted and c
FREE

---> Check all the other products <---
The Multi Time Frame Chandelier Channel is a good synthesis of the chandelier trailing stop and let you analyze the trend.
Enter when the price breaks one of the two lines, then trail using the opposite line. Ideal for scalping, entering after the dot appears.
Plenty of customization: Choose the lookback period, the longer, the slower Choose the Time Frame to use (must be greater or equal your chart TF Play around with the options to get the
FREE

This classic "old school" MAGIC MACD indicator gives you the cross of the parameters you set. Standart setting is (12,26,9) . The arrows give you a possible change of trend. Be careful and do not use this indicator as a single signal source.
FREE version Please feel free to check out our other REX indicator series. We do have other free indicators.
"OLD BUT GOLD"
FREE

This is a regression tree indicator for MT4/MT5.
This indicator classificate nodes on the time period so that the deviation becomes smaller,
and displays regression line and channel for each node.
It's free!
Attached CartDemo.ex4 and CartDemo.ex5 is a Demo version and has the following limitations:
Method is RandomForest only
Maximum number of bars is 200
Maximum number of trees is 2
Maximum tree depth is 2
Calculated waste lines are shown
Not display correlation coefficients
Fu
FREE
Добрый День, Всем. Решил выложить свой индикатор, предложить на просмотр. Я трейдер, Вадим Сергеевич Лепехо. Индикатор не стандартный, сделан не по канонам. Индикатор рисует маржинальные зоны на графике, пока полет нормальный. Но строит зоны по индикатору AO(Awesom) конкретней по фрактальным зонам индикатора AO. Зоны стандартные 1/4, 1/4, и НКЗ. Пример привожу по EURUSD + в картинках. На данный момент 14.10.23 - нкз=1920 пипсов(192 пункта) предлагаю преобразить до 192пипсов(19.8пунктов). Поясняю
FREE

Introducing Austin Bands—an innovative indicator designed to enhance your forex trading strategy by applying moving averages to the MetaTrader 4 indicator, Bollinger Bands.
Bollinger Bands are a popular technical analysis tool that consists of a middle band (usually a simple moving average), an upper band (calculated by adding a specified number of standard deviations to the middle band), and a lower band (calculated by subtracting a specified number of standard deviations from the middle ban
FREE
Целью этой новой версии стандартного MT4 индикатора, входящего в поставку платформы, является отображение в подокне нескольких таймфреймах одного и того же индикатора. См. пример, приведенный на рисунке ниже. Однако индикатор отражается не как простой индикатор MTF. Это реальное отображение индикатора на его таймфрейме. Доступные настройки в индикаторе FFx: Выбор таймфрейма для отображения (от M1 до MN) Установка ширины (количество баров) для каждого окна таймфрейма Всплывающее оповещение/звуков
FREE

This indicator allows to hide Ichimoku Kinko Hyo (on all MT4 timeframes) from a date define by the user, with a vertical line (Alone) or a panel (with "Hidden Candles"). Indicator Inputs: Tenkan-sen Kijun-sen Senkou Span B Information on "Ichimoku Kinko Hyo" indicator is available here: https://www.metatrader4.com/en/trading-platform/help/analytics/tech_indicators/ichimoku ************************************************************* Hey traders!! Give me your feeds! We are a community here
FREE

Binary Options Assistant (BOA) ICE Signals Indicator provides signals based on gkNextLevel Binary Options Strategy. Indicators: 2 Bollinger Bands & Stochastic
Stop missing trades, stop jumping from chart to chart looking for trade set-ups and get all the signals on 1 chart! U se any of the BOA Signals Indicator with the Binary Options Assistant (BOA) Multi Currency Dashboard .
All BOA Signal Indicator settings are adjustable to give you more strategy combinations. The signals can be
FREE
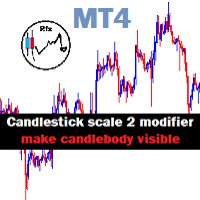
Candlestick Mod rapat.
Chart Candlesticks will stick together. make it look neat and tidy Switch between Candlestick and Line chart fixed. Instruction.
If you don't like the candles colors, you can do so by changing color. read below:
-Colors must be changed in the indicator setting.
-It won't change through the Chart properties to modify.
-After changing the color, save it as template so it wont change the colors to default value.
FREE
Become a constantly profitable 5-star forex trader!
We offer a few indicators to support you understand and analyse the market! With our strategies you will improve your trading system and bacome an expert...
We have indicators for trend direction, market direction and others.. for multi-time frames and that covers all majors or your favorite trading symbols! Some of them offer a customizable calculation parameters... or Graph features!
See how powerful they are! The are also easy-to-use
FREE
Price Alert Indicator FREE
Description:
Configurable price alert indicator for when the price crosses upwards or downwards.
Characteristics:
It can be configured one-way, or both ways.
Horizontal lines are used to indicate the level to which you want to be alerted.
On-screen buttons to hide or show the lines.
Alerts:
MT4 alert.
Push alert to mobile phone.
FREE VERSION ONLY WORKS ON AUDUSD PRO VERSION: https://www.mql5.com/es/market/product/53040
FREE
Check out other great products from https://www.mql5.com/en/users/augustinekamatu/seller
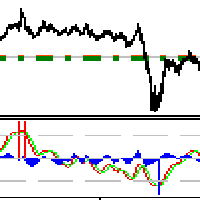
This indicator is the best so far at estimating reversal points especially on high time frames. It does not repaint and is based on a combination of moving averages computed using custom functions. No inputs required, it is simple plug and play. The principles used ensure that it can be used on CFDs, Commodities and Stock with incredibly great results. With proper money management and portfolio balancin
FREE

Stat Monitor – это хороший информационный индикатор.
Преимущества индикатора: Индикатор выдает полезную информацию - текущий спред, стоимость одного лота символа, торговое плечо и рекомендуемый размер лота для торговли.
Использовать индикатор можно на торговой платформе MetaTrader 4 любого брокера. Индикатор можно использовать как отличное основное дополнение к вашей торговой системе.
Версия индикатора Stat Monitor для MetaTrader 5 Желаю всем удачи в торговле и стабильного профита!
FREE

RSI Scanner, Multiple Symbols and Timeframes, Graphical User Interface An indicator that scans multiple symbols added from the market watch and timeframes and displays result in a graphical panel. Features: Multi symbol Multi timeframe Alerts and Notifications Live Monitoring Sorting modes One click to change symbol and timeframe Inputs for RSI and scanner settings
FREE

Представленный индикатор использует фильтр Laguerre для построения осцилятора. Индикатор имеет возможность двойного дополнительного сглаживания, что может быть полезно при малых значениях параметра Gamma. Индикатор подает три типа сигналов: Выход осциллятора из зоны перекупленности/перепроданности; Пересечение осциллятором середины значения между зонами перекупленности/перепроданности; Вход осциллятора в зону перекупленности/перепроданности. На полностью сформированных свечах индикатор не перер
FREE

This indicator determine price volatility using correlation between Price and Time. WARNING: Not suitable for 1M timeframe, you would not see any lines in this frame!
How to Use:
More closer the indicator's value to 0, the price is considered more volatile. When reversal is started, the indicator's value would be rise or fall significantly. During a strong trend, the indicator's value would be closer to 1 or -1, depends on current trend. Entry Signal:
BUY SIGNAL: Indicator crosses 0.2 from
FREE
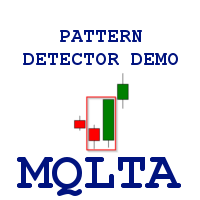
Индикатор Pattern Detector находит наиболее популярные свечные паттерны из 1, 2 и 3 свечей и отправляет уведомления при их нахождении. Демо-версия работает только на паре AUDNZD. Полная версия продукта: https://www.mql5.com/ru/market/product/29190
Принципы работы Прикрепите индикатор на график, который хотите проанализировать, и выберите паттерны, которые нужно найти. Индикатор будет отображать найденные паттерны. Также индикатор может отправлять уведомления о найденных паттернах в терминал, н
FREE
Представленный индикатор подает сигналы о выходе цены за пределы Donchian channel, а также о возращении цены в канал. Donchian channel - технический индикатор, разработанный Ричардом Дончяном, является вариацией правила пробоя торгового интервала. Строится взятием самой высокой (максимума из High) и самой низкой (минимума из Low) цены за предыдущие n периодов с последующим обозначением области между ними на графике. Дончян рекомендовал использовать свой индикатор для дневных таймфреймов с интерв
FREE

Этот индикатор собирает и систематизирует данные о спреде. Он является органическим приложением к моему новостному роботу ExpertNews , который можно скачать здесь .
Так же вы можете посмотреть видео про новостную торговлю с помощью робота ExpertNews. Оно доступно на youtube .
К сожалению, разместить робот в магазине mql5.com не представляется возможным, потому что автоматическая валидация ExpertNews сервисом mql5 заканчивается неудачей.
В действительности никаких ошибок в роботе нет. Тест
FREE
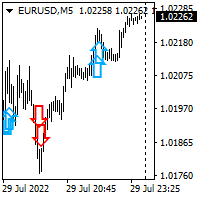
Hello all. This indicator helps you to open a trade, when break out occurred, also you can add to your position and ride it if trend continued. I use it on 1-5 min chart, as you can use short stop loss. Also profit target should be small as well. It is better to enter few small position, so you can book some profit early and ride the rest for bigger gains. Look at the past to have a plan. Enjoy.
FREE

ADR 10 mostra l'intervallo medio di pips di una coppia Forex, misurato su un numero di 10 giorni . I traders possono utilizzarlo per visualizzare la potenziale azione dei prezzi al di fuori del movimento medio giornaliero.
Quando l'ADR è al di sopra della media, significa che la volatilità giornaliera è superiore al normale, il che implica che la coppia di valute potrebbe estendersi oltre la sua norma.
L'ADR è utile anche per il trading di inversioni intraday. Ad esempio, se una coppia di
FREE
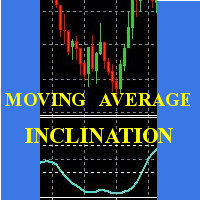
Scalp using the behavior of a short moving average, the indicator gives the slope and identifies the "hyper" moments.
Operational advice:
Use M1 chart. Period 20 : open buy after two rising lows; sell after two max downhill; avoid countertrend openings; when the line goes flat put a stop at the opening price. Avoid actions in low volatility timeslots. When the curve that draws the min / max is very flat, it is better to postpone at least 15'.
Period 50 : matches the trend, when it is at t
FREE
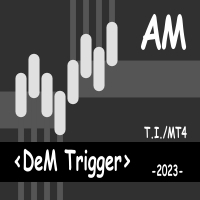
Этот индикатор отображает данные DeMarker oscillator за два разных периода. Расположение гистограммы выше нуля говорит о росте цен. Расположение гистограммы ниже нуля говорит от падении цен. На полностью сформированных барах графика индикатор не перерисовывается. В то же время значения индикатора на 0 баре (текущий бар, бар который еще не закончил формирование) могут изменятся. Таким образом, значения индикатора на 0 баре следует игнорировать.
- Продажа при наличии всех условий: Данные индика
FREE

Основываясь на сочетании показателей, E13 Acid Fulx является отличным показателем для зная, когда покупать или продавать на любой актив и временность. Индикатор сам я использовал его в качестве инструмента для моего анализа при торговле Forex. Это полезный и простой для понимания индикатор тренда. Если вы объедините его с вашим собственным анализом вы, безусловно, получите хороший результат в вашей операции.
FREE

Description This scanner uses 3LZZ TRO ex4 and scans for Semafors at given “Shift” bar.
Scanner Detailed Settings: https://www.mql5.com/en/blogs/post/747456
Other Settings: Set Periods for Semafor 1,2,3 Set alerts on/off for Semafor 1,2,3 Shift bar (Bar on which semafor is scanned) Refresh After Ticks (Number of ticks when dash is refreshed) This scanner is pretty simplistic version. And a more detailed version with a different strategy is available here: https://www.mql5.com/en/market/produ
FREE
Track your overall trades! Monitor New Fox is an excellent indicator, which displays your current profits, being them monthly, weekly, and daily, that is, all profits obtained when you opened the mt4. Our brand new Monitor New Fox indicator is able to unlock all advanced features of MetaTrader 4. This indicator can graph with simple data key meta trader account data (Balance, Equity, Free Margin, Current Profit/Loss, Profit/Loss total, amount of open position(s) and size, etc.) and all this in a
FREE

Цифровые фильтры являются (упрощенно) способом сглаживания данных. В отличии от традиционных скользящих средних цифровой фильтр в большинстве случаев будет более эффективен. Данный индикатор позволяет выявить разницу между текущей ценой и ее предполагаемым значением рассчитанным адаптивным цифровым фильтром. Моменты расхождения являются моментами движения цены которые могут быть использованы для открытия сделки. Индикатор не только наглядно отображает такие моменты в отдельном окне но и позволяе
FREE

Индикатор выводит информацию о: названии валютной пары и таймфрейме. текущей цене bid. времени до закрытия свечи. текущей разницы между ask и bid (спред). Также в индикаторе можно включить опцию вывода статистической информации по торговому обороту.
Показывает Имя, номер счета и валюту счета. Депозит в валюте счета. Баланс на текущее время и процент от баланса. Текущую прибыль и ее процент. Текущие сделки и процент от общего депозита. Прибыль/убыток по сделкам и процент от депозита. Индикатор
FREE

GM Reverse Indicator works on Fibonacci along with some other tweaks
-> It is programmed to automate 100% when the market fluctuates This indicator I use to find support points. It really works and I want to share it with you.
-> Simply attach the GM Reversal Indicator to any chart you want. The larger the timeframe, the better the signal quality (you should use with the timeframe from H4) -> This is my signal : https://www.mql5.com/en/signals/1415444
Please leave me a positive review, if
FREE
MetaTrader Маркет - лучшее место для продажи торговых роботов и технических индикаторов.
Вам необходимо только написать востребованную программу для платформы MetaTrader, красиво оформить и добавить хорошее описание. Мы поможем вам опубликовать продукт в сервисе Маркет, где его могут купить миллионы пользователей MetaTrader. Так что занимайтесь только непосредственно своим делом - пишите программы для автотрейдинга.
Вы упускаете торговые возможности:
- Бесплатные приложения для трейдинга
- 8 000+ сигналов для копирования
- Экономические новости для анализа финансовых рынков
Регистрация
Вход
Если у вас нет учетной записи, зарегистрируйтесь
Для авторизации и пользования сайтом MQL5.com необходимо разрешить использование файлов Сookie.
Пожалуйста, включите в вашем браузере данную настройку, иначе вы не сможете авторизоваться.