Смотри обучающее видео по маркету на YouTube
Как купить торгового робота или индикатор
Запусти робота на
виртуальном хостинге
виртуальном хостинге
Протестируй индикатор/робота перед покупкой
Хочешь зарабатывать в Маркете?
Как подать продукт, чтобы его покупали
Технические индикаторы для MetaTrader 4 - 24

Imbalance / Fair Value Gap (FVG), this is a zone / gap created when the price move with force in a given direction. It identify a zone where the price could potentially go back. This gives perfect targets for your trades.
Imbalance is created from the high and low of 3 candles. When the wicks the of 1st and 3rd candle does not fully overlap the middle one.
This indicator will help you to easily spot mitigated/unmitigated imbalances in your chart.
NEW FEATURE Update: Multi-TimeFrame Feat
Wicks UpDown Target
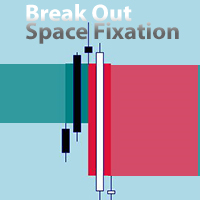
Choppy movement up and down on the opening range every day. Trading breakouts on London session and New York session is recommended. Wicks UpDown Target is specialized in all forex pairs.
Guideline Entry Strategy Idea:
Step 1 - Breakout Forming (Warning! Trade on London Session and New York Session) Step 2 - Breakout Starting (Take Action on your trading plan) Step 3 - Partial Close your order & set breakeven (no-risk) Step 4 - Target complete Step 5 - Don't trade in
MT5 Version
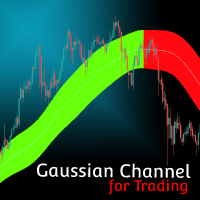
Gaussian Channel MT4 Gaussian Channel MT4 is the first indicator in the market that uses Ehlers Gaussian Filter methods to define trends. Nowadays, this Gaussian Channel is highly known as a method to support HOLD techniques in crypto. If the price is above the channel the trend is strong, if it comes back to the channel this can react as a resistance and indicate the beginning of a bear market (or Winter) if the price breaks below it. Eventhough the use of this channel focuses on

Heikin-Ashi charts , developed by Munehisa Homma in the 1700s. Munehisa Honma was a rice merchant from Sakata, Japan who traded in the Dojima Rice market in Osaka during the Tokugawa Shogunate. He is considered to be the father of the candlestick chart. Th e man who invented the use of candlestick charts for finding and profiting from chart patterns.He was a billionaire trader on those days if we compared his net-worth with todays dollar . Heikin Ashi Scanner is an Multi-Currency and Multi

This indicator tool provides mini charts, with adjustable symbol/tf that can be dragged and resized into place. Lightweight operation with multiple mini charts are supported.
Chart features: adjustable symbol and tf draggable resizeable multiple mini charts color styling and font sizing, foreground/background colors candle coloring candle styles; candles, bars, line, high-low channel
optional background color gradient predfined period separators on all tf's (eg 1hr/1day sep on 1Min, 4hr/1day

Must be owned and used by Fibonacci traders who like to open position by pending order (limit order). The strategy is that you just have to wait for the automatic custom fibonacci appear then manual place your pending order, stop loss and take profit at the level of Fibonacci. The position will be opened when the price make a successful retest. Fibo Heart Indi come with pop-up alert, email and mobile push notification. Suitable for all instruments and all time frames. Don't miss the trading set
Уникальный индикатор IceFX VelocityMeter для платформы MetaTrader 4 измеряет скорость рынка форекс. Это не обычный индикатор объемов или других величин, т.к. IceFX VelocityMeter способен понять скорость скрытых в тиках движений рынка, а эта ценная информация не доступна в обычных свечах, поэтому не может быть получена простым индикатором. Этот индикатор контролирует приход тиков (частоту и величину изменения) в пределах указанного диапазона времени, анализирует эти данные, определяет, записывает
FREE
How To Trade
Execute your trades in 3 Easy Steps!
Step 1: Trade Setup Entry Buy in Signal Arrow color DodgerBlue. Entry Sell in Signal Arrow color RED. Success Rate ≥ 75% 100:25 Step 2: Set Stop Loss Stop loss BUY ----> You can set stop loss on Line RECTANGEL color DodgerBlue. Stop loss SELL ----> You can set stop loss on Line RECTANGEL color RED. Step 3: Set Take Profit Take profit BUY on RECTANGEL color RED. Take profit SELL on RECTANGEL color DodgerBlue. Strategy SIMPLE Day trading / Swi
FREE

Key Features: Type of Indicator: Line Break Chart Indicator Usage: Identifying trend reversals and potential market turning points. Input Parameters: The primary input parameter is 'Lines_Break,' which represents the number of lines the price needs to move to create a new line in the opposite direction. How it works: The indicator draws green and red histogram bars to represent the line break chart. Green bars indicate an upward trend, and red bars indicate a downward trend. The indicator calcul
FREE
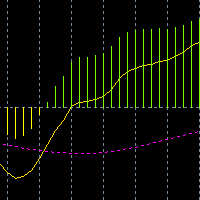
одель MACD, а также добавлены две линии, когда они пересекаются, чтобы получить сигнал покупки или продажи.
желтый сигнал линии в розовой линии сигнала, розовый сигнал вниз, желтый сигнал сверху, что означает больше.
желтый сигнал под линией бледного сигнала, желтый сигнал вниз, розовый сигнал сверху, обозначает пустоту.
линия с нулевыми или выше столбчатыми линиями переводится на светло - зелёные.
под нулевыми линиями столбчатая линия переводится на светло - желтый.
FREE
Загружает недостающие данные для всех валютных пар, доступных в обзоре рынка. Очень полезно для тестирования советников и стратегий на исторических данных, а также для загрузки всей истории сразу, а не по отдельности. Индикатор будет работать до тех пор, пока не будут загружены все исторические данные по выбранным валютным парам. Индикатор имеет несколько опций: 1. Скачать данные для одной пары 2. Скачать только для текущей пары 3. Скачать для выбранных пар 4. Скачать для всех пар в обзоре рынка
FREE
Highly configurable Bollinger Bands indicator. Features: Highly customizable alert functions (at levels, crosses, direction changes via email, push, sound, popup) Multi timeframe ability Color customization (at levels, crosses, direction changes) Linear interpolation option Works on strategy tester in multi timeframe mode (at weekend without ticks also) Parameters:
Bollinger Bands Timeframe: You can set the lower/higher timeframes for Bollinger Bands. Bollinger Bands Bar Shift: Y ou can set
FREE
Тиковый индикатор
является очень мощным инструментом для скальпинга. Он показывает вам движение вверх и вниз на рынке.
Таким образом, вы можете определить направление намного быстрее.
Индикатор очень прост в установке и может использоваться на всех таймфреймах и всех парах форекс, биткоин .....
Просто установите файл в папку индикатора вашего терминала MT4, обновите или перезапустите терминал и перетащите его на график, на котором вы хотите торговать.
Лучший способ - следить за кроссо
Candlestick pattern system finds 40 candle formations. Features Has the feature to send the notification. It has candlestick patterns feature. Bullish patterns feature. Bearish patterns feature. Trend filter and reliability features.
Parameters Show alert - Send alert Send email - Send alerts to mail address. Look back - Retrospective calculation === PATTERN SETUP === Show bullish patterns - Open close feature Show bearish patterns - Open close feature Trend filter - Open close feature

Индикатор LexusBO рекомендуется для торговли бинарными опционами . ( Для создания своего сигнального индикатора без знания кода и опыта программирования воспользуйтесь моим уникальным инструментом Arrow Construct .) Сигналы формируются при пересечении настраиваемых уровней индикаторами RSI, ADX, CCI. На графике индикатор отображает сигналы стрелками "вверх/вниз" , значения которых находятся в буферных массивах (буфер с индексом 0 - стрелка "вверх", с индексом 1 - стрелка "вниз"). Поэтому инд
FREE

Supply and Demand indicator does not repaint as it counts the number of tests/retests occurred in the past x number of times. As a trader you need a path to be able to place your buy and sell trades such as: Supply and Demand, Falling & raising channels . Experienced trades will draw the key levels and channels around the timeframes. But, they will not be able to draw them on the small time frames as the price changes too frequent. This indicator is based on Shved supply and demand indicator, b
FREE

This indicator is one of the useful tools for traders who trade on currency pairs and based on the strength of each currency they can make a correct decision or confirmation in the positions. It has been calculated for all the minor currency pairs supported by the broker and displays the values of the major currencies. These currencies are displayed horizontally or vertically according to the trader's config when executing the indicator. One of the trading strategies that can be used is to cho
FREE

The indicator rely on The Toby strategy >> The mother candle which is bigger in range than the previous six candles.
A vertical line shows the last Toby Candle with the targets shown up and down. The strategy is about the closing price out of the range of the toby candle to reach the 3 targets..The most probable to be hit is target1 so ensure reserving your profits and managing your stop lose.
FREE

The Elder Impulse System was designed by Alexander Elder and featured in his book. According to Elder, “the system identifies inflection points where a trend speeds up or slows down”. The Impulse System is based on two indicators, a exponential moving average and the MACD-Histogram. The moving average identifies the trend, while the MACD-Histogram measures momentum. As a result, the Impulse System combines trend following and momentum to identify tradable impulses. This unique indicator combina

This indicator draws regular bullish and bearish divergences in real-time onto the charts. The algorithm to detect those divergences is based on my 10+ years experience of detecting divergences visually. The divergences are drawn as green and red rectangles on the charts. You can even do forward testing in the visual mode of the strategy tester.
Parameters Fast EMA Period: The period of the fast EMA of the MACD. Default value is 12.
Slow EMA Period: The period of the slow EMA of the MACD. Def

Уникальная мультивалютная авторская стратегия, разработана для торговли на временном периоде Н1, что позволяет определять глобальные точки входа в рынок и получать максимальную прибыль по каждой сделке. Точка входа в рынок рассчитывается с помощью множества авторских формул и алгоритмов. Рекомендуем использовать индикатор одновременно на нескольких торговых инструментах. Огромным плюсом Big Deals System является наличие информационной панели, в которой пользователь может увидеть актуальную инфор

Введение в алгоритм GARCH Improved Nelder Mead GARCH - это сокращение от Generalized Autoregressive Conditional Heteroskedasticity (Обобщенная авторегрессионная условная гетероскедастичность). Представляет собой модель прогнозирования волатильности, обычно применяемую в финансовой сфере. Модель GARCH впервые появилась в работе датского экономиста Тима Петера Боллерслева (Tim Peter Bollerslev) в 1986 году. Лауреат Нобелевской премии 2003 года Роберт Ф. Энгл внес огромный вклад в усовершенствовани
FREE

Exclusive Limited Time Offer! Grab this useful indicator for a lifetime at just $49. Volatility indicator dashboard designed to revolutionize how traders perceive and navigate market volatility. Track volatile for multiple currency pairs one at time for multiple timeframes. Works best with Forex Market, Gold, Silver, Oil. Available in MT4, MT5. Indicator Features: Multi-Symbol, Multi-Timeframe Dashboard: Gain a strategic advantage by simultaneously monitoring volatility across various currenc
Highly configurable RSI indicator. Features: Highly customizable alert functions (at levels, crosses, direction changes via email, push, sound, popup) Multi timeframe ability Color customization (at levels, crosses, direction changes) Linear interpolation and histogram mode options Works on strategy tester in multi timeframe mode (at weekend without ticks also) Adjustable Levels Parameters:
RSI Timeframe: You can set the current or a higher timeframes for RSI. RSI Bar Shift: you can set
FREE

WaveTrend Momentum Oscillator - это модификация популярного и удобного осциллятора WaveTrend. WaveTrend Momentum Oscillator добавляет компоненту темпа в расчеты WaveTrend, чтобы более быстро предоставлять более точные точки входа в условиях трендового рынка. Вы предпочитаете оригинальный осциллятор WaveTrend? WaveTrend Momentum Oscillator позволяет переключаться между темповой и оригинальной версиями WT. Они оба предоставляют ценную информацию в зависимости от рыночных условий. Когда линии WT на
Привет дорогой друг! Вот моя история. После долгих попыток торговать вручную решил использовать робота. Начал писать своего робота. Но тестирование занимало огромное время! Параллельно пробовал чужих роботов. И опять тратил много времени на тестирование. Ночные скальперы, новостные, интрадей и многие другие классы... Требовалось точно знать, когда робот торгует, когда в прибыль, а когда в убытке. У некоторых роботов есть не описанные особенности торговли по времени. В результате для себя напис
Dear everyone, Today, I would like to introduce you to an amazing tool on the MetaTrader 4 platform - "Pivotal Moments." This indicator will be a reliable companion on your trading journey in the financial market. "Pivotal Moments" is not just an ordinary indicator, but an intelligent tool that helps you better understand significant fluctuations on the chart. With a variety of customization options, it provides valuable information and deep insights into the market. The key features of "Pivotal
FREE

Introduction to Fractal Moving Average Fractal Moving Average indicator was designed as part of Fractal Pattern Scanner. Inside Fractal Pattern Scanner, Fractal Moving Average Indicator was implemented as multiple of chart objects. With over thousands of chart object, we find that it was not the best and efficient ways to operate the indicator. It was computationally too heavy for the indicator. Hence, we decide to implement the indicator version of Fractal Moving Average indicator to benefit
FREE

Indicador de Bandas de Fibonacci para Metatrader 4 . Este indicador funciona de forma similar a las conocidas Bandas de Bollinger clásicas, pero en lugar de usar la desviación estándar para trazar las bandas usa números de Fibonacci y el ATR (Average True Range). Puede usarse para trazar niveles de soporte y resistencia que pueden emplearse en sistemas de scalping de corto plazo y swing trading. Las bandas del indicador son calculadas de la siguiente forma: Línea central : Media móvil de n peri
FREE

Индикатор MultiCurrencyWPR (MCWPR) рассчитывает привычный показатель WPR для отдельных валют Форекс (т.е. их "чистых" относительных стоимостей, выделенных из валютных пар), индексов, CFD и прочих групп символов. Внутри он использует встроенный индикатор CCFpExtraValue для получения относительной "силы" выбранных инструментов. В отличие от стандартного WPR на конкретном символе, этот индикатор обеспечивает глобальную картину на выбранную часть рынка и выделяет инструменты с наибольшим потенциалом
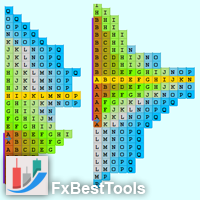
Definition : A Market Profile is an intra-day charting technique (price vertical, time/activity horizontal). Market Profile is best understood as a way to see order in the markets. Market Profile was a way for traders to get a better understanding of what was going on, without having to be on the trading floor. The current indicator is developed based on Easy-to-Use architecture including a wide range of visual settings.
Major Features of Indicator : Various Views of Market Profile The indica

Currency Power Meter показывает силу основных валют относительно друг друга. Индикатор показывает относительную силу валюты/пары в текущий момент на определенном промежутке времени (H4, день, неделя, месяца). Он будет полезен для внутридневых трейдеров, свинг-трейдеров и долгосрочников, так как предоставляет возможность настройки периода. Сила валюты - это реальная причина возникновения тренда на рынке: на паре из наиболее сильной и наиболее слабой валюты будет самый сильный тренд. Как известно,

Вы бы хотели мгновенно узнавать, какой сейчас тренд? Как насчет качества этого тренда? Поиск тренда на графике может быть субъективным. Индикатор Fractal Trend Finder анализирует график и определяет текущий тренд на основе объективных критериев. При помощи Fractal Trend Finder вы сможете легко понять, торгуете ли вы по тренду или против него. Он также обозначает время, когда на рынке отсутствует тренд. Теоретически, вы можете торговать по тренду при наличии сильного тренда, и торговать против тр
FREE

Индикатор GTAS FidTdi использует сочетание волатильности и потенциальных уровней коррекции. Этот индикатор был создан Бернардом Пратсом Деско (Bernard Prats Desclaux), трейдером и бывшим менеджером хедж-фонда, основателем E-Winvest.
Описание Индикатор представлен собой красную или зеленую огибающую выше или ниже цены.
Инструкция по применению Обнаружение тренда Когда огибающая зеленого цвета, тренд бычий. Когда она красная, тренд медвежий.
Торговля После открытия сделки GTAS FibTdi показыв
FREE
«Trend reversal ml4» – это уникальный индикатор, разработанный для определения моментов разворота цены в первое время. Это уже готовая торговая система для Metatrader4. Индикатор не перерисовывает свои значения! На основе продвинутых алгоритмов и технического анализа этот индикатор дает вам сигналы о возможных точках входа и выхода на рынок, помогая вам принимать обоснованные решения.
Преимущества индикатора: высокая точность сигналов. Индикатор сам показывает трейдеру, правильно ли он настро

the AK CAP toolbox free to use;
it includes the same indicators we use for our daily trading and we think the simpler the better. Lightweight indicator for use on all timeframes. that includes VWAP with vwap value indicator on top right. 3 EMA: FAST, MEDIUM, SLOW the candle timer to show how much time left in a candle.
colors and positions are fully customizable.
enjoy
FREE

Индикатор запаса хода, означает среднестатистическое дневное движение цены. Для удобства визуально отображается на графиках, но с таймфреймом H4 и ниже. Индикатор перерисовывается ежедневно и учитывает гэпы. Дополнительная пунктирная линия означает 80% пройденного дневного движения. Важный инструмент в арсенале профессионального трейдера или того, кто хочет им стать. PrimeTools - это серия продуктов предназначенных для правильной и профессиональной торговли. [ PrimeTools Levels | PrimeTools Rang
FREE

Индикатор Blahtech Moving Average - модифицированная версия стандартного индикатора Moving Average. Он также дополнен настраиваемыми оповещениями, разделителями периодов и другими возможностями настройки. 50-дневная и 200-дневная скользящие средние широко применяются инвесторами и трейдерами, а прорывы вверх и вниз от линий MA считаются значимыми сигналами.
Основные особенности До трех таймфреймов Настраиваемые переменные для вычислений Настраиваемые оповещения и сообщения Дополнительные перио
FREE

Real Trade торгует на таймфреймах до 1 часа. Торговля в восходящем и нисходящем направлениях. Торгуйте с более высокими временными направлениями тренда и торгуйте на первой свече. Используйте противоположное для выхода или используйте соотношение для выхода 1:1 или выше вместе с трейлинг-стопом. Торгуйте по реальным трендам в часы активности и с более высоким направлением тренда для достижения наилучших результатов. Загрузите индикатор в тестер для изучения результатов и потенциала. Используйте

This indicator is based on the ADX indicator and indicates the trend very easily.
You can customize the indicator to your needs: ADXPeriod ADXSignal_Level BarWidth CandleWith HeikenAshi
The Adx color candles indicator is fully FREE and compatible with the other part of the system; the Acc arrow >>>> https://www.mql5.com/en/market/product/33770 ENJOY and check out my other indicator: https://www.mql5.com/en/market/product/32111
FREE
Это бесплатная версия индикатора Double Top Tracker . В отличие от полной версии некоторые функции отключены, а параметры не могут быть изменены. Индикатор параллельно анализирует ценовые графики нескольких валютных пар на всех таймфреймах и отправляет уведомление, как только обнаруживаются паттерны "Двойная вершина" и "Двойное дно". Когда цена достигает второй вершины, индикатор формирует сигнал. "Двойная вершина" (Double Top) — паттерн разворота тренда, который состоит из двух последовательны
FREE
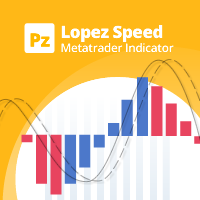
Осциллятор рассчитывает различные векторы цены/времени для отображения итогового направления рынка на основе суммы всех векторов цены/времени и двух скользящих средних, чтобы рассчитать, ускоряется рынок или замедляется. Прост в освоении и использовании
Эффективный фильтр сделок Уникальный алгоритм вычисления скорости Не перерисовывается
Снабжен различными алертами
Может использоваться в качестве эффективного фильтра сделок по тренду. Основные принципы использования: если синяя скользящая сре
FREE

VR Ticks - это специальный индикатор для стратегий на основе скальпинга. Благодаря этому индикатору, трейдер может видеть тиковый график напрямую на основном графике финансового инструмента. Тиковый график позволяет максимально точно войти позицией в рынок или закрыть позицию в рынке. VR Ticks строит тиковые данные в виде линий меняющих цвет в зависимости от направления - это позволяет визуально понимать и оценивать ситуацию на тиках. Преимущество тиковых графиков заключается в том что они не уч
FREE

With this indicator, you can easily make price regions in all time zones. In addition, with the automatic supply demand finder, you can ensure that the new regions are found automatically. You can increase your transaction quality by reaching more accurate operations with this auxiliary Tool and indicator.
I share your trial version of EURUSD for free with you. If you want to buy the working version in all parities, you can contact me. +New version Gap Bar Add ( Press G keyboard ) Default co
FREE
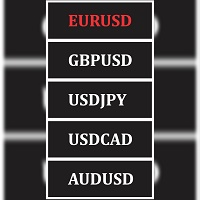
Seamlessly switch between different pairs from one window, while maintaining your current chart template across all pairs. This tools simply obtain all pairs in your market watch window and grant you the ease of switching between them from one window while maintaining your current chart setup and all loaded indicators and chart objects across all the pairs available in your market watch window.
FREE

Преимущества: Основан на классических индикаторах - ATR, Moving Average Определяет тренд/флэт на рынке, подкрашивая гистограмму соответствующим цветом Стрелками обозначены подтвержденные сигналы Является отличным фильтром для канальных стратегий (по экстремумам) Подпишись на мой telegram канал, ссылка в контактах моего профиля .
Настройки:
Наименование Описание настройки Period of Flat Detector Количество баров/свеч для анализа Period of EMA Период EMA (Moving Average) Period of ATR Пер
FREE

Quantum Swing 1.Что такое Quantum Swing ? Индикатор рассчитывает и отображает будущие ценовые уровни , на основе квантовой математики с высокой точностью вероятности и направления . Уровни отображаются в виде зон принятия торговых решений , чётко определяют узкий диапазон цен для выставления ордеров с минимальным стоп-лоссом и максимальным тейк-профитом. Индикатор отображает будущие торговые зоны на разных таймфрэймах H1 , H4 , D , W . Квантовые свинги так же отображаются без привязки к време
FREE

Данный индикатор автоматически рисует трендовые линии по нижним и верхним точкам экстремума с помощью индикатора ZigZag. По мере движения рынка индикатор постоянно обновляет линии на графике. Он может работать на любом типе счета или графике. Все параметры можно отрегулировать.
Настройки: Delete_Lines - При значении true индикатор будет удалять старые трендовые линии по мере формирования новых точек экстремума индикатора ZZ. При значении false старые трендовые линии удаляться не будут. Num_ZZ_
FREE

Advanced Currency Strength Indicator
The Advanced Divergence Currency Strength Indicator. Not only it breaks down all 28 forex currency pairs and calculates the strength of individual currencies across all timeframes , but, You'll be analyzing the WHOLE forex market in 1 window (In just 1 minute) . This indicator is very powerful because it reveals the true movements of the market. It is highly recommended to analyze charts knowing the performance of individual currencies or

Целью этой новой версии стандартного MT4 индикатора, входящего в поставку платформы, является отображение в подокне нескольких таймфреймах одного и того же индикатора. См. пример, приведенный на рисунке ниже. Однако индикатор отражается не как простой индикатор MTF. Это реальное отображение индикатора на его таймфрейме. Доступные настройки в индикаторе FFx: Выбор таймфрейма для отображения (от M1 до MN) Установка ширины (количество баров) для каждого окна таймфрейма Всплывающее оповещение/звуков
FREE

This indicator graphically displays profit ($),risk/reward and % of risk according SL&TP Open orders on Current Symbol. when you open orders on current symbol and set StoplLoss and TakeProfit this indicator automatically calculate Risk/Reward and calculate %risk Of Equity Account that your order get stop Loss. If you trade on several symbols at the same time, you can install the indicator on each one separately and see the relevant calculations on each one.
FREE

Этот осциллятор стал одним из основных инструментов большинства профессиональных трейдеров. Индикатор включает в себя классическую MACD ( Moving Average Convergence/Divergence ) линию, сигнальную линию, а также гистограмму MACD. В расчете используются экспоненциальные скользящие средние. Так же в индикаторе предусмотрена возможность включения сигналов о нахождении дивергенций между графиком цены и индикатором. Поиск дивергенций происходит по трем паттернам: классическая, скрытая и расширенная ди
FREE

Представляем Auto Trendline, инновационный индикатор MT4, который автоматизирует процесс
рисования линий тренда на ваших графиках. Попрощайтесь с утомительной и трудоемкой задачей ручного рисования линий тренда,
и пусть Auto Trendline сделает всю работу за вас!
*Свяжитесь со мной после покупки, чтобы отправить вам инструкции и пошаговое руководство.
Благодаря усовершенствованному алгоритму Auto Trendline автоматически определяет и рисует линии тренда,
экономя ваше время и усилия. П
IntradaySignals Intraday Signals is a visual and effective semi-automatic trading system, that: generates possible entry points to open BUY and SELL trades; displays recommended Take Profit and Stop Loss; displays current profit on open trade; displays current spread. The profitability of the indicator is shown in the screenshot on the example of the GBPUSD pair Does not redraw and works on opening bar. Time frames - M1-H1. Recommended TimeFrame-M5-M15. Signals are produced based on the used
FREE
This indicator is a professional Trend identifier, it measures the angle or slope of moving averages with different methods. As this indicator calculate angles you can identify the strength of trend by magnitude of angle. It also shows if angle is increasing or decreasing which gives you the opportunity to make more information about current trend. You can combine this indicator with your strategy as a filter or you can use it alone to make your trading system. This is not a repainting indicator
FREE

Торговать с помощью индикатора MACD стало еще удобнее. Гибкие настройки помогут тебе подобрать то, что действительно тебе нужно в твоей торговле. Используй ту стратегию, которая тебе нужна - в индикаторе используются 3 стратегии. Скачивай демо прямо сейчас! Рекомендую посмотреть моего советника - Night Zen EA Подпишись на мой telegram канал, ссылка в контактах моего профиля - мой профиль Смотри также другие мои продукты на mql5.com - мои продукты Преимущества индикатора: В данном индикаторе инте
FREE

The Rayol Code Hour Interval Lines indicator was designed to assist your trading experience. It draws the range of hours chosen by the user directly on the chart, so that it enables traders to visualize price movements during their preferred trading hours, providing traders a more comprehensive view of price movements and market dynamics. This indicator allows the user to choose not only the Broker's time, but also the Local time. This way, the user no longer needs to calculate local ti
FREE

The " Multi Kernel Regression " is a versatile trading indicator that provides graphical interpretations of market trends by using different kernel regression methods. It's beneficial because it smoothes out price data, creating a clearer picture of price movements, and can be tailored according to the user's preference with various options.
What makes this indicator uniquely versatile is the 'Kernel Select' feature, which allows you to choose from a variety of regression kernel types, such
FREE
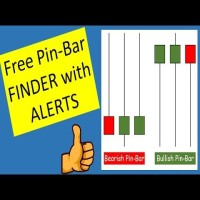
Pinbar Detector is a MetaTrader indicator that tries to detect Pinbars (also known as "Pin-bar" or "Pin bar") and marks them by placing a "smiling face" symbol below the bullish Pinbars and above the bearish Pinbars. It is a pure price action indicator, which is not using any standard technical indicators in its code. The configuration of Pinbar detection can be done via the indicator's input parameters. Pinbar Detector can issue platform alerts and email alerts on detection.
As you can see
FREE

Сигнальный индикатор, состоящий из нескольких широко известных индикаторов, обрабатывающих данные последовательно. 2 варианта - для графика и подвальный. В настройках возможно включить оповещения о смене тренда (алерты) звуковые, на e-mail и push. Есть возможность менять цвета и толщину линий, цвета и коды стрелок, количество расчетных баров и отдельно настраивать параметры входящих в состав индикаторов.
FREE

This indicator shows us the trend or direction of the market and a possible stop loss
This indicator works with two parameters, period and multiplier. Buy and sell signals are generated when the indicator crosses the closing price and it changes color.
This indicator is used in all types of markets such as stocks, futures, forex, cryptos, additionally it can be used in different time periods: hours, daily, weekly, etc.
It is recommended not to use it while the market is sideways, this can
FREE

Целью этой новой версии стандартного MT4 индикатора, входящего в поставку платформы, является отображение в подокне нескольких таймфреймах одного и того же индикатора. См. пример, приведенный на рисунке ниже. Однако индикатор отражается не как простой индикатор MTF. Это реальное отображение индикатора на его таймфрейме. Доступные настройки в индикаторе FFx: Выбор таймфрейма для отображения (от M1 до MN) Установка ширины (количество баров) для каждого окна таймфрейма Всплывающее оповещение/звуков
FREE

*This is tradingview indicator converted to mql4*
The CM Slingshot System Indicator is a trading tool that aims to identify potential trade setups based on market volatility and price action. It is designed to help traders spot entry and exit points in trending markets. The CM Slingshot System Indicator combines multiple indicators and techniques to generate trading signals. Here are the key features and components of the indicator: Bollinger Bands: The indicator incorporates Bollinger Bands,
FREE
The Average Daily Range Levels indicator shows the ADR levels on the chart as if they were supports and resistances and is updated daily.
By default the indicator uses the 5-day average of the daily range. There are several strategies that suggest that these levels can be used to determine where the price can bounce and it is often said that the price can typically move 75% of the ADR.
In future versions I may add alerts at each level
Can you suggest any changes?
Greetings!
FREE

VR Sync Charts это утилита для синхронизации разметки между окнами. ИНДИКАТОР НЕ РАБОТАЕТ В ТЕСТЕРЕ СТРАТЕГИЙ!!! Как получить триал версию с тестовым периодом, инструкции, обучение читайте в блоге https://www.mql5.com/ru/blogs/post/726504 . С помощью VR Sync Charts Ваши трендовые урони, горизонтальные уровни, разметка Фибоначчи будут синхронизированы со всеми графиками. Утилита позволяет синхронизировать все стандартные графические объекты в терминале MetaTrader, все Ваши тренды, линии Ганна, и

'Circle Rising Point' is an indicator based on the cycle theory. No matter whether your trading cycle is short or long, you can use this indicator to find the rise and fall points of different cycles and different bands. Therefore, the signals displayed to you on charts of different cycles are different, and applicable to left side transactions. This indicator is recommended to be used together with the multi cycle window for analysis. Indicator introduction Applicable products This indicato
FREE
Buy a Coffee for Yuniesky Carralero Cuellar
This indicator draws the RED - GREEN and GREEN - RED candlestick pattern, the green candles that close above their previous red candle, and the red candles closing below your previous green candle. https://www.youtube.com/watch?v=UAW-fIyV-0U&t=1154s
Input Parameters 1. RED - GREEN: Draw the green candles that close above their previous red candle. 2. GREEN - RED: Draw the red candles that close below their previous green candle. 3. PREV CANDLE: D
FREE

1. Compound Drawings (1) Line segment with arrow (2) Continuous line segment (broken line) (3) Parallelogram (4) Polygon (5) Profit and loss ratio measurement tools
2. Backtracking By the Z key in the process of drawing the line Line types that support Z-key backtracking: continuous line segments (broken line) ,channels,parallelograms,polygons, and fibo extensions.
3.Automatic Adsorption (1) Click the "Lock-Button" to switch the automatic adsorption switch before drawing the line (2)
Идет подготовка EA версии. Можете отправить личное сообщение "оповестите о EA версии". EA будет универсален с множеством настроек для торговли по различным индикаторам.
Новый EA позволит так же торговать по данному индикатору.
К примеру разрешая сигналы после Х сигналов/баров до Х сигналов/баров в одном направлении, до смены направления.
Если Break Out произошёл до/после сигнала другого индикатора.
Набирать прибыль на каждом следующем сигнале выше/ниже предыдущего. Отправьте личное
FREE

Fisher Yur4ik Indicator is a momentum indicator originated by Yuri Prokiev (Russian). I combined the Fisher Test indicator with other indicators to sieve/filter signals. It is not used as a standalone indicator but in combination to filter out Price Action signals. I have uploaded this indicator (Fisher test) for download alongside the 3Bar_Play signal indicator for signals to appear. It is free.
FREE
А знаете ли вы, почему MetaTrader Market - лучшее место для продажи торговых стратегий и технических индикаторов? Разработчику у нас не нужно тратить время и силы на рекламу, защиту программ и расчеты с покупателями. Всё это уже сделано.
Вы упускаете торговые возможности:
- Бесплатные приложения для трейдинга
- 8 000+ сигналов для копирования
- Экономические новости для анализа финансовых рынков
Регистрация
Вход
Если у вас нет учетной записи, зарегистрируйтесь
Для авторизации и пользования сайтом MQL5.com необходимо разрешить использование файлов Сookie.
Пожалуйста, включите в вашем браузере данную настройку, иначе вы не сможете авторизоваться.