YouTubeにあるマーケットチュートリアルビデオをご覧ください
ロボットや指標を購入する
仮想ホスティングで
EAを実行
EAを実行
ロボットや指標を購入前にテストする
マーケットで収入を得る
販売のためにプロダクトをプレゼンテーションする方法
MetaTrader 4のためのテクニカル指標 - 98
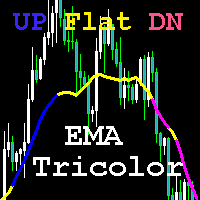
インジケーターは、オフセットポイントPoint1とBar1(最後に閉じたバー)の間のClosePriceの差をDifer定数と比較します。 値が正でDiferを超える場合、UPトレンドに対応する青い線が描画されます。 値が負でDiferを超える場合、DNトレンドに対応するマゼンタの線が描画されます。 トレンドがないこと(フラット)は黄色で示されます。 速いMAと遅いMAを横断してトレードすることもできます。このオプションは、スキャルピングに適しています。 新しいバーの始値のMAに対する相対的な位置を考慮して、メインMAの色(および高速MAの交点)を考慮してシグナルを生成することもできます。このオプションは、中長期の取引に適しています。 インディケータはEMA計算式を使用しており、価格の変化にすばやく反応しますが、より多くのノイズを捕捉します。気をつけて。小さな振幅で横に移動する場合、MA信号は常に信頼できるとは限りません。 私はこのインディカ2を使用しています torは15年以上もの間、その関連性を失っていません。他の製品よりも頻繁に使用されています。トリコロー
One of the most successful strategies in Forex, stick and metal market, is rectangle pattern. A hard pattern to find in multiple time frames, but, We made it so very easy for you. You can turn on this indicator in different currency pairs with different time frames and set the alarm on your computer or mobile phone. Working with this strategy is easy and enjoyable. Telegram: https://t.me/triangleexpert Instagram: https://www.instagram.com/p/CNPbOLMh9Af/?igshid=15apgc7j1h5hm
Note: This indica

Indicator of fractals with adjustable indents. Designed according to an original simplified algorithm for use in EA.
The main ones in the indicator are lines showing the levels of the current fractals, which allows you to read the values of the last fractal in one operation.
It works on a closed bar, so it does not redraw and does not load the terminal with calculations.
It should be understood that the indicator is late with the detection of the fractal by the number of bars on the r

The Fúria indicator was developed to work when the market is in trend, that is, you will rarely see any signs in consolidation zones. It can be used for both Forex and Binary Options.
The signs plotted on the graph do not repaint or recalculate, even if you close and reopen your MT4 / MT5 they will be there.
Wait for the signal to set on the candle before you can enter the next candle.
==================================================
* BUFFERS: 0 (CALL) and 1 (PUT); * TYPE OF ENTRY: n
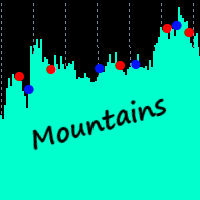
Visual helper for spotting peaks and troughs. Alerts. PSar settings for trend direction determination. Great for scalping. How to use: Simply attach to any chart. To spot peaks and troughs, zoom chart out completely. Sell on red dots. Best results when red dot appears on 3 or more time frames. Buy on blue dots. Best results when blue dot appears on 3 or more time frames. If used on lower timeframes (M1, M5, M15, M30), please make sure to check higher timeframes. Or backtest and use as you see fi

Prosecution is a Forex arrow indicator that tracks the market trend, ignoring sharp market fluctuations and noise around the average price. The indicator is created on the basis of a special algorithm, and based on the developed algorithm, signals are created that allow you to track the trend and see its beginning and end, especially when several timeframes are combined to refine the signal. The arrows show the direction of the deal, and are colored accordingly, which can be seen in the screensh

Free scanner available here: https://abiroid.com/product/abiroid-ema-scalper
Basic Strategy: 1: MA Crossover Up/Down Arrow (Mandatory Check) Optional Checks: 2: If NRTR Check On (Optional): For BUY: Check if NRTR blue and For SELL: NRTR Red If NRTR Shadow Distance On (Optional): Check price for 'x' bars back: at Shadow distance (ATR Multiplier distance) from NRTR line. 3: If High Volume bar On: Check if High Volume or if Medium (if on) Volume bar 'x' bars back 4: If HTF Trend Align On (Option
Новая серия индикаторов Veles Dynamic. Индикаторы не перерисовывают своих значений.
Эти индикаторы работают быстрее и точнее аналогичных по названию.
Индикатор Veles_dMA_Plus представляет собой динамическую МА, рассчитанную по текущим ценам инструмента.
Имеется возможность динамического сглаживания линии. Есть возможность отображения текущего трендового канала с изменением его волатильности.
Параметры: period - период динамической МА price - применяемая цена shift - сдвиг МА влево от
Новая серия индикаторов Veles Dynamic. Индикаторы не перерисовывают своих значений.
Эти индикаторы работают быстрее и точнее аналогичных по названию.
Индикатор Veles_dMACD представляет собой разницу показаний между двух динамических МА, рассчитанных по текущим ценам инструмента.
Хорошо показывает разворотные моменты, позволяет точно определять дивергенции. Имеет цветовое сопровождение изменения показаний.
Параметры: period_Fast - период быстрой динамической МА period_Slow - период
Новая серия индикаторов Veles Dynamic. Индикаторы не перерисовывают своих значений.
Эти индикаторы работают быстрее и точнее аналогичных по названию.
Индикатор Veles_dChannel представляет собой динамическую МА с расчетным каналом по текущим ценам инструмента.
Индикатор показывает полностью законченное движение в цикле.
Данный индикатор может использоваться в качестве установки и траллирования стопов при скальпинге.
Параметры: period - период динамической МА price - применяемая це
Новая серия индикаторов Veles Dynamic. Индикаторы не перерисовывают своих значений.
Эти индикаторы работают быстрее и точнее аналогичных по названию.
Индикатор Veles_dTrend представляет собой гистограмму, рассчитанную на основе нескольких динамических алгоритмов,
использующих текущие цены инструмента.
Пока индикатор не покажет смену тренда, будьте уверены, что тренд продолжит свое направление.
Кроме этого, есть зоны принятия решения, которые ограниченны уровнями.В этих зонах будет

このユニークな自動トレンドラインドローイングインジケーターはすべての時間枠で機能し、短期トレンドの反転だけでなく、市場でより強い資産を示す短期トレンドブレイクアウトを簡単に取引するのに役立ちます。 それはあなたが激しいスイングのために早く入ることをユニークに可能にします。 入力には次のものが含まれます。
-マックスキャンドルはトレンドラインを振り返る
-線の種類と色
-外側のバンドまでの最大距離とバンド期間
-確認キャンドルまたは価格が閉じたときにピボットからトレンドラインを自動再描画するオプション低低または高高(ダブルボトム低および高サポート)および再描画の最大キャンドル数。
-改行の4つのオプション:
1)価格がラインを超えたときに削除する
2)削除しないでください
3)ろうそくがラインを超えて閉じたときに削除する
4)トレンドに逆らって閉じるときに削除する

Trend indicator based on a combination of moving averages.
Symbols : BTCUSD, GBJPJPY, GOLD, GBPUSD Timframes M5-H4
The main advantage: an additional algorithm of auto-optimization. The indicator can adjust its parameters for any financial instrument and any timeframe.
During auto-optimization, the indicator calculates tens of thousands of combinations and finds the one that gives the best series of profitable trades. The best parameters are set by default
Indicator settings can

An indicator for BUYs only, it is good to trade into the Crypto market and Indices or Stocks, for spot trader (non-leverage / 1-1) it is good to buy and hold for long-term and you can also use it to scalp on smaller time-frame if you receive a buy signal on higher time-frame, basically look for buys on smaller time-frame then, it purely depends on how you approach your trade, some people would take a top-down approach before taking a trade, and for leveraged trader it would be good to place stop

Ranging Market Detector scans the market for momentum and price to check whether the price is range- bound and the direction to which it will breakout. It works with all the all assets and visually shows you the instances when the market is either ranging or trending. Informs when the price has finished a retracement, an opportune time to re-enter the trend early. This will help you in position management. It works very well for Scalping, Day trading, and Swing trading. Helpful in all timefra
These are ideal entry points for quality The tool is quite easy to set up and use. The best options are set by default The tool was developed for the forex market ( it was also decided to test it on binary options and there is also a good result) The tool is suitable for both beginners and experienced traders and will be a great addition to your trading system or will become the basis for it Settings are just one parameter Perion Chanel = 1.0 This parameter filters out market noises and false le
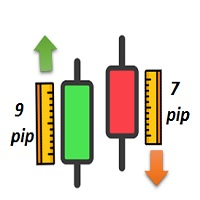
• Candle Length/Direction indicator •Show s the Length /direction of candle s : You can choose one of these two formulas to get the length/direction of candles in all time frames: 1- Open – Close 2- High – Low •Shows the Length of candles: It gives you a table showing the length of the candle of your choice in all time frames (in points). •Shows the Direction of candles: It uses color to indicate candles that are bullish (with positive points) or bearish (with negative points). • Add candle sh

This is a tool for trading binary options and Forex. Benefits No redrawing Accurate good signals Can be used with support and escort levels the result is a good strategy It can supplement any strategy as it perfectly determines the market reversal With cons There are unprofitable trades Parameters The best settings are set by default There are all the alerts you need to work comfortably with the instrument ...

The perfect tool for Scalng in the Forex markets You can trade both from signal to signal and using take profit The algorithm does not use Zigzag! No redrawing! This is a channel instrument that uses a moving average as a filter. Moving Average There are 2 parameters for the settings Ma Period = 5 period Moving Average Channel 1.0 distance of channel lines from the chart Price Signal Filter - calculation of signal opening and filter There is a complete set of Alert There is a multi-timefram

Индикатор отображает на графике другой популярный индикатор XO, представленный на рисунке в подвале. Важно! Сигнальным является 0 бар - не перекрашивается! Параметры индикатора: Zone Range (Pips) - размер зоны в пипсах без учета количества знаков; Line or Histogram Width - ширина линий или гистограммы; Zone Draw Type - способ отрисовки зон: в виде гистограммы или линий на графике; Up Zone Color - цвет зоны BUY; Down Zone Color - цвет зоны SELL; AlertsMessage - включение вывода со
シグナルコンプレックスAtlonは、矢印の形でシグナルを電子メールに送信し、通知を携帯電話にプッシュする既製の取引システムです。 Atlonは、既製のTPレベルも赤い四角で表示します。
システムは任意のチャート(通貨ペア、株式、暗号通貨、金属、石油)で動作します。
時間枠H1。
システムは再描画されず、矢印はどこにも消えません。
セットには、チャートにインストールする前にロードする必要がある既製の設定が含まれています。
設定をダウンロードする
システムパラメータ:
バー単位のスペクトルサイズ-バー単位のスペクトルサイズ。
ポイント単位のスペクトルサイズ-ポイント単位のスペクトルサイズ。
ノイズ-ノイズ
最大バー-バーの最大数
TPを表示-TPを表示するかどうか。
フィルタTF-選択した時間枠を分析に使用します。
ディスプレイでのアラート-チャートにシグナルを表示します
モバイルMT4にプッシュ-電話に信号を送信する
メールを送信-電子メールに信号を送信します
Great indicator for binary options!
Try what he can do!
Alert is arranged in it so that you are not late with the signal!
You can also customize the periods that suit you! (it is configured for currency pairs)
If you want more, you can always reconfigure and use more!
arrow indicator that works on several indicators, in the settings you can change the color of the arrows and the period! (repeat)
Test it and see it in action!

Hot option premium - A reliable dial indicator that does not draw and shows accuracy.
The signal appears on the previous candle.
Very easy to set up, select a currency pair and adjust the frequency of signals in the “period” settings.
You can also customize the color of the candle yourself; the default is:
-Blue arrow up signal
-Red arrow down signal
Hot option premium is multi-currency and works on all charts.
A very large percentage of good deals.
The best timeframes are M1-M5
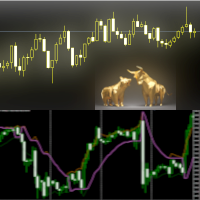
The Trends Change indicator can be used as an anticipator of the next trend, preferably confirmed by Price Action or another oscillator (RSi, Stochastic ..).
Great tool for indices, currencies and commodities.
It works on every timeframe.
Parameters
Range : setting to determine the speed of the indicator
Line_Up : higher RSI value
Line_Down : lower RSI value
Show_Bands : if TRUE shows RSI lines
MaxBars : analyzed bars
Change_Alert : pop-up alert Send App Notification: send

CFF Bounced Trader Signals This is the most accurate reversal indicator for MT4 providing accurate signals to enter a trade without redrawing or delays. It can be applied to: commodities Only. The best results are on the timeframe M5+
IMPORTANT! Contact me after your purchase to get the detailed guide.
Benefits of CFF Bounced Trader Signals indicator
Entry signals without repainting or delays If a signal appears and is confirmed (if the signal candle is closed), it does NOT

This is a powerful indicator that is very easy to work with. Its default setting is for the euro-dollar pair, but with the right settings it can be used in all markets and all time frames less than daily. The basis of the work of the Ranging indicator is to find areas of price range and get signals from it. You can specify the duration of the valid sufferings and the minimum and maximum price in it. It is also possible to determine the number of reliable signals received from each range.
Othe

FTFC は、Rob Smith の The Strat で定義されている Full Timeframe Continuity を指します。 このインジケーターはチャートに 2 本の線を引きます。四半期、月次、週次、日次、または時間次の開始レベルの最高値の 1 つと、これらの値の最低値の 2 つ目です。これにより、取引が一方向に非常に強くなる可能性が高いチャネルより上または下のチャネルが得られます。ライン間では、価格アクションが途切れ途切れになり、より広いストップを使用する必要がある場合があります. 高値と安値の中間点を示すために、3 番目の破線も描画されます。これは、市場が価格を特定の方向に押し上げようとするため、サポートまたはレジスタンスを見つけるのに適した場所です。色を NONE に設定して選択すると、この行をオフにすることができます。
設定 四半期ごとのレベルを含める 一部の人々はそれを無視することを好むため、四半期の始値を計算に含めることを選択できます。 IncludeCurrentTimeframeOpen true の場合、現在表示されている時間枠が H1、D1、W1
Big changes in prices (dips) can be opportunity for entering trend reversal trades. Dip histogram shows these big price movements. User can define minimal movement in %, as well as timeframe which will be used for calculation of price movement. Dip histogram input settings: Dip period - timeframe which will be used for price change calculation Price to compare - price type to compare Indication method - percent (alert when price movent is > min. dip in %) / Dip MA (alert when price movement

Introducing the Trend Detection System: Your Key to Unveiling Market Trends with Precision.
The Trend Detection System is a sophisticated MetaTrader 4 indicator meticulously engineered to equip traders with the tools needed to identify and ride market trends effectively. Built upon customized Moving Average principles, this innovative indicator offers unparalleled flexibility and accuracy in trend analysis.
Key Features: 1. Customized Moving Average: The Trend Detection System allows users t

Advanced Trend Breaker Free Dashboard!!! Advanced Trend Breaker DashBoard: https://www.mql5.com/en/market/product/66336 Breaker's smart algorithm detects the trend,Support and resistance, filters out market noise and find entry signals!!! Test the demo version and explore its features, it would be useful tool added to your trading arsenal. Do not foget down load Free DashBoard!!! Advanced Trend Breaker DashBoard !!!
Advantages You Get Easy, visual and effective trend detection. Support a

This indicator has two objects, a Lime and Red Point. This indicator takes and combines several built-in indicator functions / requirements and creates more conditions Lime indicates an uptrend and a red downtrend. This indicator reads the total rates in all timeframes and displays the amount in the comment. The likelihood of a correct prediction increases when two dots of the same color are close together. Thank you for visiting, good luck

Black Leopard indicator is a trend indicator which will compliment any strategy.
Features The movement direction of the moving average is indicated by the colors (blue for upward slope, red for downward slope) It does not change color after the candle close. It works on many instruments like forex, metals, stocks, indexes... and on all timeframes Alert function included : email alert, sound alert, and push notification.
Indicator parameters Period: the averaging period Price: type of price

Important notice: Have to be installed altogether with YAHMA indicator [ https://www.mql5.com/en/market/product/66389 ]
Absolutely not as simple as SMA, however, using is still as simple as any other moving averages.
Moreover, you can be informed what is going on higher time frames, where are more important zones.
Minimalist parameter set: Higher Time Frame: (default: H1)
Period: number of calculated bars; the larger, the smoother (default: 200, minimum: 4)
MA method: use LWMA o

Hi friends! Introducing the Currency Strength Indicator Currency Scanner ! The indicator tracks the strength level (percentage) of currencies The indicator allows you to create a picture of 28 currency pairs You can manually track the strength in the table. Strength is indicated as a percentage. Also on the side of the table, the recommended trading pairs will appear, on which you can perform a trading operation. This does not oblige anything and you can only cool down the tools that you need.

市場はラウンド数を非常に好み、下落市場ではサポートとして機能し、価格が上昇するとレジスタンスとして機能することがよくあります。 この指標は、ラウンド値で価格レベルを描画するように設計されています。これは自動的に行われますが、それをオーバーライドして表示するレベルを決定するオプションもあります。 ラウンド レベルは、10、20、30 などの 10 のステップと同じくらい単純にすることができます。また、外国為替を使用している場合は、0.1 または 0.01 での変化を見たいと思うかもしれません。 インジケーターは、メジャーとマイナーの 2 つのクラスの線をそれぞれ異なる形式で描画します。これにより、レベルの 2 つの異なる変化の間の変化を同時に見ることができます。
アラート
このインジケーターには、価格が設定可能な距離内にある場合に、メジャー、マイナー、または両方の価格レベルでアラートを鳴らす機能が含まれています。
自動セットアップ デフォルトでは、指標はメジャー価格とマイナー価格の両方の適切なレベルを決定します。これは、いつでも画面に表示する行数を制御する構成可能な Densi
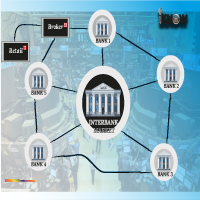
IPDA AND PD RANGES. Interbank Price Delivery Algorithm (IPDA) Range Liquidity and trades in the FX market take place in a decentralized manner as banks, brokers and electronic communication networks (ECNs) interact with one another to set prices. In FX, and ECN is a trading platform or electronic broker that hosts bids and offers and transmit them to users worldwide. ECN broadcasts a price around the world as various participants leave orders to buy and sell. Banks provide streaming prices base

Channel indicator based on the principles of mathematical statistics. It uses neural networks to simplify a lot of complex calculations, which makes the indicator fast, even for weak computers.
How it works The indicator is based on the moving average, the period of which you can set. The indicator analyzes price deviations from the moving average line for the last 1440 or 2880 bars, and each line indicates a certain probability of a price reverse depending on the selected settings: Standard,
RSI tells you oversold and overbought levels, but how can you handle with trending markets with RSI? Solution is CFX Adaptive RSI that recalculate oversold and overbought levels according to a moving average.
Indicator parameters: - RSIPeriod: Period of RSI. - Sensibility: high value means that indicator will be more sensible to trending market. Low value means that indicator will be less sensible to trending market. - MAPeriod: Period of the moving average - TotalHistory: number of candles in

Price Action Trading is an indicator built for the "Price Action" trading strategy. The indicator shows the points of the change in the direction of price movement, the direction of the trend, the dynamics of the trend, the distance traveled in points from the beginning of the change in the trend. This information is enough to trade and get good results in Forex. The Price Action Trading indicator has proven itself very well on GBPUSD, XAUUSD, EURUSD and other major currency pairs. You can inst

CMA dashboard is designed to help traders in identifying trend on multiple timeframes and symbols. It displays a clear state of the overall trend at one place without the need to navigate between different charts and timeframes. This saves time and makes decision making process fast so that potential opportunities are not missed. It is based on Corrected moving averages available here Features
Parameters for signal optimization Inputs for multiple timeframes and symbols Usage Higher timeframe
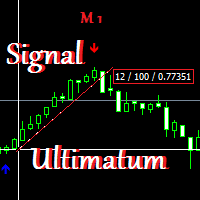
The tool is quite simple to set up and use. The best options are set by default The tool was developed for the forex market The tool is suitable for both beginners and experienced traders and will be a great addition to your trading system or will become the basis for it the tool uses support and maintenance levels in its algorithm This is our own strategy and unique development signals up arrow buy down arrow sale recommended for use on timeframes from m 30 you can trade from signal to signal
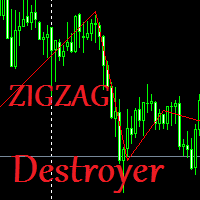
The indicator shows real waves based on alternating upper and lower extremes of the price chart, thus displaying the wave structure of the market. The algorithm of this indicator is absolutely new, everything that connects it is only its appearance, it is based on radically different algorithms and is able to calculate volumes in the market in real time. The wave detection algorithm has nothing to do with ZigZag. The indicator will be very useful for traders trading on the basis of wave analysis
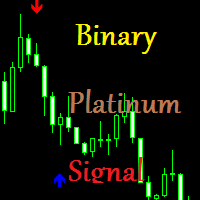
A good and reliable tool if you follow the rules of money management. does not redraw Developed according to its own strategy on a unique algorithm. The indicator is completely sharpened for binary options very easy to use Just add it to the chart and you can start trading Perfect for both beginners and experienced traders. The signals are simple and straightforward. Up arrow buy. Down arrow for sale. Recommended time of expiration is from 1-2 candles. For one transaction, no more than 3% of the

MultiTrendLines - мультивалютный индикатор для автоматизации графического анализа трендовых линий. Позволяет быстро выполнять трудоемкий анализ трендовой ситуации на рынке. Использует точные математические алгоритмы выделения ключевых точек рынка для извлечения трендовой струкртуры инструмента. За счет применения корреляционных сигналов можно улучшить симметричную оценку поведения инструмента. Включает в себя возможность точно задавать необходимый уровень глубины и угла трендовой линии. Основной
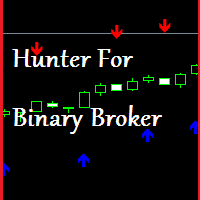
Hunter For Binary Broker Binary Options Broker Hunter does not redraw expiration time 1-2 candles timeframes M 1 - M 5 the signal appears on the current candle at the moment of its opening the signal accuracy is close to 80%. the indicator uses modified Moving Average signal to buy and sell - arrows of the corresponding direction upwards in blue and downwards in red directed upwards or downwards settings period calculation method open price and alert for any questions of interest, please contac
the indicator is designed only for binary options settings are not brought to ideal at the moment different parameters are being tested at the moment the tool gives quite accurate and good results for newbies in binary options may not be a bad start for professionals a good addition to the existing strategy and experience signals. blue dot from below buy. red dot on top sale.
Radically new perspective on binary options trading . This is New Binary Horizon it was originally . created for binary options and it came out good accuracy no redrawing. an alert will be available in the next update. and the algorithm itself has been improved. at the moment, the tool is more than willing to work with it on binary options. it perfectly recognizes both the smallest and the largest levels. easy to work. can be used by both a professional and a novice without bothering in search o

Auto Level this tool is able to determine the levels of support and resistance. search and display when the price has broken through the level and when it pushed off from it. the indicator can be useful if you use resistance support levels in your trading. or the highs and lows of the price, then it will greatly simplify your work and help you more quickly and more accurately determine the rebound or breakdown of the current trend or tendencies level. blue line bottom uptrend red line on top dow

Talking about Zen
"Talking about Zen" is an investment theory of the Internet celebrity " Talking about Zen " on the securities market. His theory seems to be suitable for all volatile investment markets, such as stocks, warrants, and futures. " Talking about Zen " is a technical analysis theory based on morphology and geometry. The trend of any investment market, the trend of any investment market, is essentially like two leaves that cannot be copied and will not be exactly the same, but the

Simple Long Short Bar A very concise and clear indicator, very easy to understand, but it is very useful for tracking trends. The usage of this indicator is very simple: Long signal: If the price shows signs of a long market, then a yellow box will appear. Short signal: If the price shows signs of a short market, then a blue box will appear. Bull strength: If the size of the box is large, it means the bull strength is strong, and vice versa. Short strength: If the size of the box is small, it m
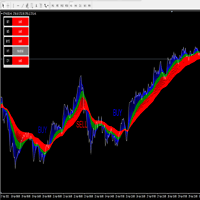
The ORM indicator is very effective in identifying changing trends, breakouts, and trading opportunities in Forex, Stocks, and commodities. It gives at a glance a clear picture of the marked. ORM makes it easy to see the beginning of a trend, the end of a trend, and when there is a consolidation period. ORM identifies three groups of traders: The blue belt is the day traders, the green belt is the swing traders, the red belt is traders that hold their position for a longer period of time. When t

The Alligator indicator uses three smoothed moving averages, set at five, eight, and 13 periods, which are all Fibonacci numbers. The initial smoothed average is calculated with a simple moving average (SMA), adding additional smoothed averages that slow down indicator turns. Scan all your favorite pairs with Alligator, and get notified on your preferred time frames.
Setting is Customizable
Click to change time frame or open new pairs
Notification: Phone/Popup/Email
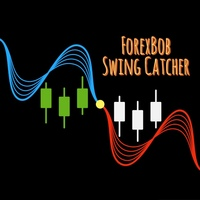
ForexBob Swing Catcher :- Is an ultimale and simple to use indicator for all traders type. It consist of various filters and Moving Average to make it familier to traders and easy to use. It changes color from Blue to Red & Red to Blue on default settings for entering buy n sell trades with tested efficiency of 90-95% on higher time frames >= H1.
Inputs : Moving Average period 50,100 or 150 depend on trader's need. MA method 0 for Simple Moving Average, Default setting is 1 (EMA - Exponential

This indicator Allow you to get notification from 7 indicators. Scan all your favorite pairs with your favorite technical indicator, and get notified on your preferred timeframes.
Settings are Customizable
(RSI, ADX, MACD, Alligator, Ichimoku, Double MA, and Stochastic)
Click to change the time frame or open new pairs
Notification: Phone/Popup/Email

This is a strategy builder indicator. It consists of almost all the technical indicators. Include notification and Buy/Sell arrows, Automatic Support and Resistance, and Sideways Detection (MT5 version does not include Sideways Detection and only one type of Support and Resistance).
The indicator includes: MACD (Moving Average Convergence Divergence) RSI (Relative Strength Index) Stochastic CCI (Commodity Channel Index) ADX (Average Directional Moving Index) PSAR (Parabolic Stop and Reverse)

My Strategy Scanner (The only indicator you need for forex trading). My Strategy Scanner allows you to create your own strategy and scan all the timeframes, and pairs at the same time. It comes with support and resistance zones, trend lines, and sideways detection. (MT5 version does not include Sideways Detection).
The indicator includes: MACD (Moving Average Convergence Divergence) RSI (Relative Strength Index) Stochastic CCI (Commodity Channel Index) ADX (Average Directional Moving Index)

A stochastic oscillator is a momentum indicator comparing a particular closing price of a security to a range of its prices over a certain period of time. The sensitivity of the oscillator to market movements is reducible by adjusting that time period or by taking a moving average of the result. It is used to generate overbought and oversold trading signals, utilizing a 0–100 bounded range of values. Scan all your favorite pairs with Stochastic, and get notified on your preferred timeframes.

This indicator allows you to view multiple timeframes at the same time on the same chart. It will save you time. No need to switch from timeframe to timeframe. You can see all that is happening in each timeframe on the same chart.
Customizable bars to view Customizable bars to Timeframes to view Customizable bars colors Timeframe views are - M1, M5, M15, M30, H1, H4, D1, W1, and MN

Chinetti pip collector XL is a complete turnkey trading system. If a trader does not yet have his own trading system, he can apply Chinetti pip collector XL to trading. Trading with this indicator is very easy. Even a beginner in Forex can handle it.
Trading rules: wait for the indicator to start drawing a blue line. This means that the price trend is starting now. Now we are waiting for the indicator to analyze the market and draw an up arrow on the chart. At this point, we open a buy order.
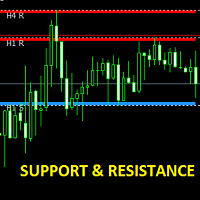
Indicator shows the hourly, 4-hour, Daily, Weekly and Monthly support and resistance zones on the chart you choose. Even if the time frame of the chart changes, the support and resistance zones will continue to be unchanged. It is an indicator that should be kept on the chart of manual trades and shows them the support and resistance zones in the upper time frames.
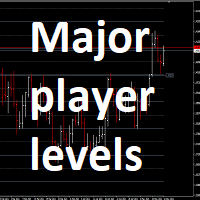
Индикатор помогает трейдеру видеть сильные торговые уровни поддержки- сопротивления от которых цена меняет направление движения ,и облегчает процесс принятия решения в торговле делая её более прибыльной,работает на всех таймфреймах, лёгок в использовании, гибкость настроек под индивидуальность стратегии ,настройка основных и второстепенных уровней поддержки,сопротивления по толщине и цвету,не затрудняет работу компьютера и терминала,применим ко всем торговым инструментам имеющимся в перечне торг
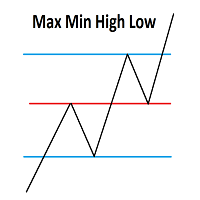
Данный индикатор облегчает торговлю трейдеру использующему в торговле ценовые уровни вчерашней торговой сессии и окрытие сегодняшней торговой сессии показывая на графике вчерашние ценовые уровни High/low и цену Open текущего дня,подходит для всех торгуемых инструметов ,а так же для криптовалют , индикатор мульти таймфреймовый что делает его универсальным и применимым ко всем инструментам вашего брокера , касание дневных уровней вы можете использовать в вашей торговле как внутри дня так и в бо

マーケットシェーバー マーケットスカルパー このインジケーターはRPTradeProSolutionsシステムの一部です。
Market Scalperは、プライスアクション、ダイナミックサポート、レジスタンスを使用した毎日のトレンド指標です。 誰でも使用できるように設計されており、トレーディングの初心者でも使用できます。 決して塗り直さないでください。 表示は近いものから近いものへと示されます。 単独で使用するように設計されているため、他のインジケーターは必要ありません。 明確でシンプルな表示を提供します
どのように機能しますか MarketShaverはDualTimeFramesシステムを使用しています。 主な傾向はより高いTFによって取られますが、より速いものは取引を閉じるために使用されます トレードは1つずつ示され、同時に2つのトレードが存在することはありません。
マーケットシェーバーは次のことを示しています。 いつ取引するか いつそれを止めるか、利益か損失か。 貿易報酬 適切な期間終了TFを設定するのに役立つ多くの統計 マーケットシェーバーは動作します
Allows you to find the average volatility / expected price movement for ANY custom period starting at ANY time of day. Simply set a vertical line at the desired entry time and calculate your TP target within the expected volatility range. Indicator places 5 custom vertical lines on chart at the same times each day throughout the history + gives live alerts with custom text each day. 1. Get the average price movement / volatility of ANY time period starting at each vertical line, so you know h

Get alerted (and see on the chart) when a zigzag leg break occurs!
Indicator works in real time, alerting and cleanly displaying when price closes beyond the last high/low zigzag. This is important to confirm a trend is evolving in a healthy manner: To confirm a trend is evolving in a healthy manner, not only do we need to see price moving higher/lower than its previous high/low, we also expect to see at least two closes beyond that high/low as further evidence that the market is accept
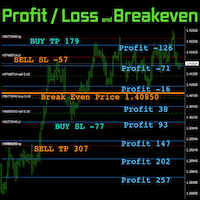
FIC PL Break Even は、あなたのトレードにおける一番大切な「資金管理」を容易にします。 複数のポジションを持つと、どのレベルの価格に到達したときに、それらの損益、また合計の損益が幾らになるか、把握することが困難になります。 FIC PL Break Even は「損益」と「損益分岐点」をインジケートし、あなたのトレードをサポートします。
こちらのサイトもご覧下さい https://www.funda-prime.com/jp/fic-pl-breakeven-mt4-via-mql5 その他、MQL5で販売されていない製品はこちら https://www.funda-prime.com/jp/product/ ---------- 動作確認済み口座通貨は USD/JPY/EUR スワップ、手数料は計算に含まれません ポジションの状況により損益分岐点が表示されない場合があります。 画面解像度(スケール)により、フォントが正しい表示をされない場合があります。この場合、パラメータ「FontWidth_Adjust、FontHeight_Adjust」を調整してください。

Индикатор Average Profit будет полезен скальперам, локерам, поклонникам Мартингейла, а также тем, кто открывает много сделок в течении дня. Посмотрите видео внизу, там подробно показана работа этого информационного индикатора. Индикатор показывает уровень безубытка по нескольким ордерам, а также показывает прибыль или убытки на разных ценовых значениях. Есть возможность показа на графике ранее закрытых ордеров, как в тестере стратегий. Индикатор ATR DAY показывает средний дневной диапазон движен

9 out of 10 copies left at $100 after that price will double ($200) ! so hurry
This indicator is a mean-reversal type of indicator. Meaning it will not follow a trend but rather make profit from a change in price direction, when the price extends from it mean, but to come back to it later on. This indicator is 100% NON REPAINT and will not redraw its arrows once they appear. Each arrow is drawn at the close of the candle, not during the life of the candle. No parameters, only alert parameters.

The Piko Trend indicator can be used both for pipsing on small periods and for long-term trading. Works on all currency pairs and on all timeframes. The Piko Trend indicator shows signals for entry. Displays both entry points and the trend itself. Shows statistically calculated times to enter the market with arrows. Using the indicator, you can optimally distribute the risk coefficient.
Using the indicator. Uses all one parameter for settings. When choosing a parameter, it is necessary to vis

Trend Protection Indicator Uses one parameter for settings. Currency pairs never rise or fall in a straight line. Their ups and downs are interspersed with pullbacks and reversals. The indicator does not redraw and does not lag, it shows points for entering the market, points of potential market reversal.
Every rise and every fall is reflected in your emotional state: hope gives way to fear, and when it passes, hope reappears. The market uses your fear to prevent you from taking advantage of
MetaTraderマーケットは、開発者がトレーディングアプリを販売するシンプルで便利なサイトです。
プロダクトを投稿するのをお手伝いし、マーケットのためにプロダクト記載を準備する方法を説明します。マーケットのすべてのアプリは暗号化によって守られ、購入者のコンピュータでしか動作しません。違法なコピーは不可能です。
取引の機会を逃しています。
- 無料取引アプリ
- 8千を超えるシグナルをコピー
- 金融ニュースで金融マーケットを探索
新規登録
ログイン