YouTubeにあるマーケットチュートリアルビデオをご覧ください
ロボットや指標を購入する
仮想ホスティングで
EAを実行
EAを実行
ロボットや指標を購入前にテストする
マーケットで収入を得る
販売のためにプロダクトをプレゼンテーションする方法
MetaTrader 4のためのテクニカル指標 - 40

The indicator displays information about:
the name of the currency pair and timeframe. current price bid. time before the close of the candle. the current difference between the ask and bid (spread). Trading volume stats can also be displayed.
Displayed data
Name, account number, and account currency. A deposit in the account currency. Balance at the current time and a percentage of the balance. Current profit and its percentage. Current transaction and the percentage of the total deposit.
FREE

GM Reverse Indicator works on Fibonacci along with some other tweaks
-> It is programmed to automate 100% when the market fluctuates This indicator I use to find support points. It really works and I want to share it with you.
-> Simply attach the GM Reversal Indicator to any chart you want. The larger the timeframe, the better the signal quality (you should use with the timeframe from H4) -> This is my signal : https://www.mql5.com/en/signals/1415444
Please leave me a positive review, if
FREE
This indicator is a moving average built using the classic Stochastic oscillator and ATR. The change in the direction of the moving average depends on the Stochastic oscillator overcoming its average value and leaving the price beyond the range determined using the ATR. The indicator is not redrawn on fully formed bars. The indicator values on a bar that has not completed its formation may change.
The application of the indicator is identical to the application of the standard moving average
FREE
The indicator identifies the strength of the trend based on the points where the MFII indicator exceeds the overbought and oversold levels. The indicator does not redraw. This indicator:
Suitable for all markets; Not redrawn; Intuitive and simple; It can be useful for both beginners and experienced traders; Allows you to identify market entry points where there is a high probability of a significant price movement sufficient for a successful transaction; Settings: Ind_Period (>1) - period o
FREE

MQLTA Instrument Details shows you in an easy to read in chart table the details about the instrument/Symbol, including: Label Trade Mode Default Contract Size Minimum Size Maximum Size Size Step Digits Used Tick Size Tick Value Stop Level Bid Ask Spread
Parameters Indicator name to create the objects Default Window when opening the indicator Horizontal offset Vertical offset If you like this tool please take a minute to leave a review. If you have suggestions to improve it please send me a me
FREE
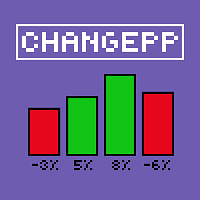
About the ChangePP indicator
The ChangePP indicator displays the percentage price change for the selected period according to the selected parameters and builds the corresponding bars in the indicator subwindow.
Clicking on a bar or pair name opens the corresponding chart with the period specified in the input parameters.
Without a doubt, the ChangePP trading indicator will be useful for traders using the correlation of currency pairs, as well as for analyzing the situation on the market.
FREE
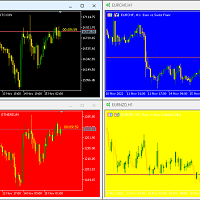
Hello again This is a free indicator that provides you with a panel at the corner of your chart to change your background. If you want to hide it, you should click on the minimize button above the buttons. Let me know what other free indicators you need! If those are easy I will make them for you ;) Many other tools are in the row. So wait and look! Hope to Enjoy it Sepehr (Faran)
FREE

Всем добрый день, Это Вадим Сергеевич Лепехо. Выложил на общее обозрение очередной свой продукт(индикатор). Индикатор прост. В этом индикаторе я добавил формулу расчета точек входа. Сам индикатор я скачал в бесплатных индикаторах в mql mt4: arrows_template(шаблон стрелок). В свойствах, описании индикатора я указал имя автора. Суть индикатора рисует стрелки, знаки куда ходить, что делать и т.д...... Стратегия входа построена на пересечении двух 'машек' (MA) с разными периодами. Данный индикатор н
FREE
The indicator marks control points on the price chart, overcoming which by the price is a signal to open a deal. At the points marked by the indicator, the maximum or minimum price values go beyond the price channel built on the basis of price values for a longer period. After overcoming such points, the price is likely to continue moving in the same direction. The indicator does not redraw and, despite its simplicity, can be quite an effective trading tool.
Adjustable parameters: i_Period
FREE
The product is based on J.F. Ehlers' Center of Gravity indicator. Center of Gravity actually has a zero lag and allows to define turning points precisely. The indicator is a result of Ehlers' research of adaptive filters. It identifies main pivot points almost without any lag. The indicator displays the COG oscillator in a separate window.
Parameters: Length - indicator calculation period. MaPrice - price used to calculate the indicator. Signal - indicator display options. The indicator does
FREE
This indicator displays DSS Bressert AM signals on the price chart. The calculation of DSS Bressert values is similar to the stochastic indicator. The confirmation of the indicator's signal is the overcoming by the price of the high/low of the bar on which the signal was given by the indicator. Settings: Price - the price at which the indicator is calculated; EMA_Period - smoothing period; Stoch_Period - oscillator period;
OB_Level - overbought level; OS_Level - oversold level;
Show_Move -
FREE

Volume Levels is a very important indicator for exchange trading. Most of the trades were performed on those levels. This indicator displays the price level that had the most trade volumes over a certain period of time. Often, the price bounces from those levels in the future, and it can be successfully used in trading. This is a demo version that works only on the USD/JPY currency pair. To work on all currency pairs, install the full version: https://www.mql5.com/en/market/product/15888
Param
FREE
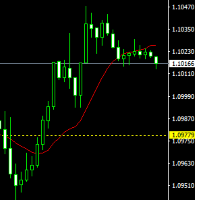
The indicator draws lines (with line objects) to the close prices of the previous day close, on selected timeframes. The indicator uses the closing price of the past day to draw a horizontal line, it can help you determine the direction of the market at the moment, which is necessary for making trades.. Parameters
Line Color Line style Line width Set on the top
FREE

Индикатор показывает: открытые ордера по инструменту; количество ордеров; профит по Buy и Sell каждого инструмента; суммарный профит. Количество строк и столбцов по инструментам определяется автоматически, в зависимости от ширины окна. Индикатор обновляется по таймеру, время обновления задается в настройках. Устанавливать индикатор можно любой график вне зависимости от ТФ и пары. Клик по названию инструмента переключает текущий график на выбранный. Совместно со скриптом https://www.mql5.com/ru/
FREE

I present to you the Profi Arrows indicator. The indicator is based on non-standard Moving Average indicators. It represents the input signals in the form of arrows. All signals are generated on the current bar. It is maximally simplified to use both for trading with only one indicator and for using the indicator as part of your trading systems. There are 2 operating modes in the indicator. Option with redrawing the signal, and without. In the mode without redrawing, the option of redrawing the
FREE

The Moving Average Slope (MAS) subtracts the moving average level n-periods ago from the current moving average level. This way, the trend of the moving average can be drawn on the moving average line.
Features Observe uptrends and downtrends at a glance. The indicator is non-repainting. Returns buffer values for the trend of the moving average to be used as part of an EA. (see below)
Inputs Moving Average Period : The period of the moving average (MA). Slope Period : Number of periods betwe
FREE

The indicator informs when the current bar closes and a new bar opens. TIME is an important element of trading systems. BarTimerPro indicator helps you CONTROL THE TIME . Easy to use: place on the chart and set “alarms” if it necessary. In the tester, the indicator does not work. Key Features
Shows the time elapsed since the opening of the current bar Indicator Updates Every Second Setting the appearance (31-36) and the location (21-24) of the indicator, changing all texts (41-50). 4 types of
FREE

With the SR Dashboard, you get a powerful tool to control some of the most important information in trading. Assemble a setup according to your strategy and get informed as soon as this setup is valid. Assign scores to defined conditions and let the Dashboard find them. Choose from Trend, Average Daily Range, RSI, Moving Averages, Pivot (Daily, Weekly, Monthly), Highs and Lows, Candlestick Patterns.
Note: This indicator is the free version of the Netsrac SR Dashboard. This version only support
FREE
The Slope is an MT4 indicator that calculates the slope of the price, and draws a histogram so you could see when it's positive, negative, or ranging.
Key Features: Calculates Slope of the Line Chart Shows the numbers as a Histogram below the chart Choose Different Periods for calculating the slope. Sends Alerts and Push Notifications when slope changes direction Settings:
CalculationPeriod: The number of bars used to calculated the slope ( for example, if CalculationPeriod = 10, The Slope
FREE

Highly configurable Demarker indicator.
Features: Highly customizable alert functions (at levels, crosses, direction changes via email, push, sound, popup) Multi timeframe ability Color customization (at levels, crosses, direction changes) Linear interpolation and histogram mode options Works on strategy tester in multi timeframe mode (at weekend without ticks also) Adjustable Levels Parameters:
Demarker Timeframe: You can set the lower/higher timeframes for Demarker. Demarker Bar Shift: Y
FREE
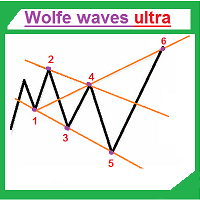
Wolfe waves ultra draws Wolfe Waves automatically. The indicator searches for the Wolfe Waves on three timeframes. This indicator is especially accurate because it waits for a breakout in the wave direction before signaling the trade, resulting in a very high winning ratio.
Features Amazingly easy to trade. The indicator is able to recognize all Wolfe Wave patterns in a specified interval. Thus, we check each extremum for the potential 1,2,3,4,5 points apart from ZigZag vertices. The indicator

The indicator builds alternative quotes based on the average price of a bar and shadows for a specified period of time or according to a fixed body size.
Options:
StartDrawing - the date from which the indicator will build quotes;
PerCounting - period for calculating the average body size and shadows. If AverageBody = 0, then it builds at an average price;
AverageBody - fixed candlestick body size. If greater than zero, builds on this parameter.
FREE
The presented indicator marks signals on the price chart with arrows in accordance with the data of the FATL Momentum AM indicator. The indicator gives a signal and sends a notification to the mobile terminal and email. The FATL Momentum AM indicator is the difference between the current price and the price some number of periods ago. The difference from the classic indicator Momentum is the preliminary smoothing of prices by an adaptive digital filter - FATL. Confirmation of the indicator signa
FREE

Add indicator "Symbol Name Drawer " on chart. Indicator creates text object with name of current symbol.
You can change symbols on chart and indicator automatically changes text.
Free to use. Simple tool.
If you have any suggestion you can write me about it in comments. I try to improve this tool in future versions. Thanks for using my indicator. If you want to order something special in mql4 or mql5 message.
FREE

IMP
The Panel presents a number of indicators in abbreviated form: 2 oscillators, 2 trend and 1 volume indicator. Location - upper left corner.
Indicators values and colors can be customized by the user. Combined with other market analysis, can greatly improve trading results. This Indicator is a suitable tool for beginners and professional traders as one.
Metta Trader 4 Indicator Version _1.0
FREE
The indicator is a complex of MACD and OsMA, built according to the complex of several popular oscillators. This combination allows you to get the best out of both types of indicators. On the one hand, a quick response to changes in the market environment, on the other hand, effective market following and noise filtering. The indicator values on a fully formed candle are not redrawn.
FREE
This indicator displays RVI indicator signals. The main point of Relative Vigor Index Technical Indicator (RVI) is that on the bull market the closing price is, as a rule, higher, than the opening price. It is the other way round on the bear market. So the idea behind Relative Vigor Index is that the vigor, or energy, of the move is thus established by where the prices end up at the close. To normalize the index to the daily trading range, divide the change of price by the maximum range of price
FREE
The indicator displays in the form of a histogram the difference between the current price and the price for the previous period. A similar method of market analysis is used in the classic Momentum indicator. At the same time, the presented indicator uses the primary data smoothing by the Laguerre filter, which allows maintaining the sensitivity of the indicator and minimizing the "noise". The indicator signals are: Histogram crossing 0. Change of signal line direction.
FREE
RSTL dpl AM - (Referense slow trend line - detrended price line) indicator built on the principle of searching for discrepancies between the current real price and the calculated trend value. RSTL - a digital filter that calculates the reference line, the overcoming of which by the current price is considered a change in the long-term trend. Indicator signals: Small red dot - the price continues to fall; Small blue dot - the price continues to rise; Big red dot - the price starts to fall; Big bl
FREE

Tick Speed Free povides a on-chart label of tick speed to allow you to see the ebb and flow of market activity. Observing rises and falls in tick speed may allow you to better time entries to reduce slippage and re-quotes.
Options include: - colores for low-mid-high tick speeds - placement and styling - prefix & suffix to customise the speed label
Troubleshooting: - Note, in the tester environment, tick timings are limited to what is supplied by the tester environment and it's speed
- If
FREE
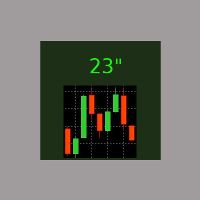
It is the simplest indicator in existence. It has only one function: report the seconds elapsed since the last minute end in a very convenient way, with a label that can be moved in the chart, so that the trader does not have to take his eye off the forming candle. It is used on M1, but also on larger intervals, for those interested in opening/closing positions at the best time. Sometimes an intense movement in the last 10" of the minute gives indications of future trend, and can be used for sc
FREE

The Cossover MA Histogram indicator is a simple tool showing the trend based on crossover of moving averages. Simply specify two mobving averages and addicional parameters like MA method and Applied price. When fast MA is above slow MA the histogram is green, indicating an uptrend. When MA fast is below MA slow the histogram is red, indicating an downtrend.
FREE

SkyNet EMA is an indicator will assist you by suggesting when to go long or short based on price action and the crossings of Exponential Moving Averages such as 14 period and 50 period. Just attach it to your chart and it will monitor the asset for potential sell opportunities and if found will paint a red arrow in your chart. Also will try to find buy opportunities and if found will paint a green arrow in your chart. It could be used with any currency but majors are recommended since they will
FREE

Индикатор вычисляет наиболее вероятные уровни возврата цены. Может быть использован для установки уровня тейк профит. Рекомендуемый таймфрейм - любой, при соответствующей настройке. Настройки.
Period - количество свечей для анализа. Accuracy - точность расчёта уровня в пунктах. Width - размер ценовой метки. Отработка уровней как правило не занимает много времени, уровни достаточно точны при касании и процент возврата цены к ним достаточно высок. Но следует учитывать риск продаж на локальных ми
FREE
Binary Options Assistant (BOA) CHILL Signals Indicator provides signals based on Katie Tutorials Binary Options Strategy. Indicators: 3 Moving Averages & RSI
Use any of the BOA Signals Indicators with the Binary Options Assistant (BOA) Multi Currency Dashboard so you can:
Stop missing trade set-ups Stop jumping from chart to chart looking for trade set-ups Get all the signals on 1 chart All BOA Signal Indicator settings are adjustable to give you more strategy combinations. The signals ca
FREE
The indicator generates signals for opening positions. The principle of operation is to compare the current closing price with a range of average prices over a longer period. The signals are confirmed when the price exceeds the High/Low of the bar where the indicator generated the signal. Maintenance of an open position is carried out on a smaller TF. Indicator signals to open an opposite position on a smaller TF are a signal to close the deal. This indicator does not repaint or not recalculat
FREE

An improved version of the standard Standard Deviation indicator.
It is now a responsive and smoothed line.
The setup is not straightforward - but I hope you can do it.
It is very easy to understand the readings of this indicator, the meaning is the same as that of the usual Standard Deviation.
//////////////////////////////////////////////// ///////////////////////////////////
I hope this indicator will be very useful to you in successful trading.
Good luck.
FREE

Добрый День, всем привет, здравствуйте. Я. трейдер, 20 лет опыта, Вадим Сергеевич Лепехо. Создал этот индикатор на базе уже готового стрелочного индикатора (arrrows_template). Решил с вами поделиться с наработками. Данный индикатор рисует стрелки по стратегии: "Тринитти". Индикатор выдает сигнал на вход когда rsi ниже 50; AO ниже 0; и Price ниже MA9-ход делаем вниз. Индикатор выдает сигнал на вход когда rsi выше 50; AO выше 0; и Price выше MA9-ход делаем вверх. Предлагаю на демо-счете протести
FREE
Your attention is invited to the indicator Price Action Indicators. It doesn't need settings. And also it is not tied to more than one indicator, which makes it not vulnerable to different accounts or brokers.
Add one setting PERIOD
Regards, Mikhail
Вашему вниманию предлагается индикатор Price Action Indicators. Ему не нужны настройки. А также он не привязан не к одному индикатору, что делает его не уязвимым перед разными счетами или брокерами.
С Уважением Михаил
FREE

The indicator is based on two Moving Averages. Its only difference from traditional indicators is that it is presented as a histogram. The histogram has four colors; each color represents a MA with its own period. In case of a descending trend, if a price is lower than a moving average, the indicator displays a value lower than the red zero level. In case of ascending trend, the indicator value is higher than the green zero level. Parameters: Period MA 1 - Period of the first moving average. MA
FREE
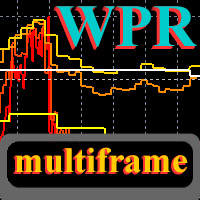
WPR Mtf
This is a multi-frame version of the standard indicator " Williams Percent Range ". Like the other indicators of the author, it allows you to see any set of timeframes at the same time, and all they will be presented on a scale of the current price chart. You can choose any set of timeframes of the indicator and freely switch to the price chart in both the highter and the lower direction. For each price period, indicator charts will always be displayed at the correct scale. The indica

Relative Strength Index Cross [RSI Cross] A combination of 2 RSI to create a crossover trading setup Input parameters: signal mode: set it to true if you want to plug it into STAT (Signal Tester and Trader) arrow shift: distance between fast EMA line to arrow on chart price line filter fast RSI period slow RSI period RSI price method price upper level price lower level You can find the best setting for 4 hour EURUSD on this video
FREE

The most effective signals generated by Ichimoku strategies. Ichimoku Trade Alarm is a supplement for Ichimoku Trade Panel and it shows the signals that Expert Advisor reacts to.
Visualization of signals: Price / Kijun sen cross - the candle body must be between Min_Candlestick_Body and Max_Candlestick_Body. The candle must close above / below Kijun sen, minimum in 1/3 of its body. Open candle must be located above / below Kijun sen. Chinkou span must be under the price of 26 periods in advan

At the very least, this indicator is able to entertain you. It builds a moving line based on interpolation by a polynomial of 1-4 powers and/or a function consisting of a sum of 1-5 sine curves. Various combinations are possible, for example, a sum of three sine curves about a second order parabola. The resulting line can be extrapolated by any of the specified functions and for various distances both as a single point at each indicator step (unchangeable line), and as a specified (re-painted) f

RSI indicator with signal lines, at the intersection of which a corresponding notification will be issued, which can be in the form of a normal alert, or in the form of a user sound file.
The indicator also has the function of sending push-notifications and email notifications at the intersection of these levels.
The values of the levels can be set independently in the indicator settings, and, if desired, they can be changed and configured directly in the indicator window. To check the op

BBMA INDI https://www.mql5.com/en/users/earobotkk/seller#products This Indicator marks entry set-up for buy and sell. It will also send alerts when arrow forms, including via push notification to your mobile phone. It is very convenient when you want to be notified of the entry set-up while you are away from your chart. It also calculates maximum pips gained for each 1st set-up. Setting · You could choose two types of alert, pop-up desktop and push notification to your mobile phone. ·

Buy and sell signals using the MACD histogram. The interface is simple and easy to understand. You can perzonalize the indicator in several ways according to its visual style or even more importantly, its setting of parameters to detect market signals. Using the Multiplier option in the menu you can increase the indicator period although it is recommended to use the default settings.
FREE

Read Elliott wave principle automatically. With the Swing Reader, you can easily read the Elliott Wave Principle through an automatic system. With swing, we mean a ZigZag market that is created by a breakout of its standard deviation. You can set the deviation manually, or you can let the indicator do it automatically (setting the deviation to zero).
Advantages you get Never repaints. Points showing a horizontal line, in which statistically a long wave ends. Candles showing a vertical line in

SMOOTH STRENGTH METER INDICATOR (SMOOTH LINE) it draws Currencies TREND Volatility Power / Strength lines : - Detects the 2 highly TRENDED Volatile pairs ( will be the Bold Lines ) - A very Helpful Indicator - It draws smooth lines for up to 20 currencies pairs representing Volatility strength and power - First it indicates the most powerful trended direction pairs : Strongest / Weaker - MAIN FUNCTION :it gives indication of the UP trend most Volatile Line and the DOWN

CCFp (Complex_Common_Frames percent) は、通貨の強弱を判断する指標で、
各通貨ごとの「短期移動平均」と「長期移動平均」の変化率の総計を示しています。
USD、EUR、JPY、CHF、GBP、AUD、CAD、NZDの8つの主要通貨に対して対応しております。
1.グラフの右端に通貨名を表示します。
2.各通貨の表示色を変更できます。
3.移動平均平滑化タイプ(ENUM_MA_METHOD)が選択可能です。
4.価格定数(ENUM_APPLIED_PRICE)が変更可能です。
5.短期移動平均期間(Fast)を変更できます。
6.短期移動平均期間(Slow)を変更できます。
***28通貨ペアが全て選択されていることが必要です。
***週足よりも小さい時間足利用を推奨します。
FREE

Price Difference インディケータは始値と終値の違いを示します。別ウィンドウのインジケーターは、現在のバーの始値と前のバーの終値の差です。左上隅のボードは、現在のバーの始値と終値の差です。
設定 Count_Bars-インジケーターデータを表示するバーの数。0の 場合、使用可能なすべてのバーに表示されます。 display- デジタル値の表示を有効にします。 _fontsize- 別のウィンドウのインジケーターのフォントサイズ。 color_up- 別のウィンドウのインジケーターの正の値の色; color_dn- 別のウィンドウのインジケーターの負の値の色; color_txt- スコアボードのピリオドの名前の色。 _angle- 別のウィンドウのインジケーターのテキストの傾斜角度。 ゼロ -別のウィンドウのインジケーターのテキストの自動増加。
FREE

YOU DON'T HAVE TO SHIFT ON ALL TIME FRAMES FOR EACH CURRENCY PAIR TO CONCLUDE ITS TREND AND ITS POWER YOU HAVE IT ALL IN ONE TABLE , 20 CURRENCY PAIR WITH 5 TIME FRAMES ALSO , COMPARE BETWEEN CURRENCIES STRENGTH AND ALERTS THE STRONGER /WEAKER PAIR BASED ON 5 TIMEFRAMES CALCULATIONS The Power meter currencies table is a very helpful tool to indicate the TREND strength of up to 20 currencies pairs using 5 time frames M5 M30 H1 H4 and D1 ( latest version You SELECT you own 5 timeframes from M1 t
Become a constantly profitable 5-star forex trader!
We offer a few indicators to support you understand and analyse the market! With our strategies you will improve your trading system and bacome an expert...
We have indicators for trend direction, market direction and others.. for multi-time frames and that covers all majors or your favorite trading symbols! Some of them offer a customizable calculation parameters... or Graph features!
See how powerful they are! The are also easy-to-use
FREE

The standard RSI indicator is very helpful in identifying overbought or oversold areas during a flat, but gives a lot of false signals when the market is trending. For example: during an uptrend, the standard indicator often enters the "oversold" zone and extremely rarely (most often, when the trend has already ended) enters the "overbought" zone. This indicator takes into account the trend movement and, with the selected settings, can enter the zone opposite to the trend direction, giving a sig
FREE
This indicator is a modification of the classic Parabolic support and resist (PSAR) indicator. The indicator has two customizable ranges, which allows you to identify long-term and short-term trends. The indicator has the ability to generate signals and send notifications about them to email and the terminal. A time-tested product that allows you not only to determine entry/exit points, but also reasonable levels for placing protective stop orders.
FREE

Introducing Momentum Jurik—an innovative indicator designed to optimize your forex trading strategy by incorporating custom moving averages based on the Momentum indicator with the MetaTrader 4 indicator, Momentum.
Jurik moving averages are renowned for their precision and reliability in analyzing price movements in the forex market. They provide traders with smoother representations of price action, reducing noise and offering clearer signals for identifying trends and potential reversals.
FREE
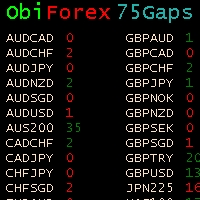
Gaps Size 75 - Market Gap Indicator The Gaps Size 75 indicator reveals the gaps between the current day and the previous day, aiding your trading decisions. It is designed for the "END OF WEEK GAPS" strategy, allowing you to identify potential opportunities. This indicator supports up to 75 currency pairs, with additional pairs available upon request. The columns are color-coded for easy interpretation. For inquiries regarding the weekend gaps strategy, kindly send a private message. Gaps Size 7
FREE
Standard deviation with levels is a modification of the Standard deviation indicator, supplemented by the levels of expected Highs and Lows. The levels are plotted using the Support and resistance bands indicator, which determines the High and Low levels nearest to the current indicator value based on the historical values of the extremes.
Parameters standard deviation period - period of the standard deviation indicator. extremum detector period - period of extremum detection. This parameter
FREE
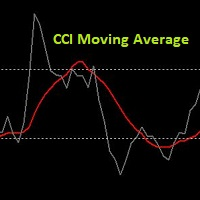
It's a very simple indicator. This is simply the CCI moving average. The CCI Moving Average Indicator allows us to reduce false signals and optimize our trading. The required indicator inputs are: CCI Period, CCI Applied Price, Period of CCI Moving Average and Method of CCI Moving Average. The chart displays the original CCI and its moving average. This is my first indicator that I publish. I hope the indicator will benefit you. The author of this indicator is Tomasz Buliński.
FREE

The indicator displays the signals of the RSX oscillator. The main type of signal is given when the oscillator exceeds the 0 value. If the "Sensitivity" parameter increases above zero, the main signal will also be given when overbought/oversold levels are overcome, defined as zero plus sensitivity and zero minus sensitivity. An additional signal is given when the direction of the oscillator line changes. It is optimal to use the indicator signals as signals to open a trade when the price overcom
FREE
The purpose of this new version of the MT4 standard indicator provided in your platform is to display in a sub-window multiple timeframes of the same indicator. See the example shown in the picture below. But the display isn’t like a simple MTF indicator. This is the real display of the indicator on its timeframe. Here's the options available in the FFx indicator: Select the timeframes to be displayed (M1 to Monthly) Define the width (number of bars) for each timeframe box Alert pop up/sound/ema
FREE
Double Smoothed Stochastics – DSS Bressert is an oscillator introduced by William Blau and Walter Bressert. The calculation of DSS Bressert values is similar to the stochastic indicator. The confirmation of the indicator's signal is the overcoming by the price of the high/low of the bar on which the signal was given by the indicator.
Settings: Price - the price at which the indicator is calculated; EMA_Period - smoothing period; Stoch_Period - oscillator period;
OB_Level - overbought level;
FREE
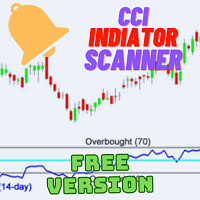
Introduction: Welcome to the world of advanced trading tools! Introducing the CCI Multicurrency Scanner, an exceptional MT4 indicator designed to revolutionize your trading experience. With its powerful features and comprehensive insights, this tool will empower you to make informed decisions and maximize your profitability. Features: Efficient Multicurrency Scanning: Our CCI Multicurrency Scanner swiftly scans multiple currencies based on your inputs. Receive instant alerts when specific condit
FREE
The product is based on J.F. Ehlers' Center of Gravity indicator. Center of Gravity actually has a zero lag and allows to define turning points precisely. The indicator is a result of Ehlers' research of adaptive filters. It identifies main pivot points almost without any lag. The indicator places signals on the price chart according to COG data. The indicator does not repaint.
Parameters:
Length - indicator calculation period; MaPrice - price used to calculate the indicator; Signal - ind
FREE

I make this indicator to help you for setting effective stoploss and getting more signals from following trends. This indicator helps to tell the trends and sideway, when 2 lines stand above of blue cloud, it means uptrend. When 2 lines stand above red cloud, it means down trend, the other else, it means sideway market. For taking order, you have to wait the arrows. You also need to see the cloud position, if the cloud's res, you have to wait the yellow arrow for selling order. If the cloud's bl
FREE

このエキスパートは、同じ指標と組み合わせて機能するように設計されています。 https://www.mql5.com/ru/market/product/34834
専門家は画面には何も表示せず、取引もしません。 それは指標の計算のみを実行します、これはあなたのコンピュータリソースを節約するために行われます。 エキスパートはMarket Watchのシンボルを扱うので、テスターでそれをテストする方法はありません。 使用のための指示: 0)インディケータに表示されるMarket Watchで必要なシンボルを選択してください。 (注:!!!設定で使用する前に、必ず自動チェック機能を無効にしてください!!!)
1)任意の時間枠で任意の商品のチャートを開き、その上にこのエキスパートを置きます。 画面上のコメントがマーケットウォッチからのすべての文字を表示しなくなるまで待ちます。その後、このウィンドウを閉じたり、このエキスパートを削除したりしないでください。 エラーが発生した場合、またはエキスパートが動けなくなった場合は、もう一度起動してください。
2)同じ名前の無料のインディケータをダ
FREE

Introducing CCI Jurik—a dynamic indicator designed to elevate your forex trading experience by integrating custom moving averages based on the Commodity Channel Index (CCI) with the MetaTrader 4 indicator, CCI.
Jurik moving averages are renowned for their accuracy and reliability in analyzing price movements in the forex market. They offer traders a smoother representation of price action, reducing noise and providing clearer signals for identifying trends and potential reversals.
The Commo
FREE
Displays current spread in the main window of the chart. Indicator Setting: BigDisplay =true or false to switch on and off.
DisplaySize = 20 is default
DisplayColor = Blue
Display_y = 550 position: staring position Y of background panel
Display_x = 1200 position: staring position X of background panel
Author: Happy Forex (Expert Advisor - your algorithm-driven profit, without stress or work)
FREE
This indicator displays on the price chart (coloring candles graphics) signals about the standard MACD crossing the zero value, as well as about crossing the signal line. The indicator does not redraw.
Custom Parameters: Fast_EMA_Period - fast moving average period; Slow_EMA_Period - slow moving average period; Signal_Period - signal line period; MACD_Price - the price at which the indicator is built;
FREE
MetaTraderプラットフォームのためのアプリのストアであるMetaTraderアプリストアで自動売買ロボットを購入する方法をご覧ください。
MQL5.community支払いシステムでは、PayPalや銀行カードおよび人気の支払いシステムを通してトランザクションをすることができます。ご満足いただけるように購入前に自動売買ロボットをテストすることを強くお勧めします。
取引の機会を逃しています。
- 無料取引アプリ
- 8千を超えるシグナルをコピー
- 金融ニュースで金融マーケットを探索
新規登録
ログイン
