RC ATR Volatility Hedge Zones Ltd MT4
- Indicadores
- Francisco Rayol
- Versión: 1.0
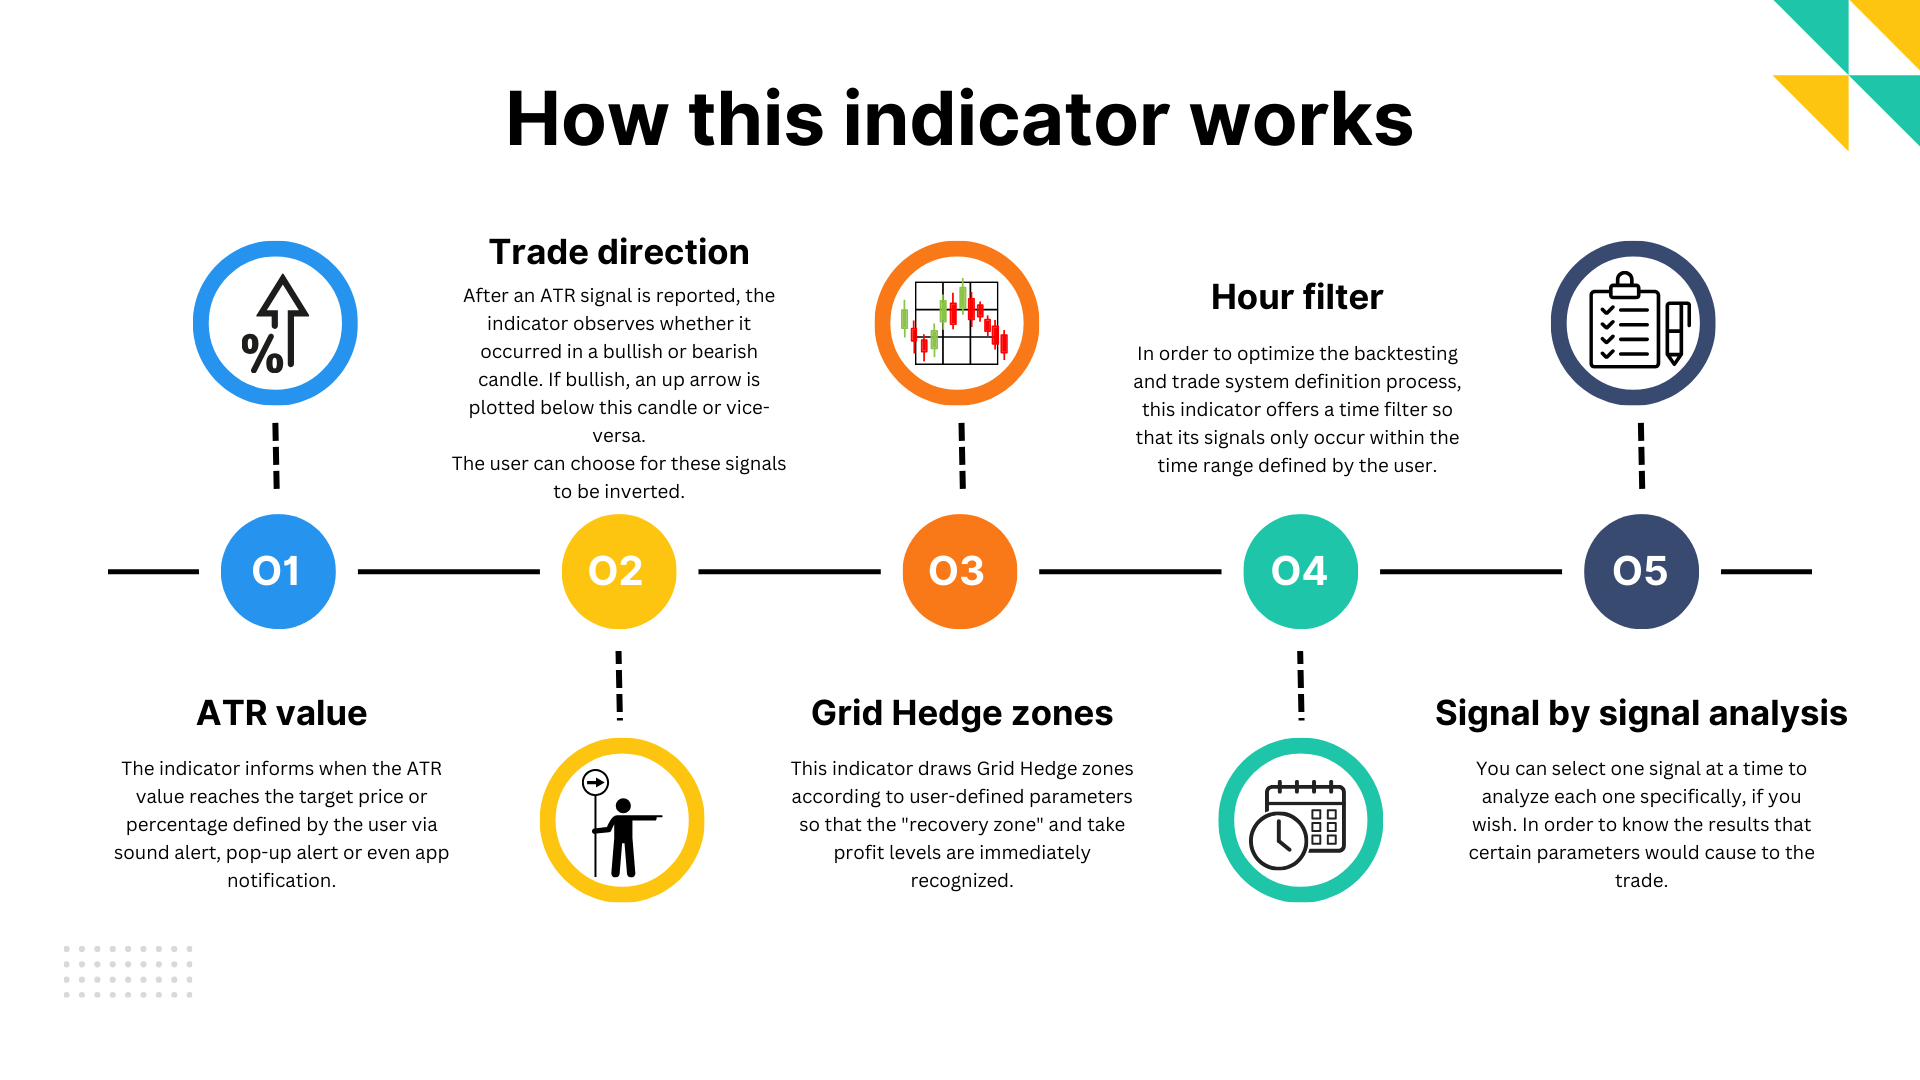
This indicator informs the user when the ATR is above a certain value defined by the user, as well as when the ATR prints a percentage increase or percentage decrease in its value, in order to offer the user information about the occurrence of spikes or drops in volatility which can be widely used within volatility-based trading systems or, especially, in Recovery Zone or Grid Hedge systems.
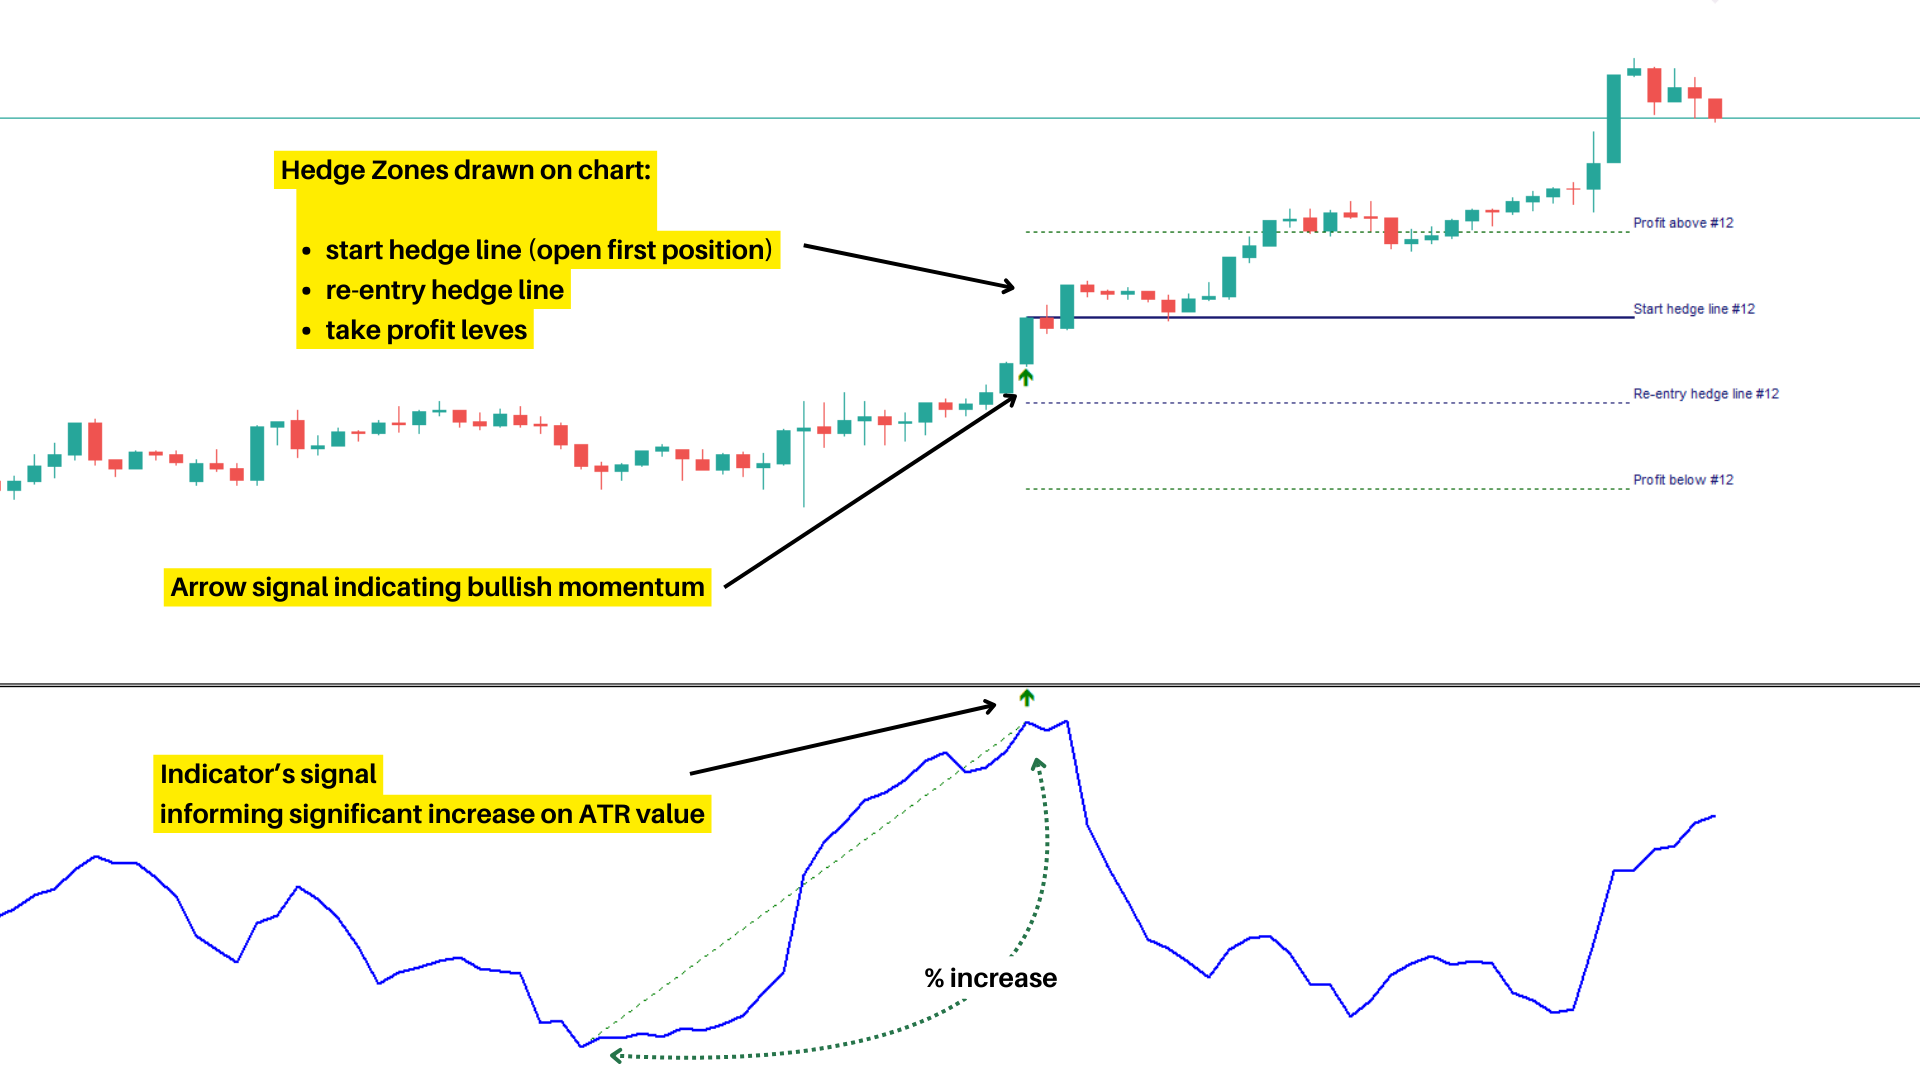
Furthermore, as the volatility aspect is extremely determining for the success rate of any system based on Recovery Zone or Grid Hedge, this indicator also draws on the chart the entry, re-entry and take profit zones for the Recovery Zone or Grid Hedge trading system, so you can easily backtest any asset and conclude by which distances and parameters you will have a trade system that suits your needs using this indicator.
Best set files for download here.
FOR FULL MT4 VERSION: CLICK HERE
What is the ATR
The ATR (Average True Range) indicator calculates the average range between high and low prices, taking into account gaps and price fluctuations. This dynamic measurement adapts to changing market conditions, offering a reliable gauge of volatility. Traders can customize the ATR settings to suit their trading style and time frame, making it adaptable for various strategies. It quantifies market volatility, helping traders identify periods of high or low volatility. This information is crucial for adjusting risk management and setting appropriate stop-loss and take-profit levels. By incorporating the ATR into your trading system, you can confirm trends and distinguish between noise and significant price movements. This aids in making informed trading decisions and avoiding false signals.
How to trade using this indicator
This indicator's main purpose is to provide the user information on when the ATR is showing a significant increase or decrease in value. And why is this important? Well, as known, a sideways market does not offer opportunities for gains with favorable risk/return to the trader. Likewise, it makes it impossible for certain trading systems to be truly profitable. Therefore, this indicator can be used mainly in two ways:
a) or as an additional signal for your trading system already based on volatility or that requires the asset not to be in a sideways scenario;
b) or within a "Grid Hedge" type trading system in which as soon as the indicator alerts about the emergence of a new significant increase in ATR and, therefore, volatility, the trader opens positions within a Recovery Zone or Grid Hedge System. The biggest disadvantage of any "Grid Hedge" System is when operated within a sideways moment of the market. However, with the assistance of this indicator, the expectation that sideways scenarios will be avoided and, as a result, the Grid Hedge-based trading system will benefit. (click here for more details on the Recovery Zone or Grid Hedge System)
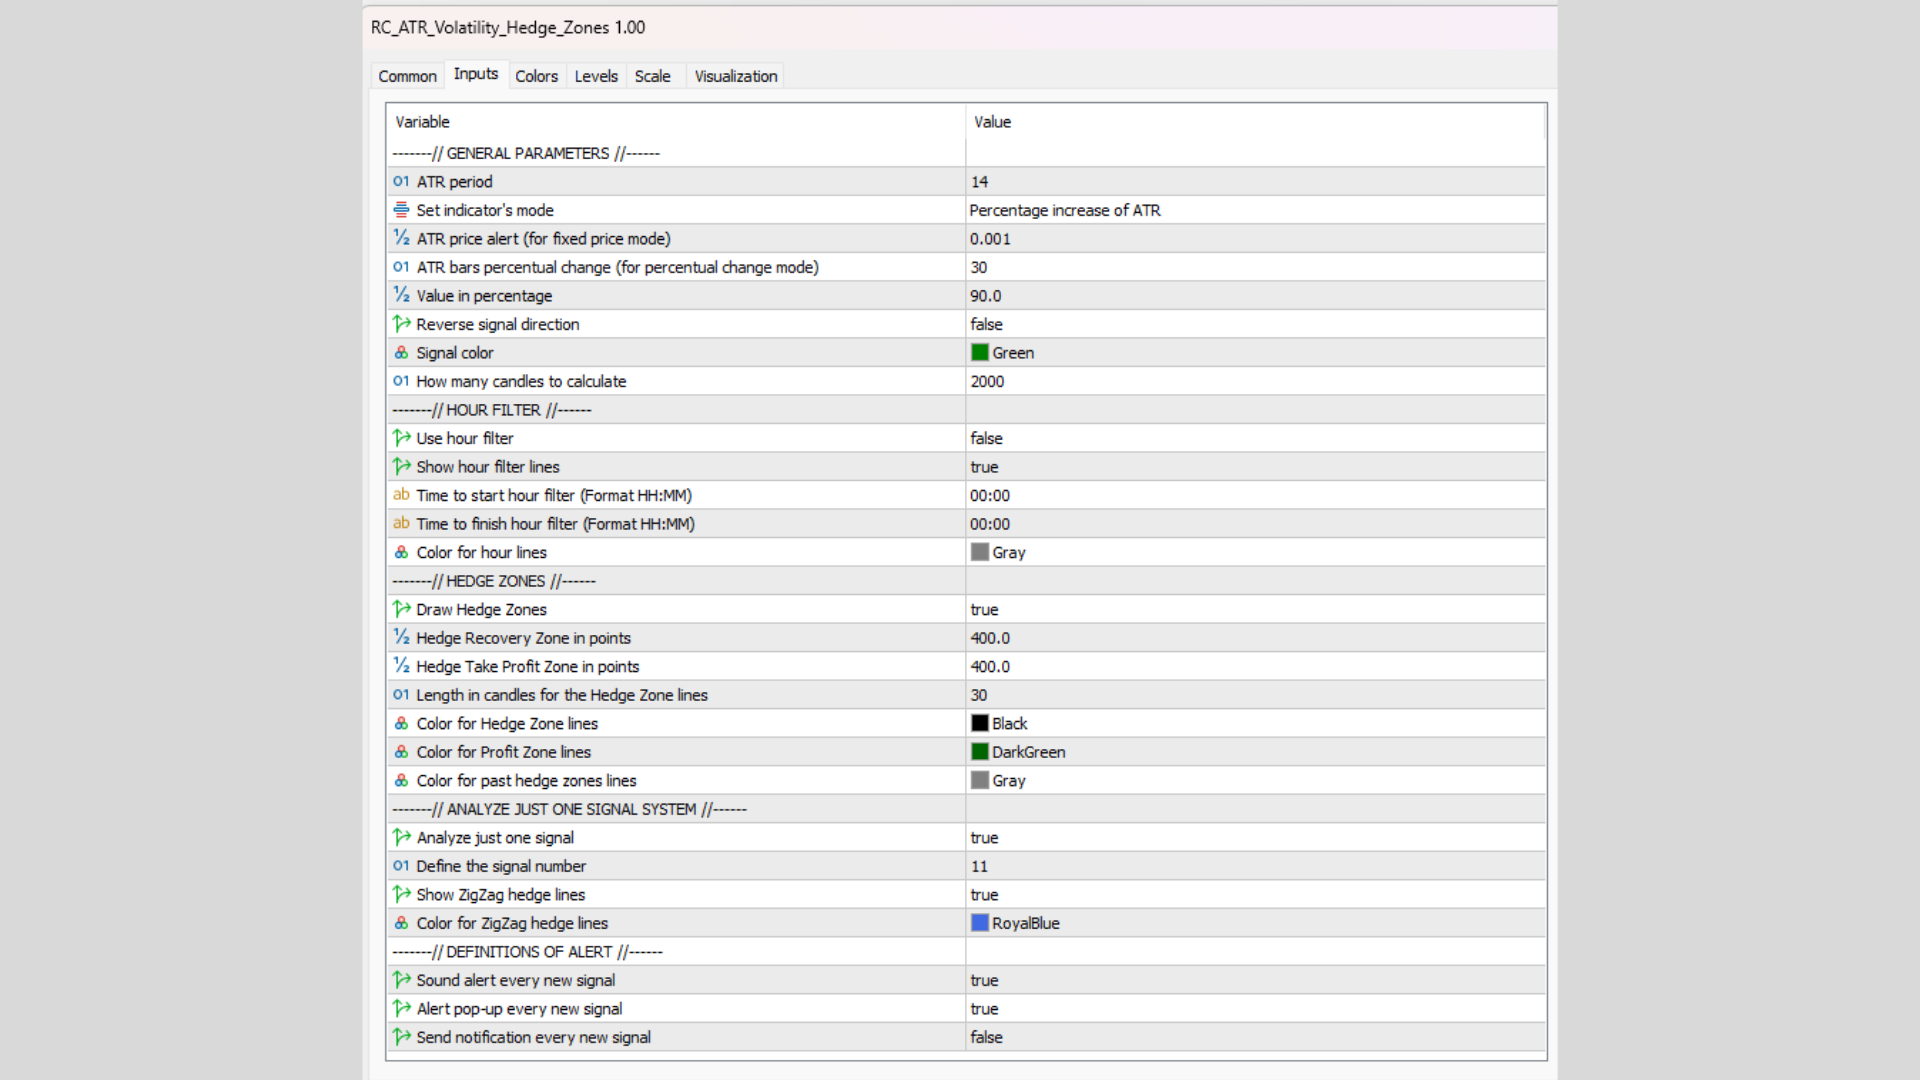
Input parameters
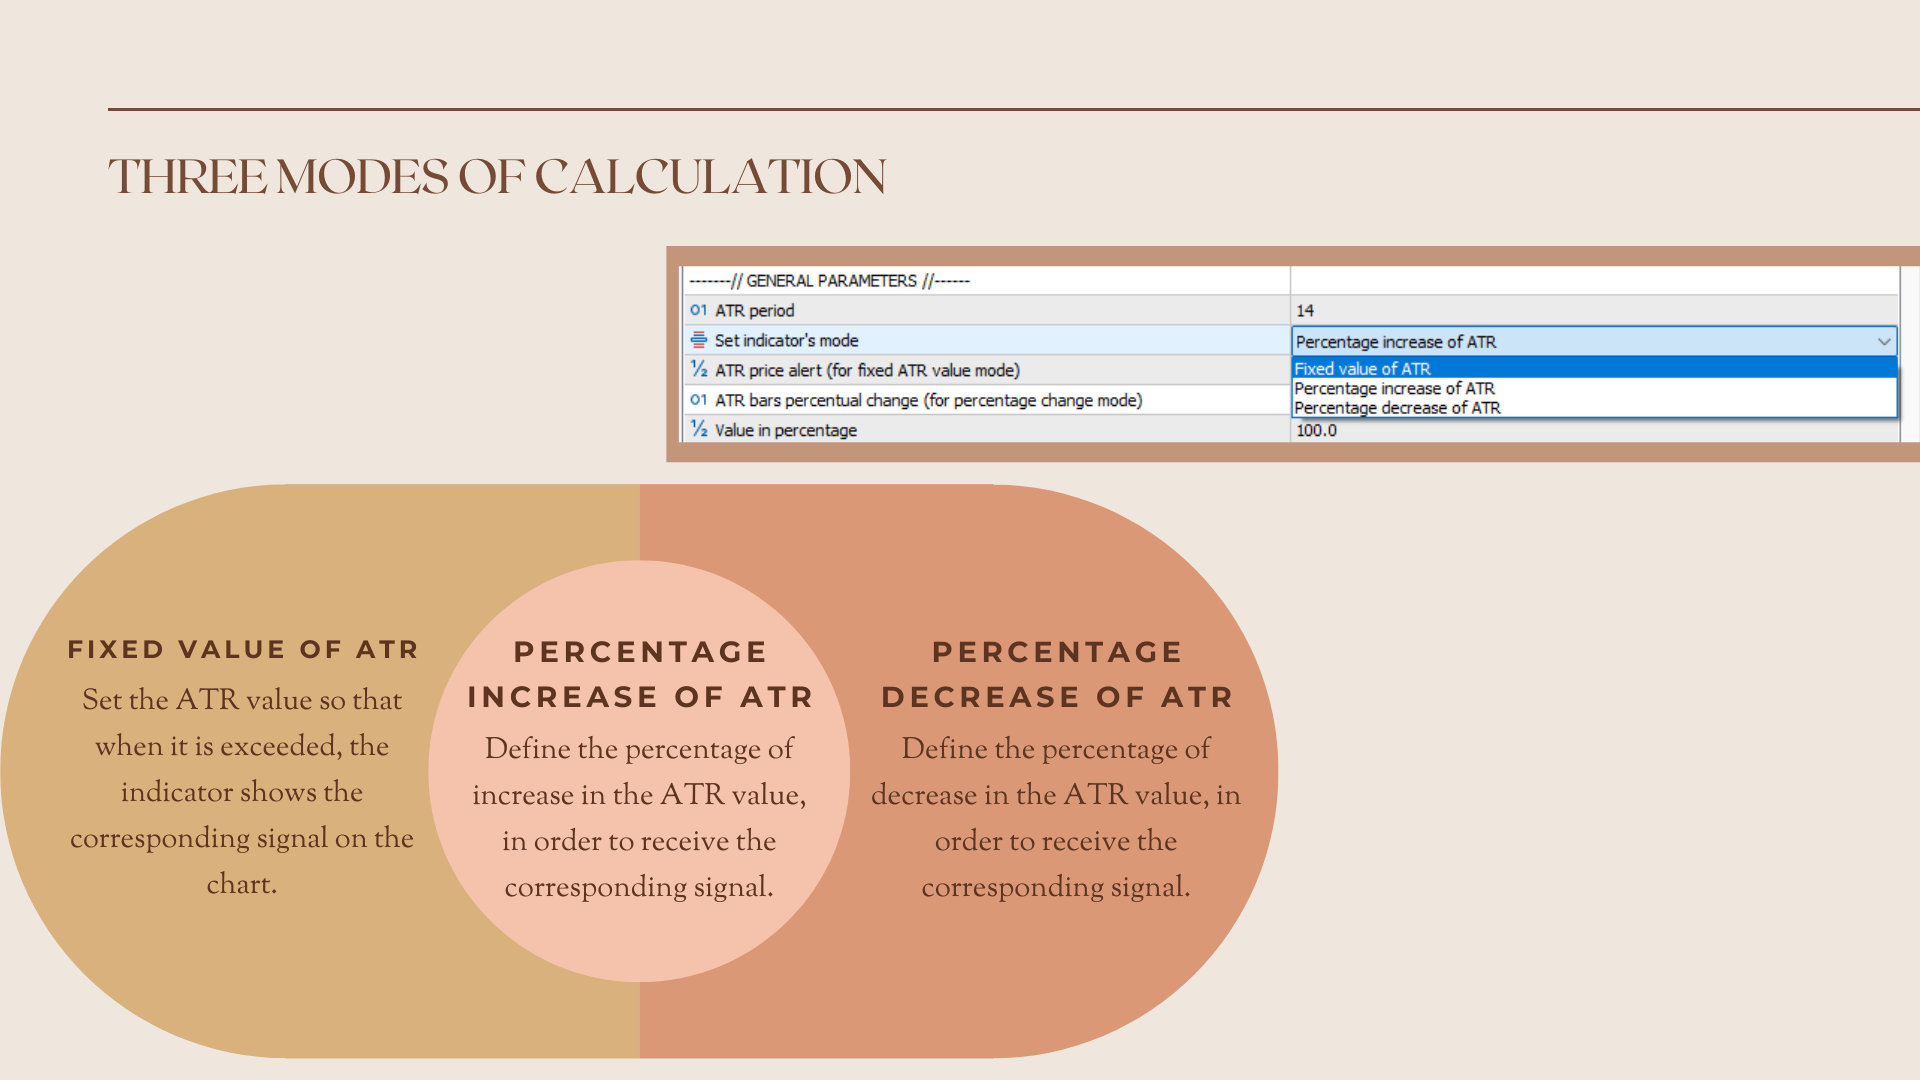
- General parameters: Set the ATR period; Set the indicator's mode: a) fixed price level defined by the user, b) percentage increase of ATR, c) percentage decrease of ATR; ATR price alert (for fixed price mode); ATR bars percentage change (for percentage change mode); Value in percentage; Reverse signal direction (true or false); Signal color; How many candles for the indicator to calculate.
- Hedge zones: Draw hedge zones (true or false); Hedge recovery zone in points; Hedge take profit zone in points; Length in candles for the hedge zone lines; Color for the hedge zone lines; Color for profit zone lines; Color for past hedge zones lines.
Additions you find on the full version of this indicator:
- Time hours filter, so that the user can backtest and have signals only within the time range compatible to his trading routine
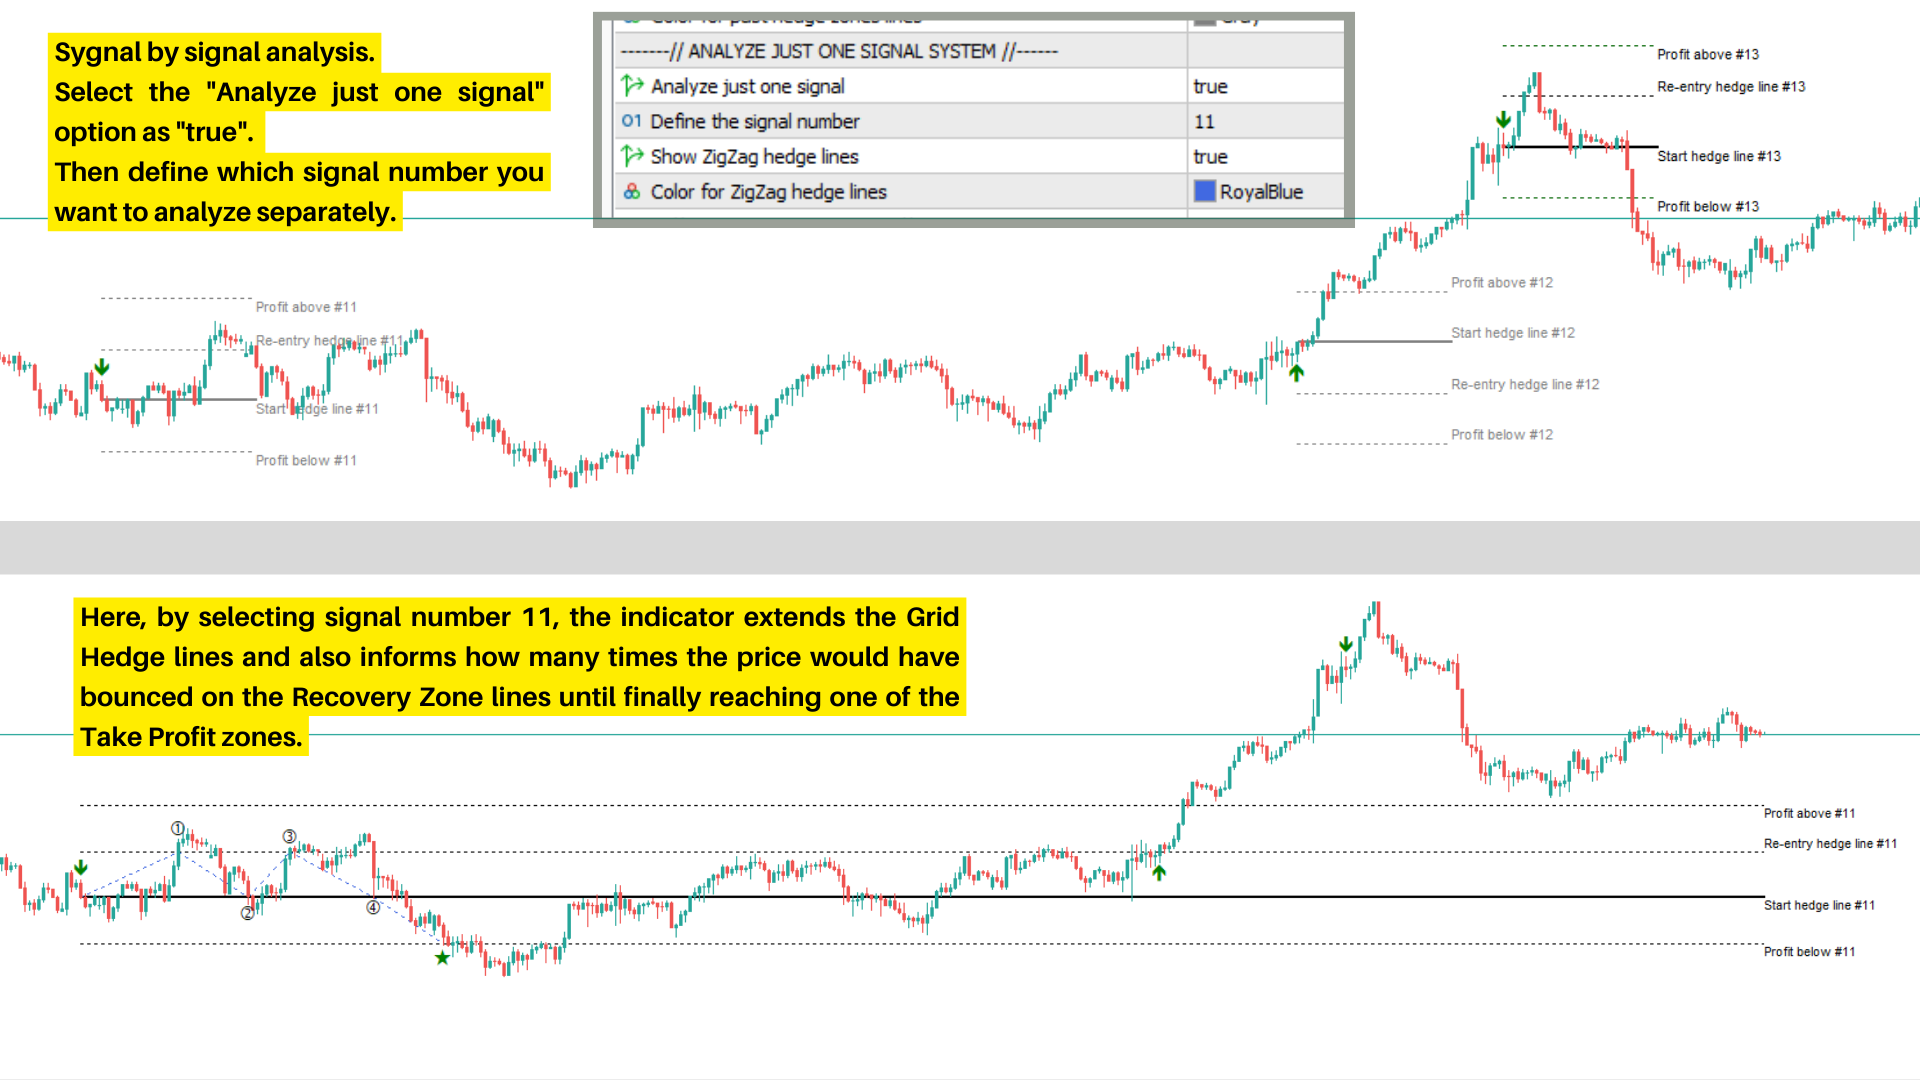
- It allows the user to analyze each signal separately, including knowing how many times the price bounced on the Recovery Zone lines
- Switch on/off Alerts and App Notifications when new signals occur
Disclaimer
By purchasing and using this indicator, users agree to indemnify and hold harmless its author from any and all claims, damages, losses, or liabilities arising from the use of the indicator. Trading and investing carry inherent risks, and users should carefully consider their financial situation and risk tolerance before using this indicator.