Is the MT5 'Strategy Tester' bugged or just 'by design' broken ?
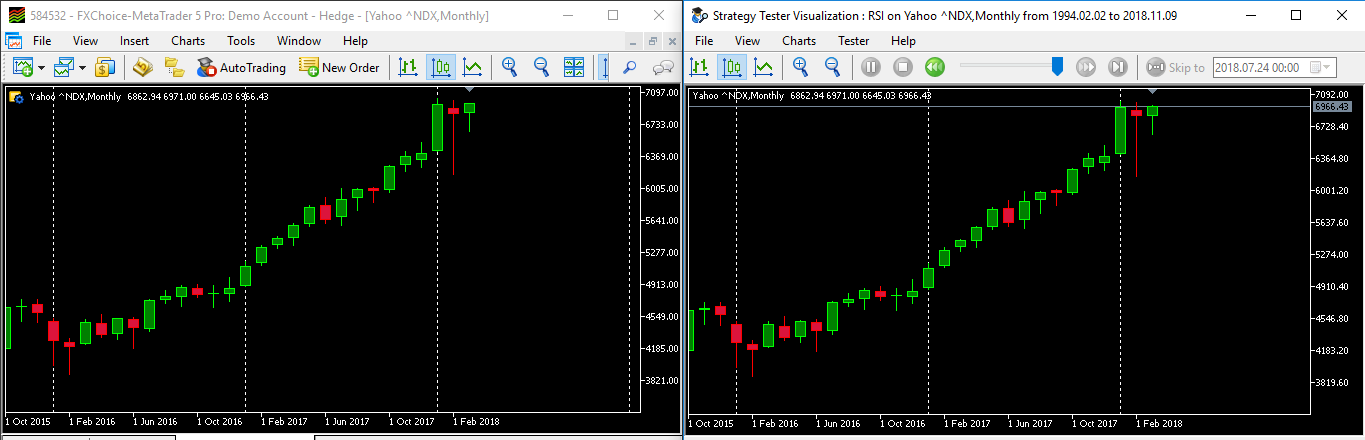
I have a custom symbol based on D1 Nasdaq data from Yahoo finances (exported MT5 data here: https://1drv.ms/u/s!AkWFtUMYnskYjqkzdhvArjI2aLlsPA). The issue is that the Strategy Tester MN1 chart is different from the terminal MN1 and hence my signals activate a little differently and more importantly I have no confidence in the results. This is clearly seen in the most recent three bars in the image below, the left is strategy tester and right is the terminal - the strategy tester second last candle is DIFFERENT!
Please note I have tried 'Every tick', 'Every tick based on real ticks', and 'OHLC' with same results.
https://1drv.ms/u/s!AkWFtUMYnskYjqlW5Za2fqSiKwmSvA
Now is this by design? This forum topic seems to imply so www.mql5.com/en/forum/99267 and so does this article: https://www.metatrader5.com/en/terminal/help/tick_generation#tick_mode. But even if so I still don't get how the MN1 chart is different, my source data is of D1 resolution so at minimum 28 ticks per month. OR am I doing something wrong and the two charts should not be different?
Are there any workarounds this data discrepancy?
.. second last candle is DIFFERENT!
.. OR am I doing something wrong and the two charts should not be different?
Hi,
No, that is not your fault.
I knew that since long years ago.
Tick price must be the same.
but candlestick could be have different shape.
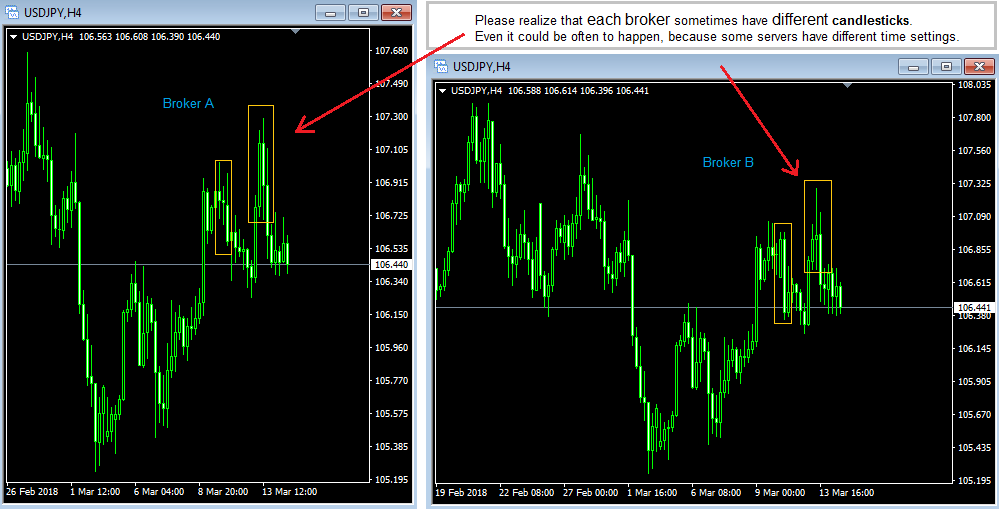
Please check also how the candlestick form sourced apart from Yahoo finance.
As example, compare Yahoo Finance with Bloomberg, CNBC, and so on.
Who knows, you will find a different shapes in critical time :)
Hi,
No, that is not your fault.
I knew that since long years ago.
Tick price must be the same.
but candlestick could be have different shape.
Please check also how the candlestick form sourced apart from Yahoo finance.
As example, compare Yahoo Finance with Bloomberg, CNBC, and so on.
Who knows, you will find a different shapes in critical time :)
I think you missed the point Yohanna. The reported difference is with the same underlying data (imported from Yahoo). Nothing to do with the normal differences between brokers, unless I missed something.
Ohh.. (shy)
I thought he compares the MT5 data vs. Yahoo Finance
yes I missed that, sorry .. :)
Ok, I have just re-imported and re-created the symbol and attached a example indicator ('Examples\Momentum.ex5) and the outcome is the same. That is the candle data differs between strategy tester and the terminal.
Can someone please try it on their machine as a sanity check to see if they experience same issue:
- import the Symbol definition here: https://1drv.ms/u/s!AkWFtUMYnskYjqojiAalAeYxUdlDJQ
- the D1 daily data here: https://1drv.ms/u/s!AkWFtUMYnskYjqkzdhvArjI2aLlsPA
Then open the MN1 chart in the terminal and compare it to a Strategy Tester MN1 chart - do they differ?
Forum on trading, automated trading systems and testing trading strategies
Why different result on strategy tester?
danielsokolowsk, 2018.11.09 22:29
I suspect this: https://www.mql5.com/en/forum/263140 might be related as that is still an issue, there should be a Service Ticket I submitted for it a bunch while ago if you can access it.
As you said in the other topic it's still an issue I checked, using your csv/json to create a custom symbol.
As you can see I have no discrepancies (MT5 build 1643).
I would like to know how this data was imported and expecially the datetime fields.
There is a lot of talk about MT5 being buggy but there is little code shown so it's hard to confirm if it's a bug or a coding error.
- Free trading apps
- Over 8,000 signals for copying
- Economic news for exploring financial markets
You agree to website policy and terms of use
I have a custom symbol based on D1 Nasdaq data from Yahoo finances (exported MT5 data here: https://1drv.ms/u/s!AkWFtUMYnskYjqkzdhvArjI2aLlsPA). The issue is that the Strategy Tester MN1 chart is different from the terminal MN1 and hence my signals activate a little differently and more importantly I have no confidence in the results. This is clearly seen in the most recent three bars in the image below, the left is strategy tester and right is the terminal - the strategy tester second last candle is DIFFERENT!
Please note I have tried 'Every tick', 'Every tick based on real ticks', and 'OHLC' with same results.
https://1drv.ms/u/s!AkWFtUMYnskYjqlW5Za2fqSiKwmSvA
Now is this by design? This forum topic seems to imply so www.mql5.com/en/forum/99267 and so does this article: https://www.metatrader5.com/en/terminal/help/tick_generation#tick_mode. But even if so I still don't get how the MN1 chart is different, my source data is of D1 resolution so at minimum 28 ticks per month. OR am I doing something wrong and the two charts should not be different?
Are there any workarounds this data discrepancy?